We examine whether OPEC’s quotas for its African members are actually on the production decline path of these countries.
OPEC’s quota levels can be found here:
https://www.opec.org/opec_web/static_files_project/media/downloads/Voluntary%20Production%20Levels.pdf
At present 7 oil producing countries in Africa are members of OPEC:
Algeria, Nigeria, Libya, Angola (2007), Gabon (2016), Equatorial Guinea (2017) and Congo Brazzaville (2018) https://www.opec.org/opec_web/en/about_us/25.htm
Historic peaks
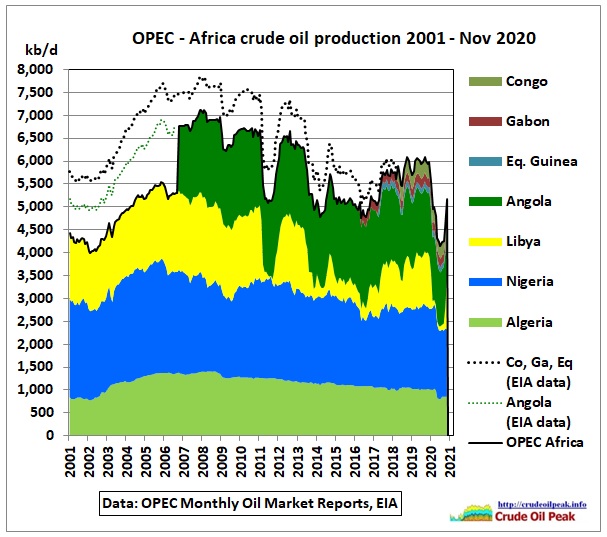 Fig 1a: African countries which joined OPEC
The stacking order in the above graph is important for understanding the history. We start with Algeria at the bottom because this country seems to have the most reliable production. Next in the stack is Nigeria which shaped the November 2005 peak. Then Libya with an erratic production profile after the 17th February Revolution in 2011. Both Algeria and Libya were still growing when Nigeria peaked:
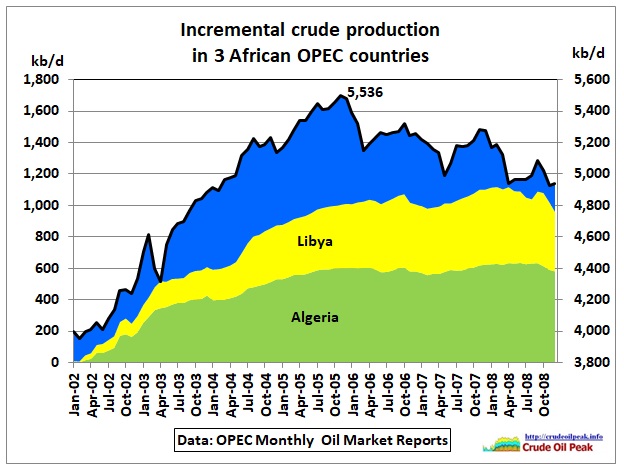 Fig 1b: OPEC w/o Angola peaked in Nov 2005 at 5,536 kb/d
OPEC then took in Angola in 2007 to overcome this embarrassing situation, but Angola itself also approached its peak a year later, in 2008, which shaped the common peak of 4 countries in Nov 2007 – Mar 2008 at 7.1 mb/d. The dotted lines in Fig 1a show production including Angola and 3 other countries before joining OPEC.
Trendlines
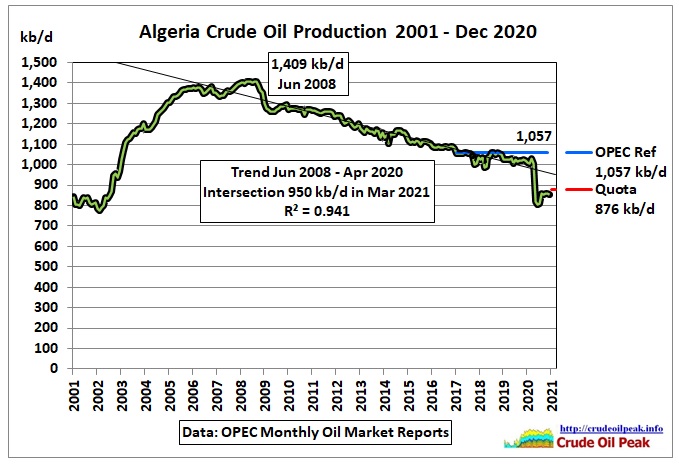 Fig 2: Algeria crude oil production
Algerian crude oil production peaked in June 2008. A trend line since then points to 950 kb/ for March 2021. Production between August and December 2020 was around 860 kb/d, near to the quota. The reference is approximately equivalent to the pre-Covid average since 2016.
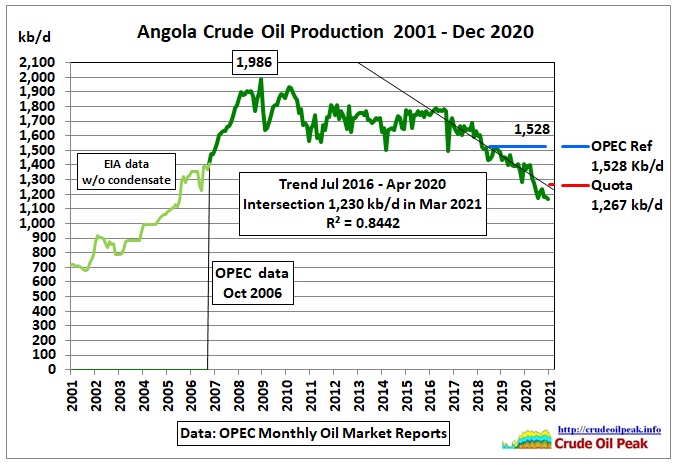 Fig 3: Angola crude oil production (EIA data minus 3.6% condensate)
Angolan crude oil production peaked in December 2008. A trend line starting in July 2016 (when there was a kink in the production trend) points to 1,230 kb/ for March 2021. Production in December 2020 has dropped to around 1,170 kb/d, below the quota. The reference is the production level in 2018.
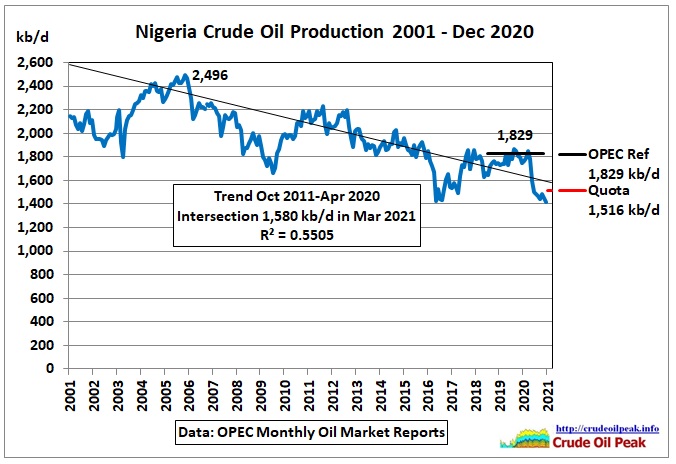 Fig 4: Nigeria crude oil production
Nigerian crude oil production peaked in November 2005. A trend line since then points to 1,580 kb/ for March 2021, slightly above the quota. But production in December 2020 has dropped to around 1,420 kb/d, below the quota. The reference is the highest production level achieved in 2019.
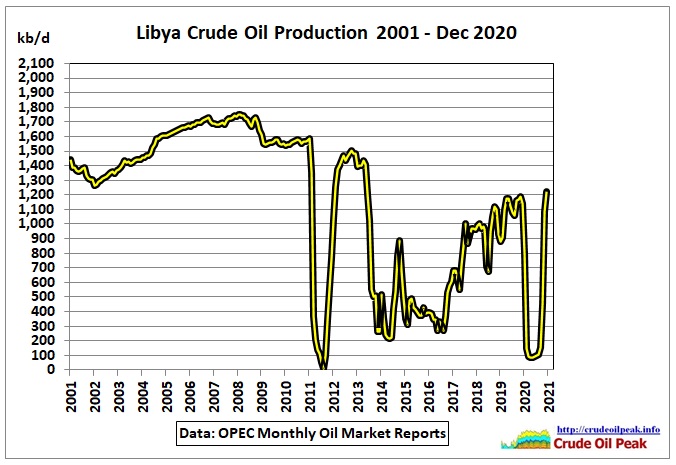 Fig 5: Libya crude production (not subject to OPEC quotas)
Libya peaked in February 2008, well before the civil war in 2011. This means that even if Libya had stayed at a pre-war production level of 1,600 kb/d, the peak shown in Fig 1a would still have remained.
24/6/2011 War overshadows peak oil in Libya
https://crudeoilpeak.info/war-overshadows-peak-oil-in-libya
As Libya’s oil production dropped, OPEC had to take in 3 other countries:
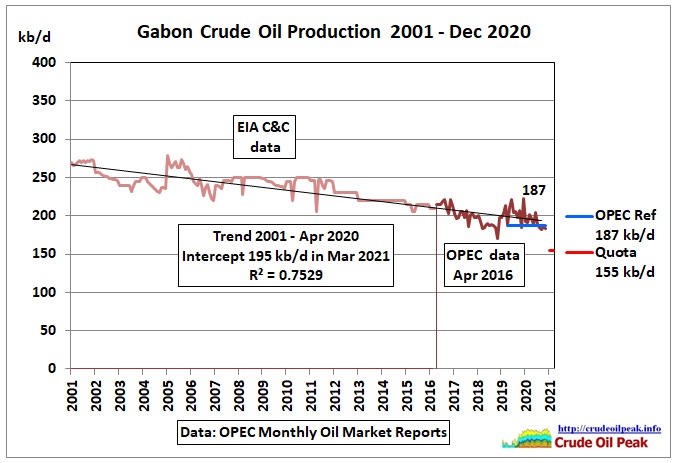 Fig 6: Gabon crude oil production (EIA condensate negligible)
Gabon crude oil production is in long term decline. A trend line points to 195 kb/ for March 2021. Production in December 2020 has dropped to around 180 kb/d, approximately the reference level, but above the quota.
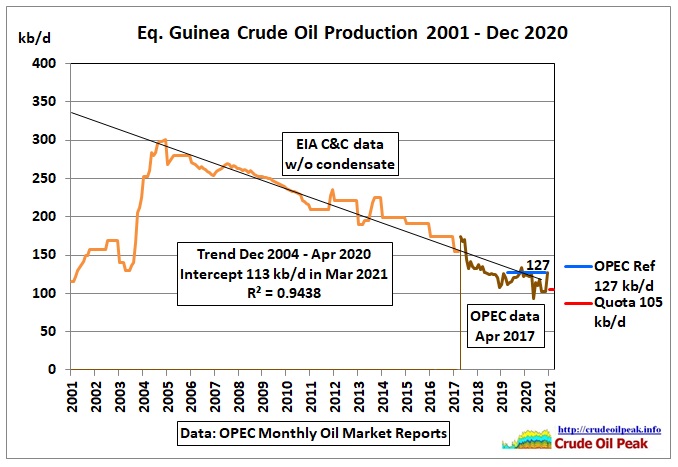 Fig 7: Equatorial Guinea crude oil production (EIA w/o condensate 23%)
Equatorial Guinea crude oil production peaked in Dec 2004. A trend line since then points to 113 kb/d for March 2021. Production in December 2020 was at the reference level, above the quota.
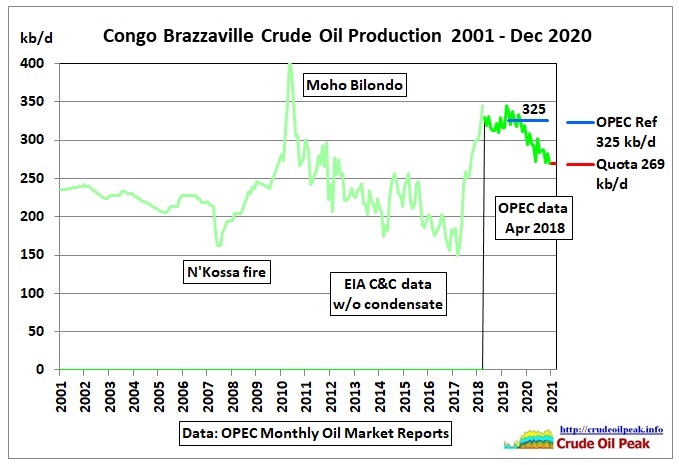 Fig 8: Congo (Brazzaville) crude oil production (EIA w/o 7% condensate)
A long-term trend line can’t be drawn in Fig 8 but it looks as if a 2nd (and last) peak has happened. A short term trend since March 2019 is pointing to 260 kb/d slightly below the quota level. The IMF, using actual production data until 2018, saw a peak for 2020, but the projections may have been too optimistic.
 Fig 8: IMF projections published in January 2020
Congo’s annual crude production (OPEC data) was 105 mb for 2020, not 140 mb.
The 3 new OPEC members added around 600 kb/d to its statistics. But this could not offset the decline of the 4 classical members from 7.1 mb/d in 2007/08 to 4.7 mb/d in Dec 2020 (which includes a Libyan recovery to 1.2 mb/d)
All together now
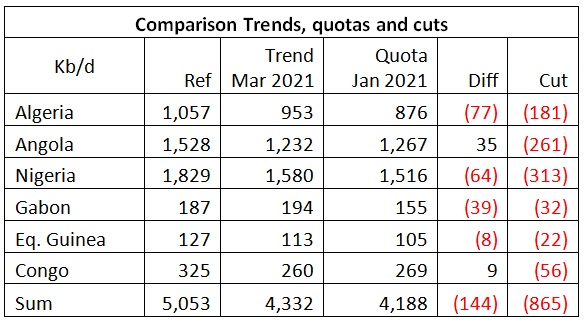 Fig 9: Summary table trends vs quotas
Conclusion
Production trends are inherently uncertain but seem to point towards 4.3 mb/d for March 2021. Quotas have been set just 144 kb/d below this estimated production level. The actual cuts are therefore much smaller than announced by OPEC (865 kb/d)
Related post:
5/2/2021
Peak oil in Africa (part2): Export zero sum game
https://crudeoilpeak.info/peak-oil-in-africa-part-2-export-zero-sum-game