In this 2nd part we use data from the BP Statistical Review (June 2020). BP’s definition of oil is different from OPEC’s crude oil used in part 1. It includes also shale oil, oil sands, condensates (lease condensate or gas condensates that require further refining) and NGLs (natural gas liquids – ethane, LPG and naphtha separated from the production of natural gas).
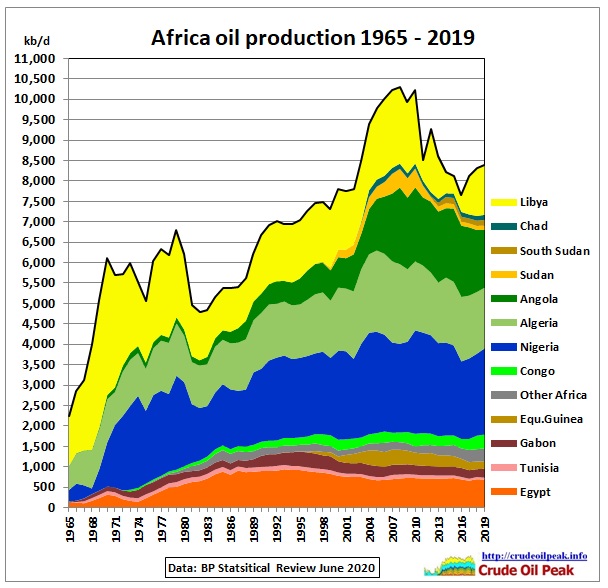 Fig 10: The African peak happened in 2008
The Egyptian peak in 1993 was very flat. Production declined by 27% (1% pa) since then. The group of countries at the bottom of the stack had together a quite stable production over 30 years.
In 2003, we see a sharp rise in production by the 4 major producers Algeria, Angola, Nigeria and Libya, helped by Sudan, until a double peak in 2008 and 2010. The 2019 data include 1.2 mb/d from Libya, a level achieved again in December 2020, but 600 kb/d lower than pre-war production in 2010.
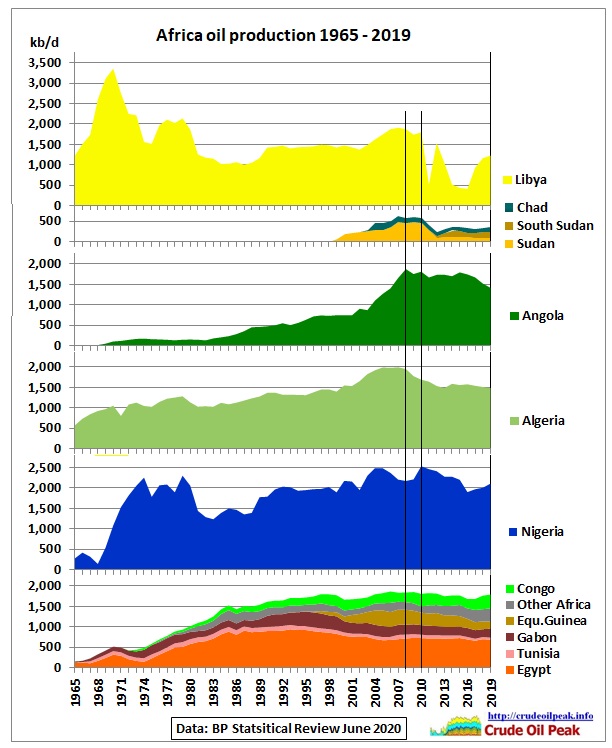 Fig 11: The vertical lines represent the double peak
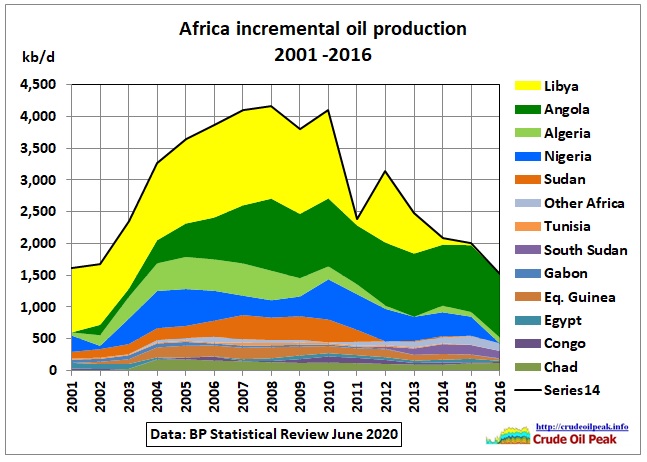 Fig 12: Incremental production shows details of peaking
As is often the case, we see a mixture of geological peaks and geo-political peaks.
Libyan oil production peaked in 2007 at 1.9 mb/d. The underlying oil production profile from Richard Miller (workshop 2nd November 2010) is here:
24/6/2011 War overshadows peak oil in Libya
https://crudeoilpeak.info/war-overshadows-peak-oil-in-libya
Even if Libya’s oil production had stayed flat at the peak level, total African production would not have grown because of the underlying peaks or production plateaus of the 3 next largest producers.
Production vs consumption
For those countries where BP provides consumption data, these are shown in following graphs:
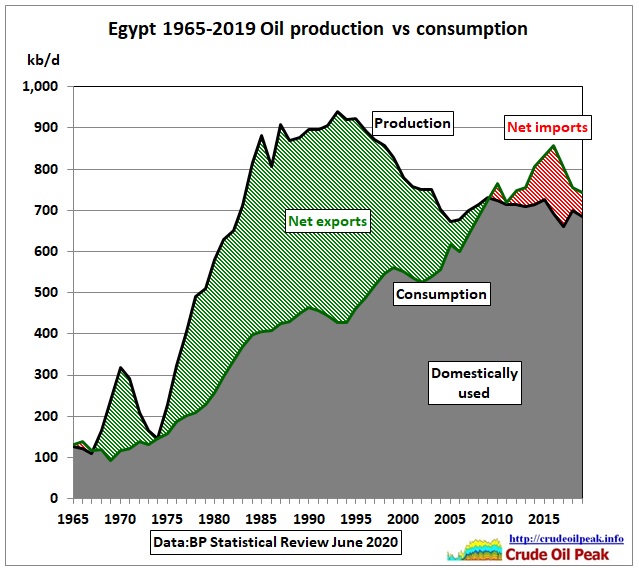 Fig 13: Egypt is a net importer since 2010 (population 100 million)
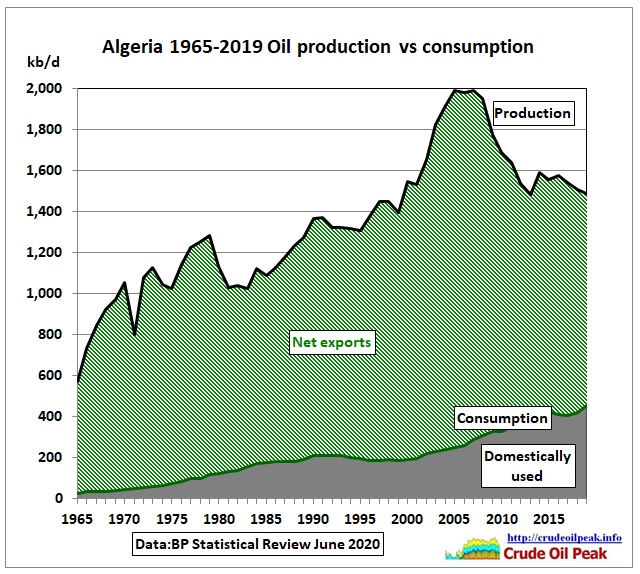 Fig 14: Algeria (population 43 million)
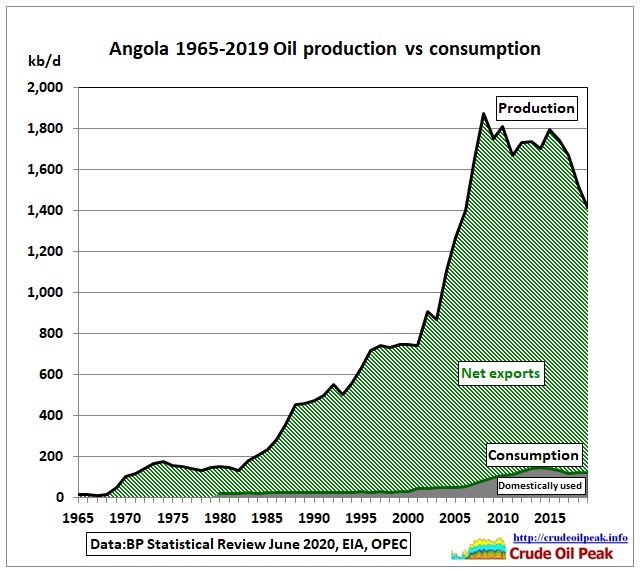 Fig 15: Angola’s consumption data are from the EIA and OPEC
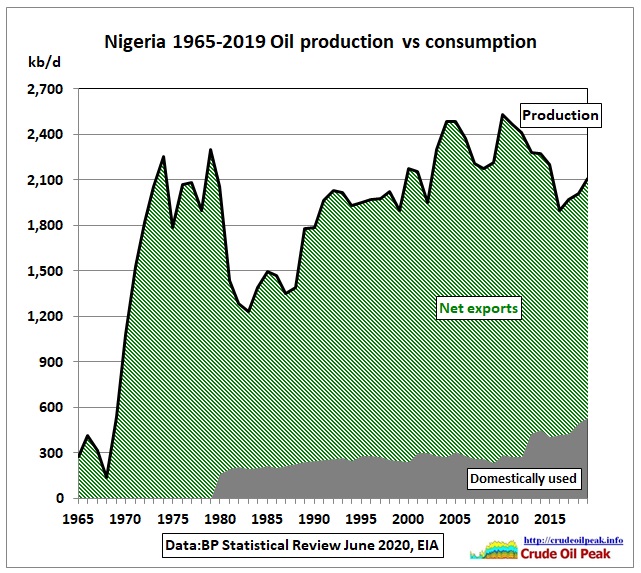 Fig 16: Nigeria’s consumption data are from the EIA
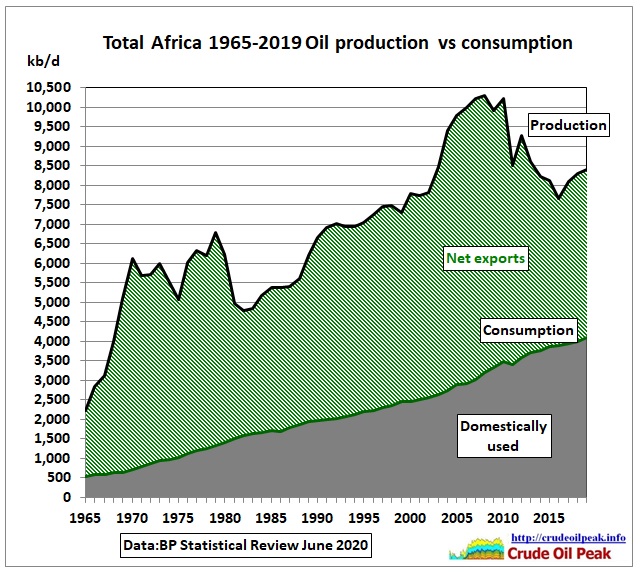 Fig 17: All African countries
Reserves
African oil reserves in the BP Statistical Review (supposed to be proven, i.e. 1 P) are so much exaggerated compared to Rystad’s that it is not helpful to prepare a graph with BP’s oil reserve history.
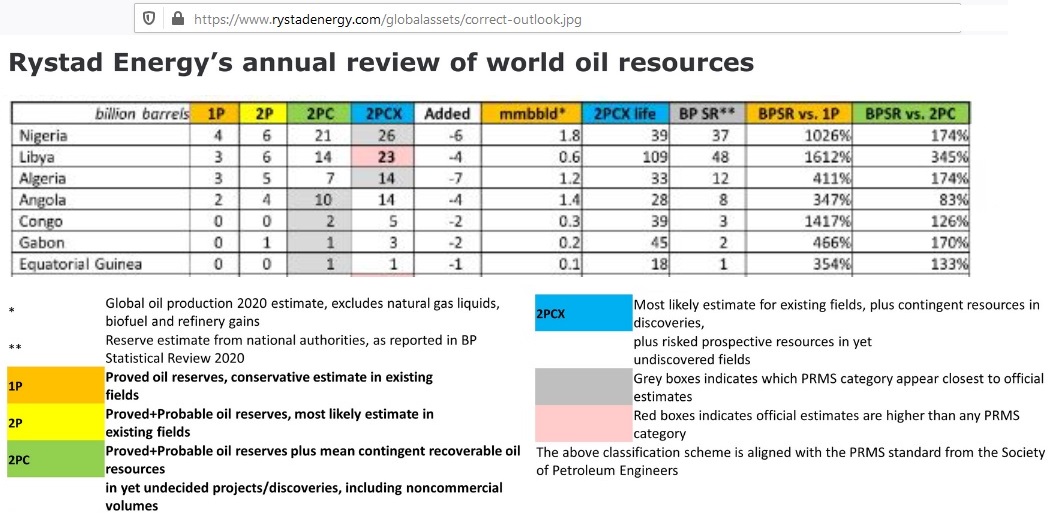 Fig 18: Rystad’s oil reserves and resources for selected African producers
https://www.hellenicshippingnews.com/rystad-energys-annual-review-of-world-oil-resources-recoverable-oil-loses-282-billion-barrels-as-covid-19-hastens-peak-oil/amp/
The reserve to production ratio for 2P (the safest assumption) is 11 years, for 2PC it’s 28 years.
Oil exports and imports
So what does it all mean for the world oil markets? Africa’s oil exports are important. We use BP’s inter-area and trade movements data.
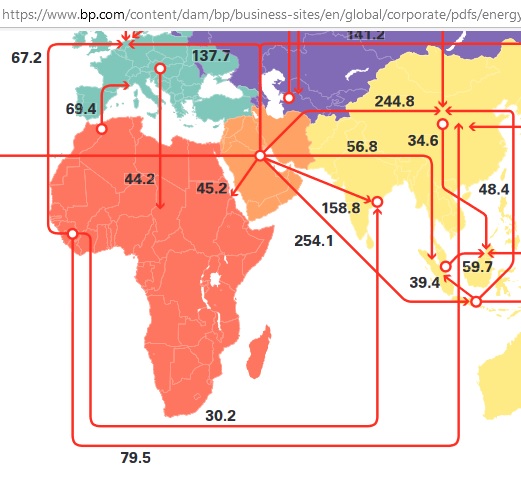 Fig 19: Excerpt from the map “Major trade movements 2019” (p 31)
https://www.bp.com/content/dam/bp/business-sites/en/global/corporate/pdfs/energy-economics/statistical-review/bp-stats-review-2020-full-report.pdf
Africa’s crude exports share is around 14% of global trade. Product imports come from Europe and the Middle East
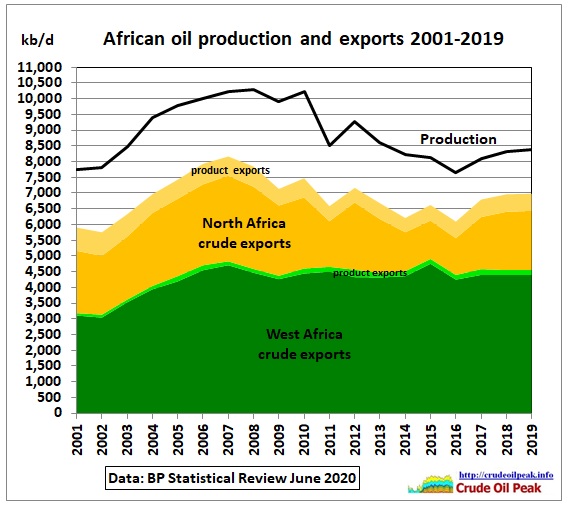 Fig 20: Crude and product exports from North and West Africa vs production
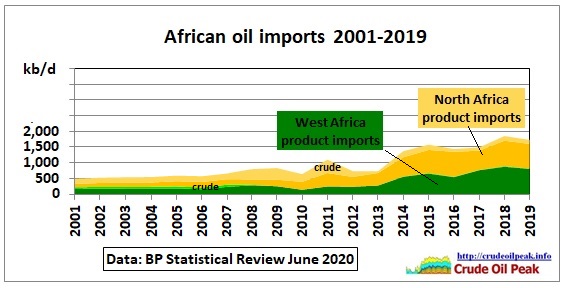 Fig 21: African oil imports are mainly products
Fig 20 and 21 use data from the time series sheet “Oil trade movements”. More detailed data are available since 2001 from the “oil – trade” sheets:
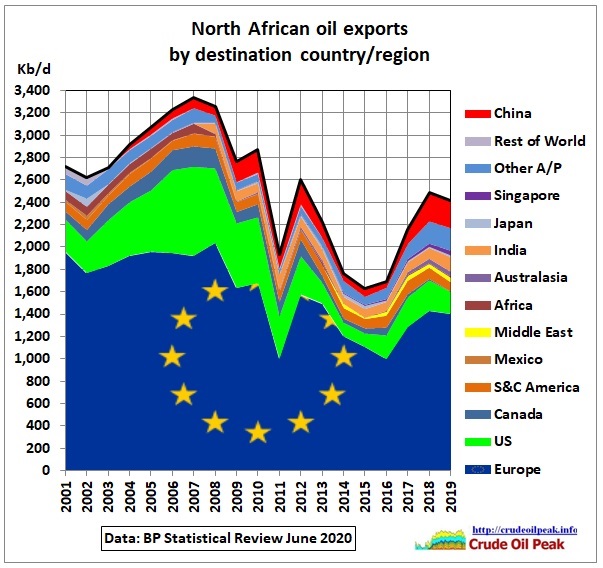 Fig 22: North African oil exports
Europe is the main destination of North African oil. The dip in 2011, the year of the Libyan revolution, can be clearly seen. Exports to the US declined because of US tight oil production increasing. Algeria’s Saharan blend has a gravity of 46, similar to US tight oil. China and Asia-Pacific took the US share.
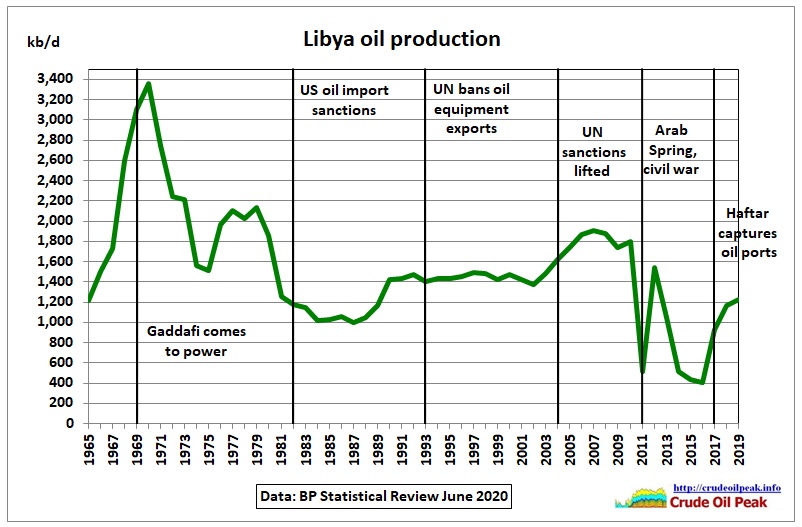 Fig 23: Libyan oil production history
However, Libya’s production recovery is fragile:
Neglected infrastructure forces Libya to reduce oil output
17/1/2021
(Bloomberg) – Libya’s oil output has dropped by about 200,000 barrels a day after the closure of a leaking pipeline, underscoring how difficult it is for the country to maintain its production following almost a decade of civil war.
https://www.worldoil.com/news/2021/1/15/neglected-infrastructure-forces-libya-to-reduce-oil-output
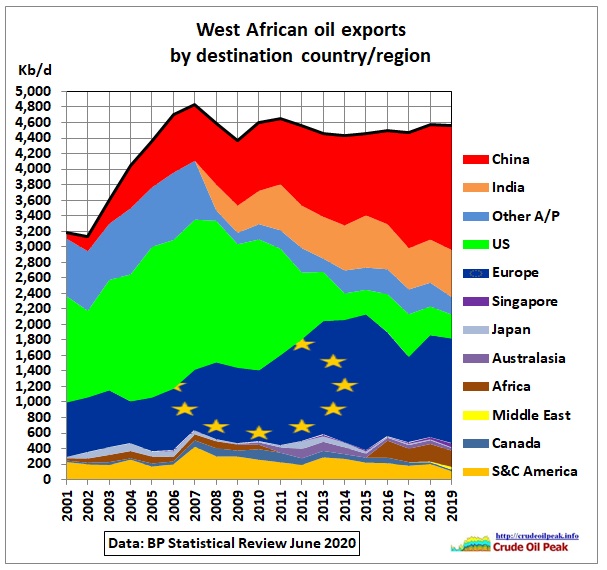 Fig 24: West African oil exports on bumpy plateau
West African exports to the US peaked in 2005-07 when the US recession started. Further declines happened for tight oil reasons as mentioned above. Europe took 400 kb/d of the US share until 2015 while exports to China increased steadily. Exports to India remained steady.
Conclusion
As West African exports did not increase for 10 years we have a zero-sum game, mainly between Europe and China. North African exports will mainly depend what happens in Libya. Due to its geographical proximity Europe has advantages, but Asia has started to make inroads.
Addendum
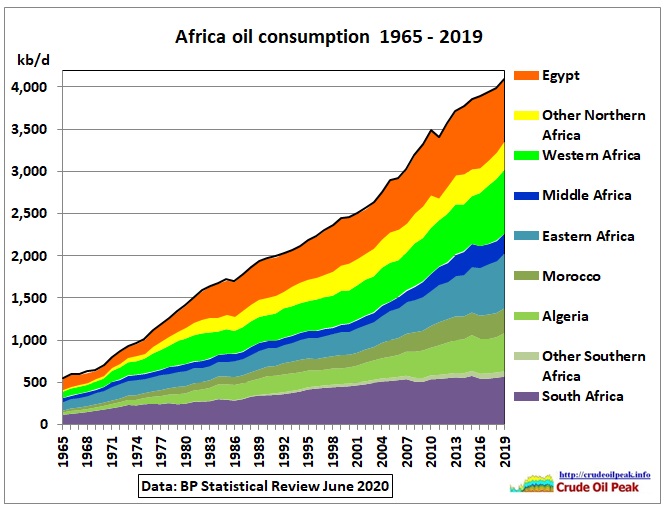 Fig 25: African oil consumption
Related post:
19/1/2021
Peak oil in Africa (part 1): OPEC quotas Jan 2021
https://crudeoilpeak.info/peak-oil-in-africa-part1-opec-quotas-jan-2021