In part 1 we had a summary table comparing Rystad’s 1P (proven reserves), 2P (proven + probable reserves) and 2PC (2P reserves + mean contingent) for all countries outside the Middle East. Here are country/regional details:
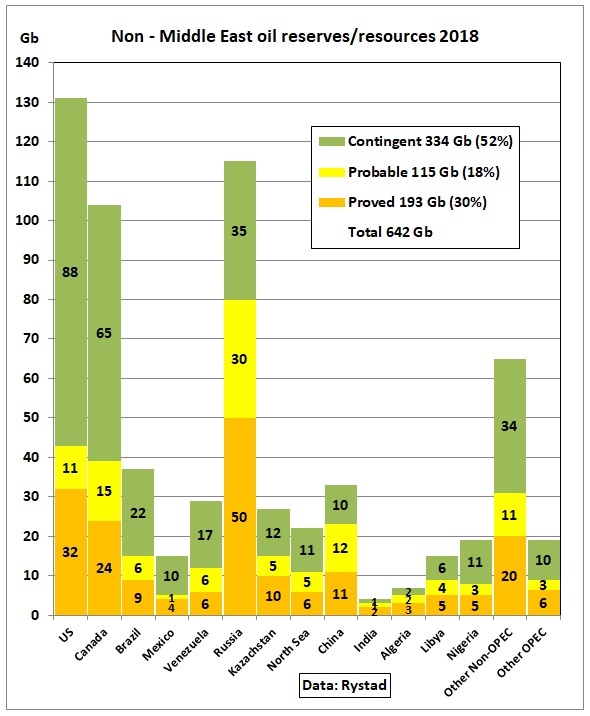
Fig 1: Countries/regions and their reserve types
According to Rystad proved and probable reserves (2P) are only 305 Gb or around half of the total of 624 Gb (Non – Middle East) with the other half being recoverable resources (not reserves) in yet undecided projects/discoveries including non-commercial volumes.
The largest proved reserves are in Russia followed by the US, Canada and China.
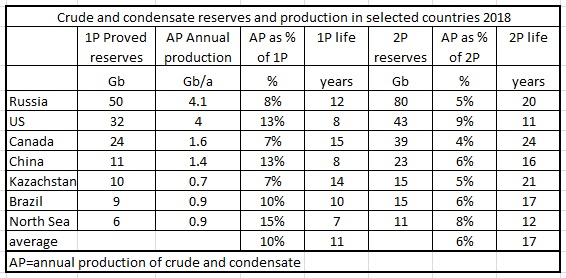
Fig 2: Annual production rates and reserve lives of 7 selected countries
1P proved reserves are produced at an annual rate ranging from 7% to 15% with an average of 10%, giving a short life of 11 years at this rate. 2P proved and probable reserves are produced at an average rate of 6% pa with an average life of 17 years. This does not mean production will end in 17 years. Rather, production will decline and last longer. Moreover, contingent resources can be proved up PROVIDED HOWEVER that oil prices are high enough and funds can be raised for the necessary CAPEX. If there is a credit crunch at a particular time that will be difficult. See this post:
19/8/2016 Oil reserves and resources as function of oil price
http://crudeoilpeak.info/oil-reserves-and-resources-as-function-of-oil-price
Rystad: Oil and gas resource replacement ratio lowest in decades
The so-called resource replacement ratio for conventional resources now stands around 16%, which is the lowest seen in recent history.
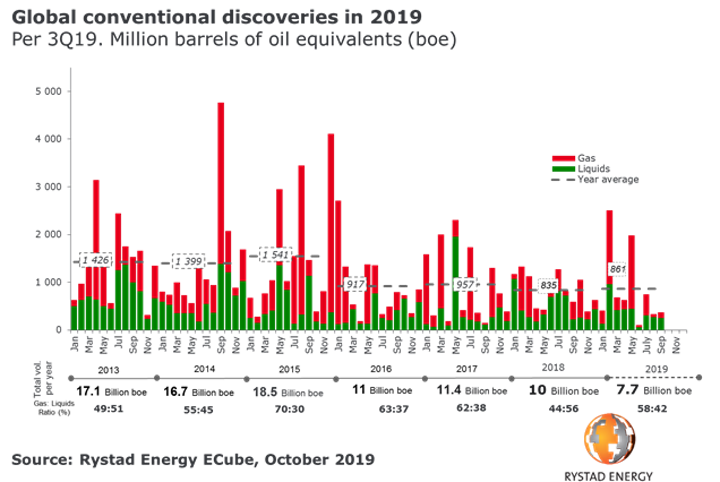
Fig 3: Global oil and gas discoveries 2013-2019
Let’s have a closer look at the differences between Rystad and BP Stat. Review:
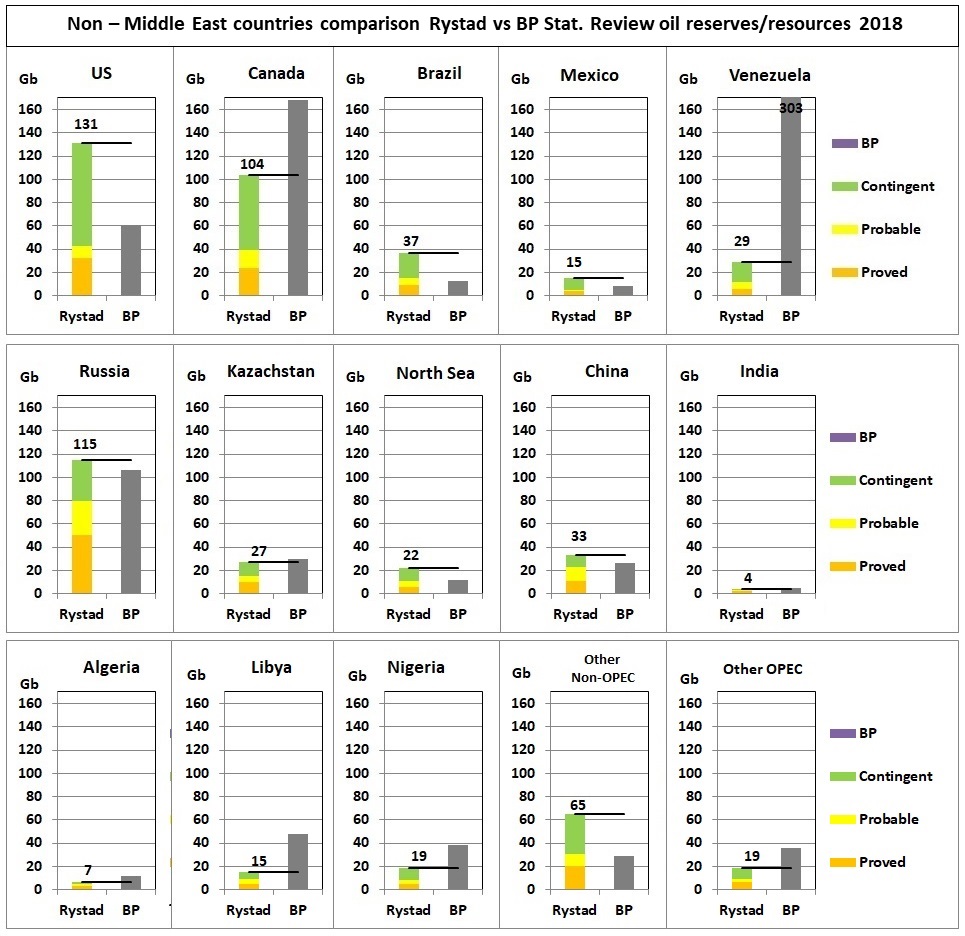
Fig 4: Comparison between Rystad’s reserves/resources and the BP Stat. Review
The horizontal lines denote 2P reserves plus contingent resources.
Rystad’s 2P reserves for the US are lower by 19 Gb because the BP Stat Review contains NGLs. Half of the US crude reserves are from shale oil, an extra light oil (API > 40) which cannot replace Arab Light (API 34) for example.
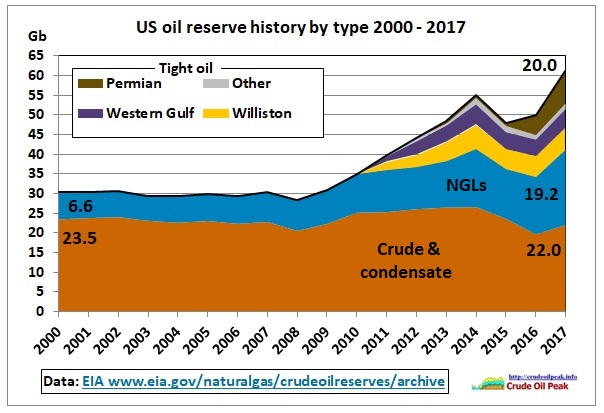
Fig 4: US proved reserves by type
For Canada, the BP Stat Review has included all tar sands resources, an untested assumption. The same applies to Venezuela’s extra heavy oil. For Russia and Kazakhstan, BP reserves reach into contingent resources. In Nigeria, Libya BP and other OPEC outside the Middle East the Stat Review reserves are 2-3 times higher than Rystad’s 2PC numbers.
Now, let’s look how world oil consumption compares to production without the Middle East.
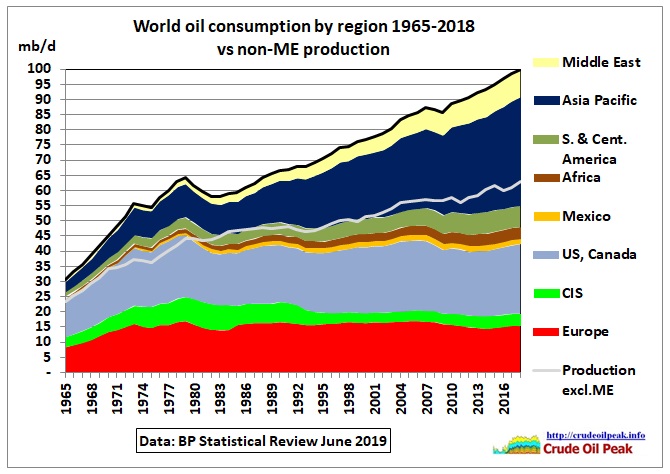
Fig 5: Oil consumption vs non-ME production
Let’s compare the non-ME oil production curve (63 mb/d in 2018, grey) with consumption outside the Middle East which was 90.7 mb/d or 27.7 mb/d higher. This means consumption would have to be reduced by 30% to match production. The last years when consumption was that low were 1990 (Desert Storm) and 1979 (2nd oil crisis) when the Mullahs came to power.
How will an oil crunch impact on the various continents/regions?
North America
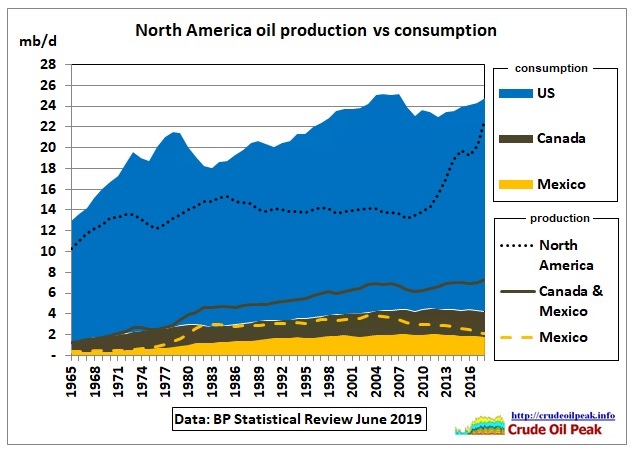
Fig 6: North America: both consumption (areas) and production (lines) are stacked
In Mexico, production is marginally higher than consumption. Contrary to media reports the US is not self-sufficient (deficit 5.1 mb/d) but together with Canada – both countries form a common oil production system – the deficit for the whole of North America is reduced to around 2.1 mb/d.
South & Central America
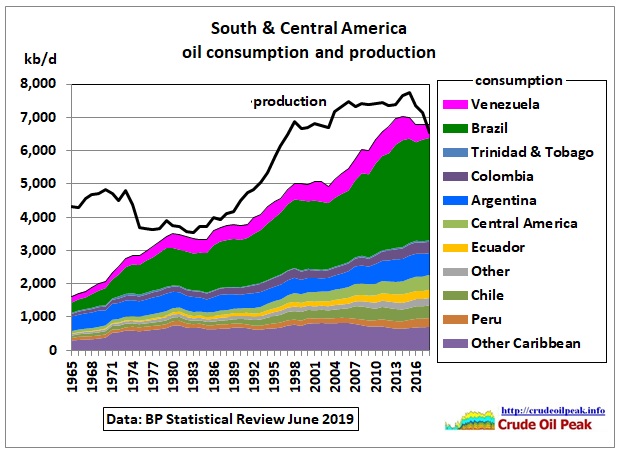
Fig 7: South and Central American oil consumption and production
Due to the sharp drop in Venezuelan production, S&C American consumption was 300 kb/d higher than production.
Europe
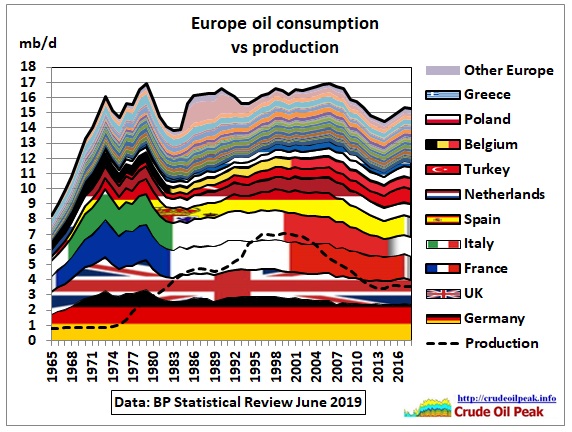
Fig 8: Europe was always a net oil importer, stacked by consumption level in 2018
Note that oil consumption is now lower than in 1973 (Yom Kippur war, OPEC embargo) and 1979 (Iran revolution after peak oil in Iran under the Shah). More recently, dramatic events like the oil price shock in 2008 and the financial crisis in 2009 brought consumption down. Quantitative easing caused a rebound.
Asia
The largest gap between production and consumption is in Asia.
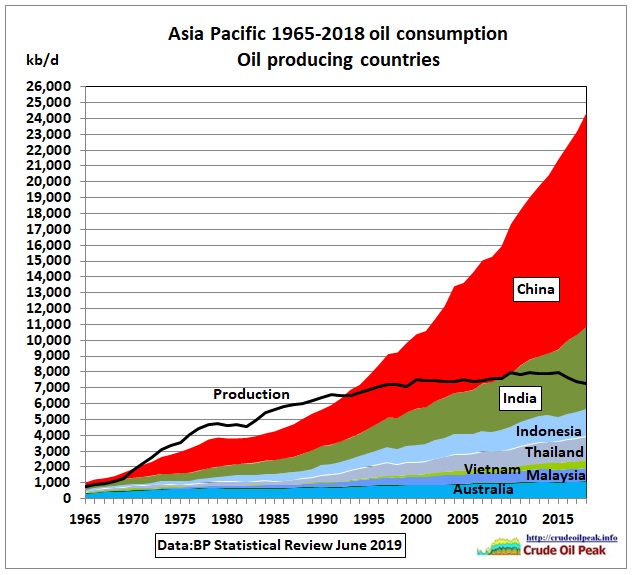
Fig 9a: Asia consumption vs production
The peak in production was caused by peak oil in China 2015. Asia has now a pre-existing peak oil condition which will become apparent when there are oil import problems.
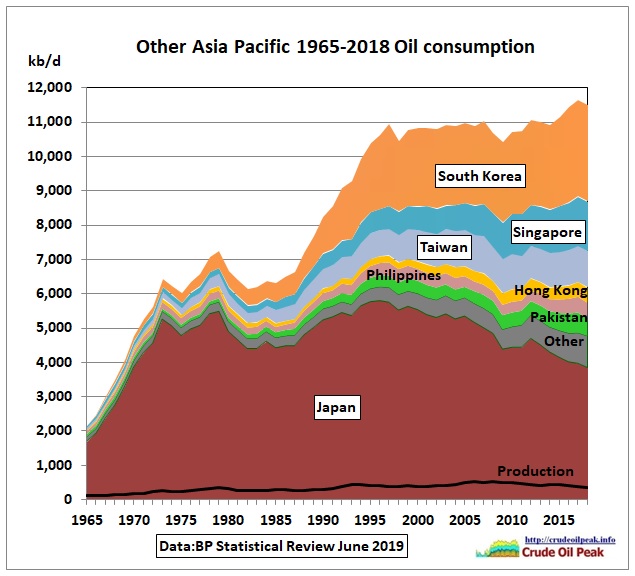
Fig 9b: Asian countries with no or very little production
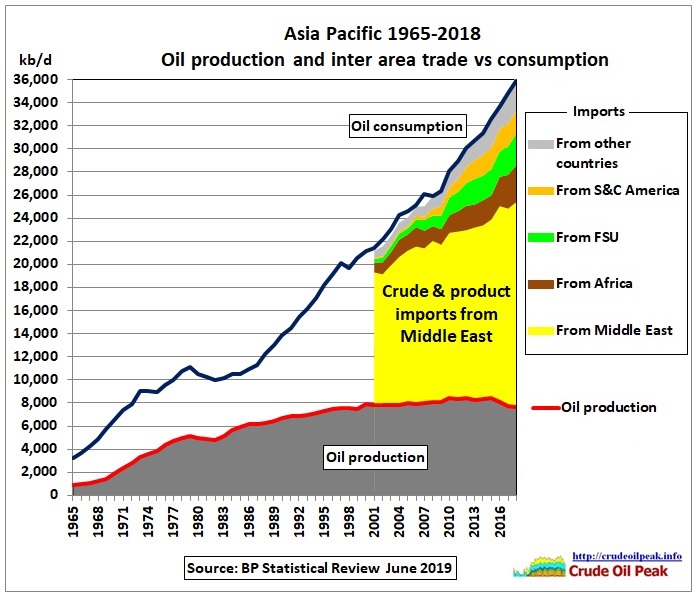
Fig 10: Asia’s dependency on oil imports from the Middle East
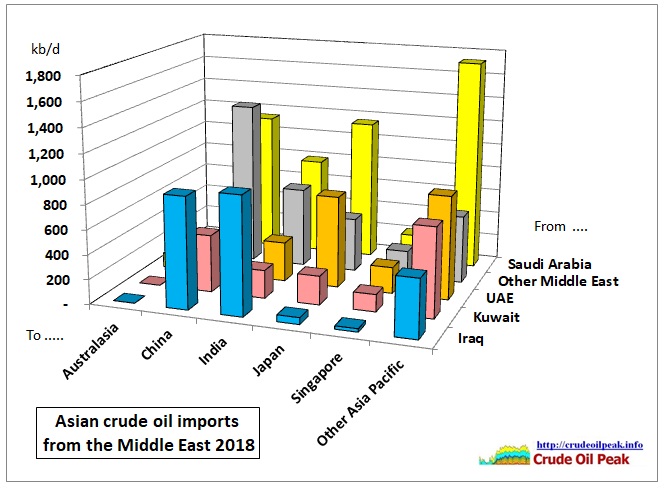
Fig 11: Asian crude imports by source and destination country
The BP Stat Review has no separate data for Iran which is contained in “Other Middle East”.
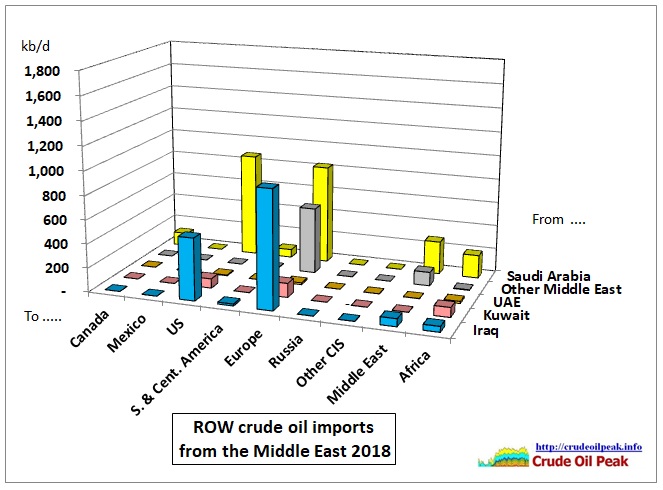
Fig 12: Rest of World (ROW) crude imports from the Middle East
Africa
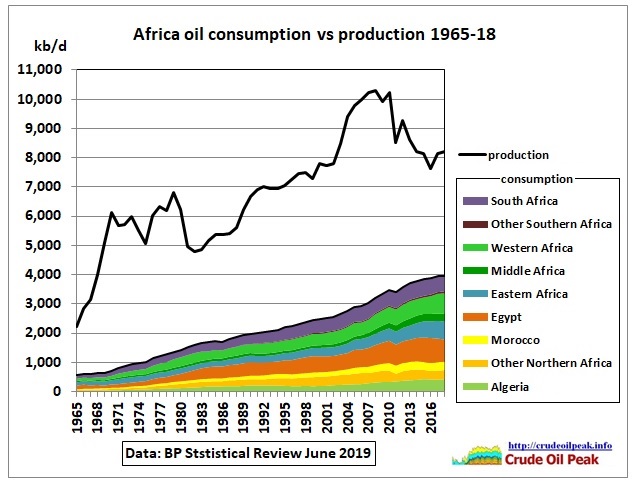
Fig 13: Africa oil production and consumption
Africa is a net oil exporter but the problem is that refining throughput is only 2 mb/d (while refining capacity is 3.4 mb/d)
The new dependency is Russia as main exporter.
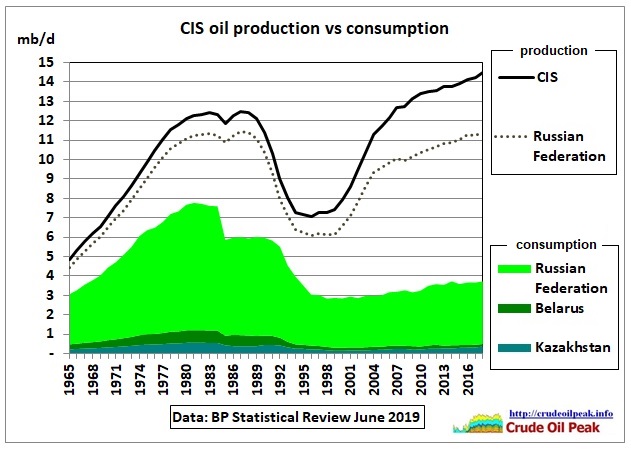
Fig 14: Consumption dropped when West Siberia peaked
Note the Soviet Union collapsed as a result of a combined oil and energy crisis (Chernobyl nuclear accident 1986).
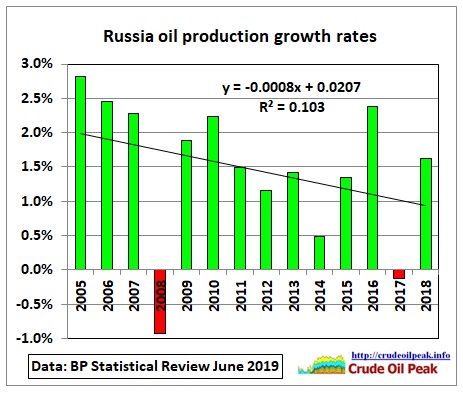
Fig 15: Russia’s growth rates have come down
Conclusion:
If there is an armed conflict around the Persian Gulf, this will immediately spill over into Asia. China is well prepared with its militarization of the South China Sea to secure oil import routes east of Singapore.
Related link:
12/8/2012
BP Statistical Review 2012 (part 3): the incredible growth of oil(y) resources
http://crudeoilpeak.info/bp-statistical-review-2012-the-incredible-growth-of-oily-resources