Part 1
Diesel stock drops to 31 days consumption cover, well below the 39 days achieved in June/July
In the weekly fuel security update the Minister for the Environment claimed current diesel stocks of 31 days as “within normal levels” while this is around 8 days lower than earlier in the year. Let’s delve into the details and show the data in graphs.
As Energy Minister Bowen left Australia to attend the COP31 negotiations in Antalya, Turkey
it was the Minister for the Environment and Water, Senator Murray Watt, who did the weekly fuel security update
Press conference, Brisbane
7 November 2026
MURRAY WATT, MINISTER FOR THE ENVIRONMENT AND WATER: OK well thanks very much for coming along today. Today, I’d like to just provide the weekly fuel update, and the situation continues to show that Australia’s fuel supplies remain strong, despite a lot of international uncertainty that continues.
Currently, we have 41 days’ worth of petrol, which is the same as last week. We have 31 days’ worth of diesel, which is three days less than last week, but within normal levels, and the same as two weeks ago. We have 28 days’ worth of jet fuel, which is one day less than last week…..
https://minister.dcceew.gov.au/watt/transcripts/press-conference-brisbane-2
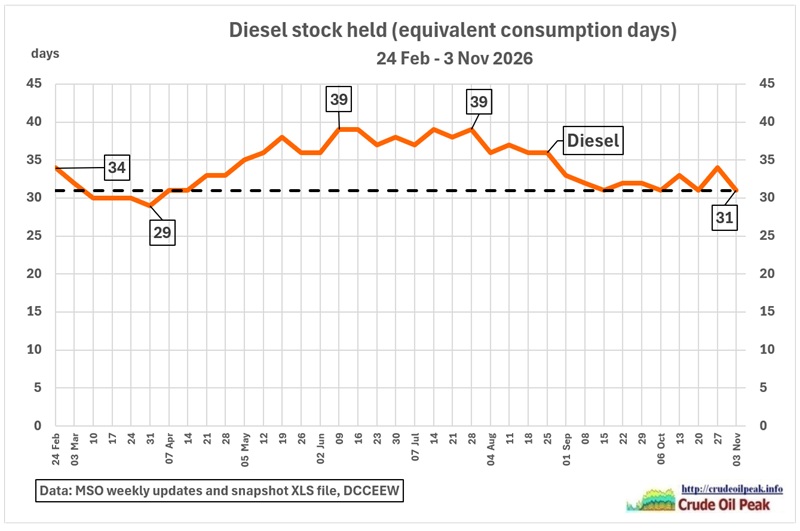
Fig 1: Diesel stock held 24 Feb – 3 Nov 2026
Data are taken from the file mso-weekly-snapshot-timeseries.xls
https://www.dcceew.gov.au/sites/default/files/documents/mso-weekly-snapshot-timeseries.xlsx
We can see:
A diesel stock level of 31 days
• occurred 4 times since 15 Sep. so it is not a statistical aberration
• is 6-8 days lower than the maximum levels achieved in June and July (37-39 days)
• is lower than the stock before the Iran war started (34 days)
• and just 2 days higher than the minimum of 29 days on 31 March
All the while the Minister tells the public that this is normal.
It is also important to look at stock above the MSO:
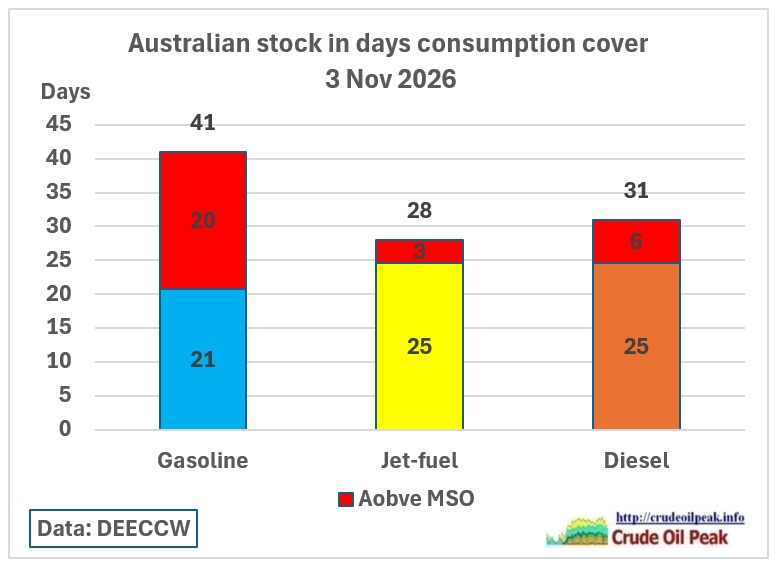 Fig 2: Fuel stock above MSO level is coloured red
Diesel is down to just 6 days. Jet fuel improved slightly compared to the previous week.
For readers who prefer stock data in ML
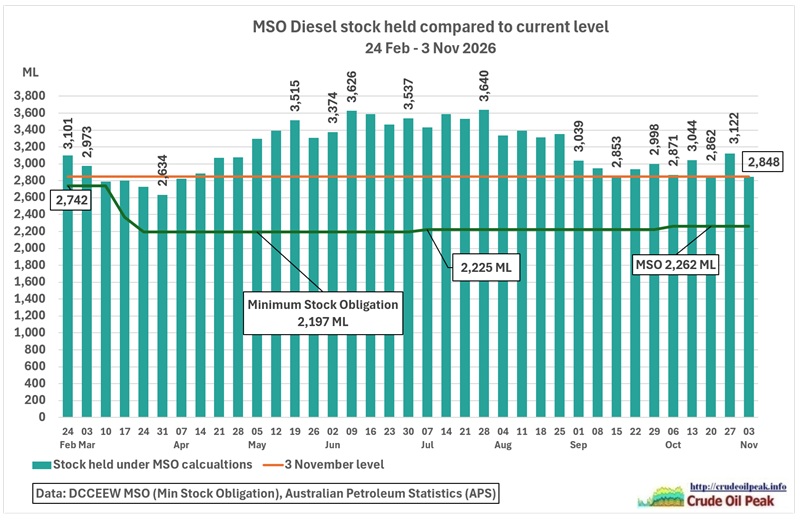 Fig 3: Diesel stock held vs current stock level and MSO
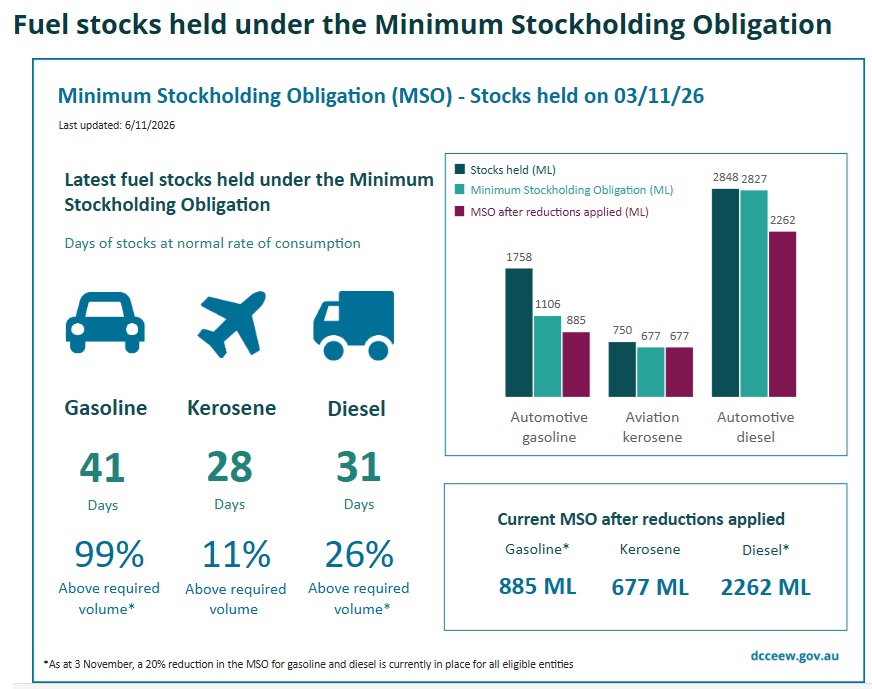
We observe diesel stock of 2,848 ML on 3 Nov 26
• is in the lowest quartile of records since 24 February 26
• to be precise is the sixth-lowest weekly record
• is just 106 ML above the former MSO threshold of 2,742 ML
• is 700 ML lower than the average level seen between June 9th and July 28th
Now let’s look at the usual graph provided on this website on a weekly basis which includes APS data and an estimated onshore/offshore line.
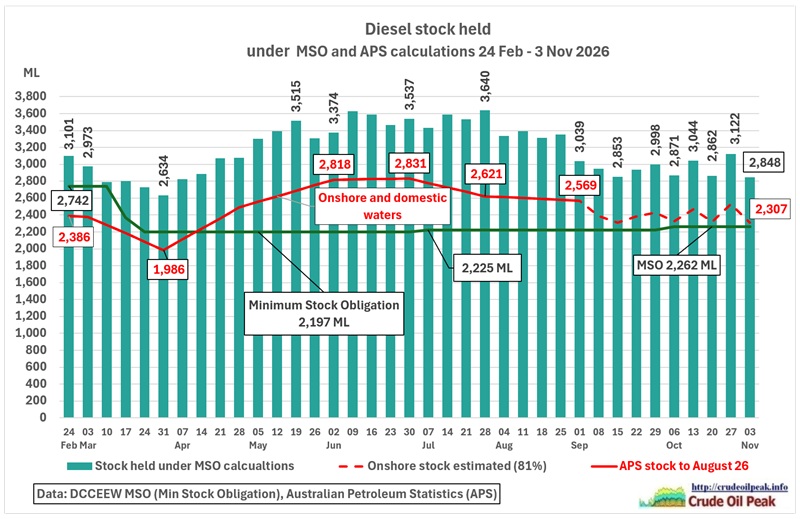 Fig 4: Diesel stock held, APS stock and estimated offshore/onshore
The onshore/offshore ratio (dashed red line) is estimated using the stock data form the Australian Petroleum Statistics (red line) which counts stock only onshore and in coastal waters.
We see that diesel stock onshore is hardly above MSO
Now let’s look at jet-fuel:
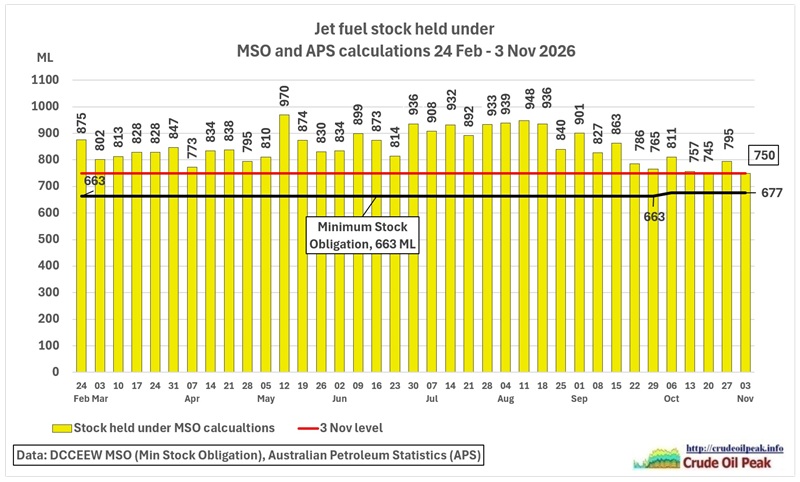
Fig 5: Jet fuel stock held vs current stock level and MSO
Current stock is lower than end February and in March.
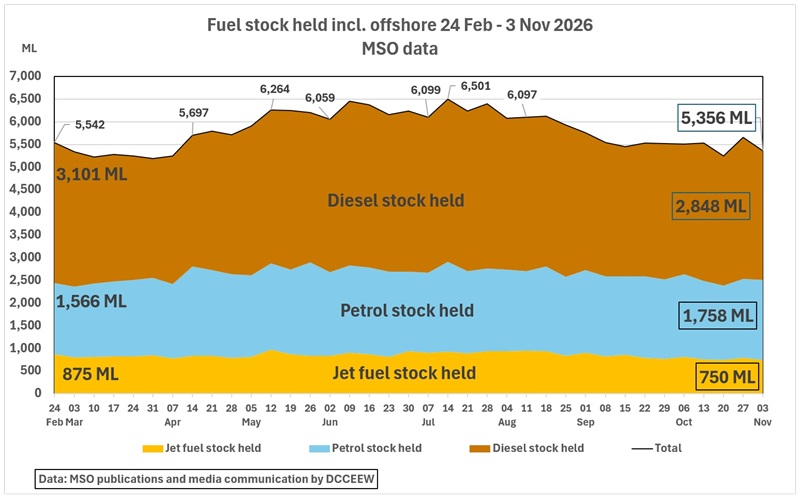 Fig 6: Stock held of all 3 fuels
Current stock level of all 3 fuels is lower than end February. Apparently, we are back to square 1.
Part 2
Fuel volumes locked in for delivery fall to lowest level since mid August
MURRAY WATT, MINISTER FOR THE ENVIRONMENT AND WATER: …..48 ships are currently on the way to Australia with fuel, and that’s five more than this time last week. And 2.8 billion litres worth of fuel is locked in to be delivered over the next four weeks. That includes 1.5 billion litres of diesel. 95 ships arrived in October, which is the equal highest for the year, and 18 have already arrived in November.
https://minister.dcceew.gov.au/watt/transcripts/press-conference-brisbane-2
The last time we had a detailed breakdown of “fuels” (which includes crude oil for refineries) was on 20 June 26:
PRIME MINISTER: ”we have 3.9 billion litres of fuel contracted, locked in, to be delivered over the next four weeks. That’s around 400 million litres more than my report last Saturday. It consists of 1.9 billion litres worth of diesel, 586 million litres worth of petroleum, 423 million litres worth of jet fuel and 948 million litres of crude oil.”
https://www.pm.gov.au/media/press-conference-sydney-36
(The 400 million litres included the extra orders supported by EFA which then ended)
Now the total volume of fuel expected is only 2,800 ML which includes 1,500 ML of diesel. So it gets very interesting how to estimate the other fuels.
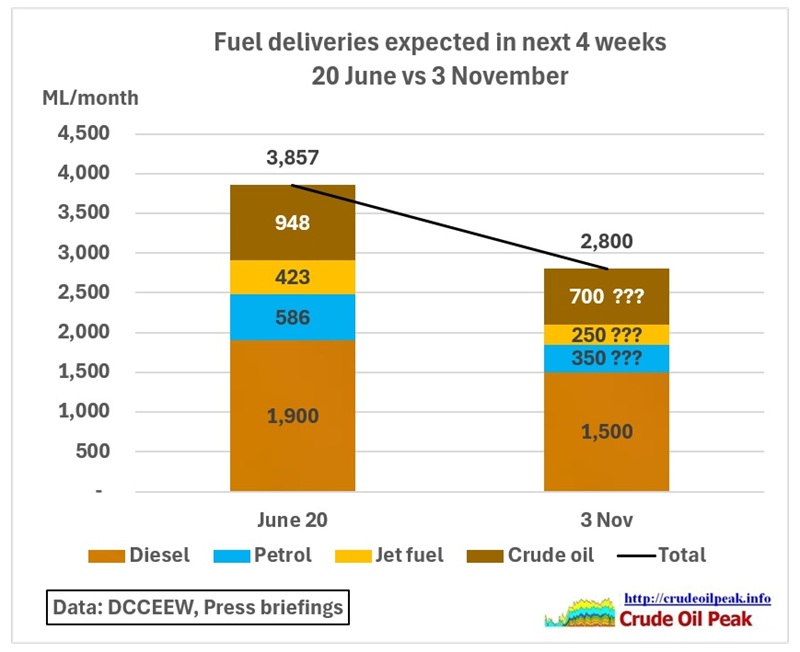 Fig 7: Fill in the question marks
Let’s do a back-of-the-envelope estimate. We need to fill the gap 2,800 ML all fuels – 1,500 ML diesel = 1,300 ML. That will be tight.
According to Australian Petroleum Statistics:
refinery inputs declined 15% from June to August so the 948 ML would be down to 800 ML for the weekly delivery
petrol consumption is pretty level at 1,200 ML per month. Deduct local refinery production of 340 ML = 860 ML per month
jet fuel August consumption was 780 ML minus refinery production 90 ML = 690 ML per month
Let us assume tankers take on average 15 days so we divide the monthly petrol and jet fuel numbers by 2 and get for a forward order balance of:
2,800 ML total
-430 ML petrol
-345 ML jet fuel
-800 ML crude oil
-1,500 ML diesel
-275 ML difference
We adjust to 700 ML crude, 350 ML petrol and 250 ML jet fuel (see above Fig 7)
All this guess work is needed because of the Government’s failure to publish a breakdown.
Let’s put that into the timeline graph:
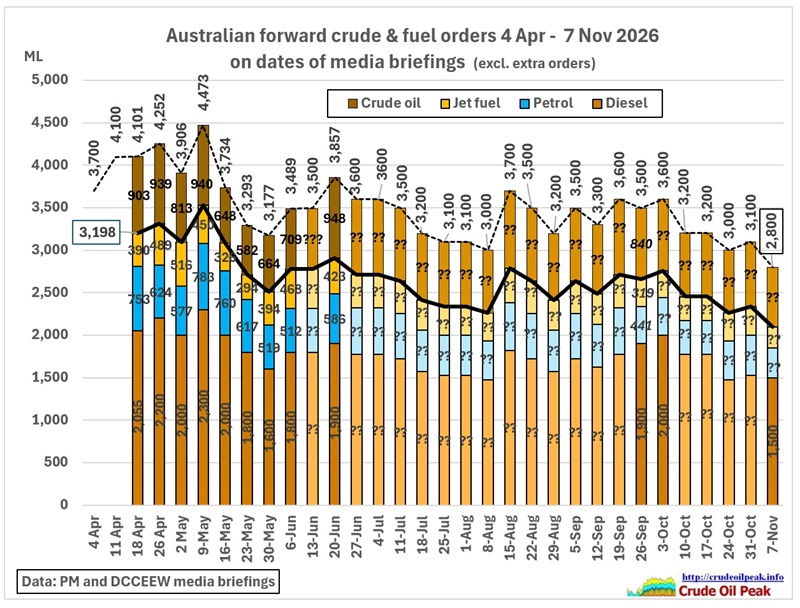 Fig 8: Expected fuel deliveries in next 4 weeks (forward orders) by fuel
Clearly, forward orders are on a downward trend since mid August.
Part 3
Tanker numbers on the way up, but volumes down
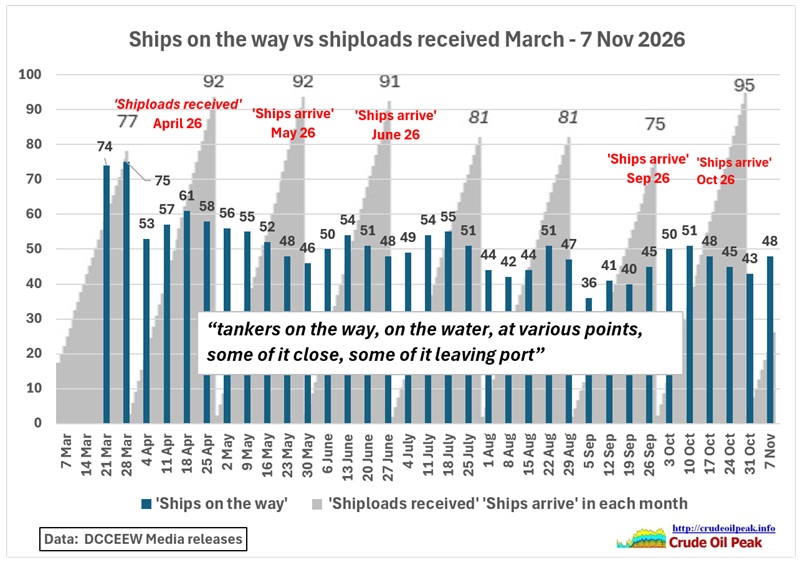 Fig 9: Ships on the way vs ships arrived
In September the average number of ships announced in each week was 40.5. The transit time would have been 40.5*30/75= 16.2 days. In October, it was 48.5*31/95=15.8 days. Both numbers are reasonable for most of the tankers coming from South Korea, Singapore and other countries in the region.
Let’s compare the tankers on the way with volumes of fuels expected at the time.
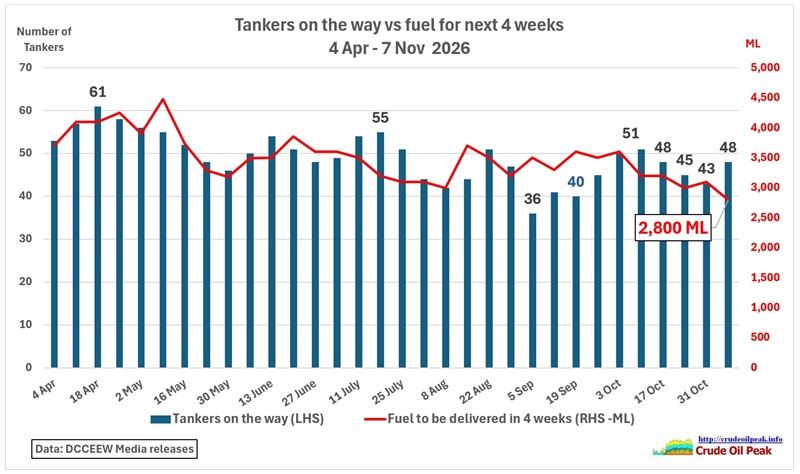 Fig 10: Tankers on the way vs fuel expected in next 4 weeks
Over the whole period starting in 4 April, there is a downward trend, both in tanker numbers and volumes.
The Pearson correlation coefficient between these 2 data series r≈0.80, meaning:
When the number of tankers increases, the reported volume of fuel expected generally increases.
When tanker numbers fall, fuel volumes generally fall.
However, the relationship is not perfect. For example, the current number of tankers on the way (48) increased from the previous week (43) increased while the volume expected decreased from 3,100 ML to 2,800 ML. This means the volume carried by tanker has gone down from 72 ML/tanker in the previous week to 58 ML/tanker.
The coefficient of determination is R^2=r^2≈0.64
So roughly 64% of the variation in expected fuel volume is explained by the variation in tanker numbers.
The remaining 36% is likely explained by factors such as:
- MR vs LR1 vs LR2 vessel mix
Partial cargoes
Multiple-product cargoes
Voyage timing
Different product densities
Cargoes intended for multiple ports
Tankers on the way is a snapshot, while fuel volumes expected is a flow variable over time. We do not know all the details to assess this.
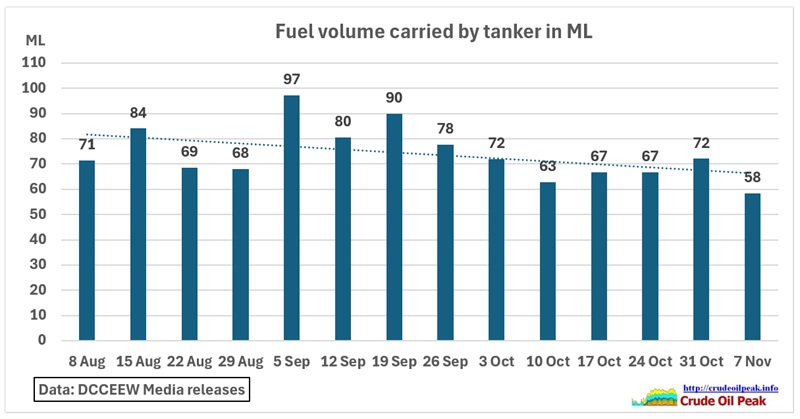 Fig 11: Fuel volume carried by tanker
There is a general declining trend.
Conclusion:
While some numbers presented in the press conference look positive a more detailed timeline analysis revealed the real problems of the fuel supply situation
Appendix
Confused what is happening in the Strait of Hormuz? Watch this video from US shipping expert Sal Mercogliano:
What The Hormuz: High Risk, High Reward & the Strait of Hormuz Clause
⚓️The Baltic Exchange dispute: Why Mercuria challenged the TD3C index rate and how market disruptions exposed vulnerabilities in benchmark pricing.
⚓️The “Strait of Hormuz” clause: How safety concerns led shipowners and masters to demand refusal rights, complicating fixtures for major buyers like Unipec.
⚓️Creative charter contracts: How decreasing demurrage structures prevented idle tankers from turning into financially ruinous floating storage.
⚓️Sinokor’s market gamble: How South Korea’s Sinokor positioned its VLCC fleet to dominate Persian Gulf crude movements despite rising threats.
⚓️ADNOC’s shuttle solution: How ship-to-ship transfers off Fujairah and the Gulf of Oman provided a critical workaround to keep crude moving without risking supertankers inside the strait.
⚓️US escort discussions & market reality: The limits of diplomatic memorandums and military transit support as renewed threats quickly shook commercial confidence.