2014
Antarctica could raise sea level faster than previously thought
14/8/2014
https://www.pik-potsdam.de/news/press-releases/antarctica-could-raise-sea-level-faster-than-previously-thought
Projecting Antarctic ice discharge using response
functions from SeaRISE ice-sheet models
14/8/2014
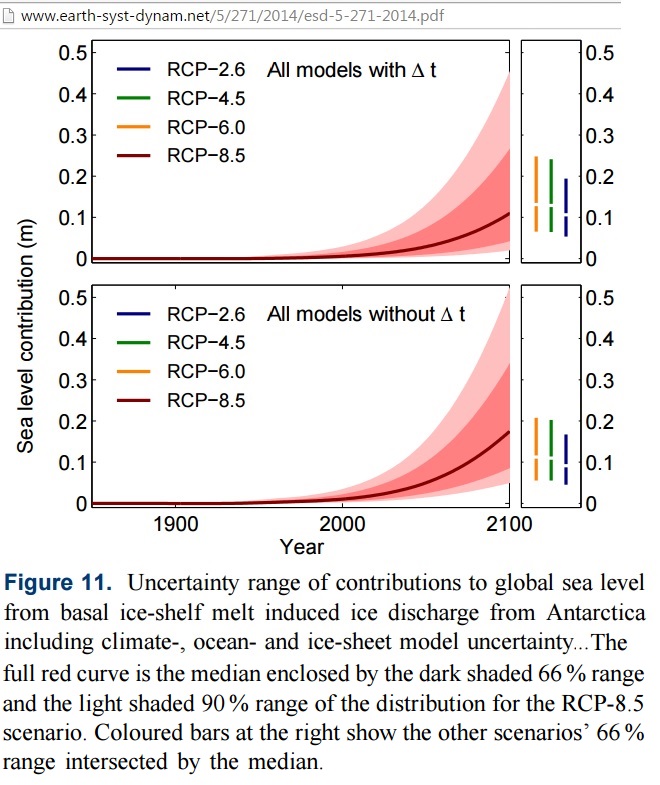
http://www.earth-syst-dynam.net/5/271/2014/esd-5-271-2014.pdf
2013
12/8/2013
The inevitability of sea level rises
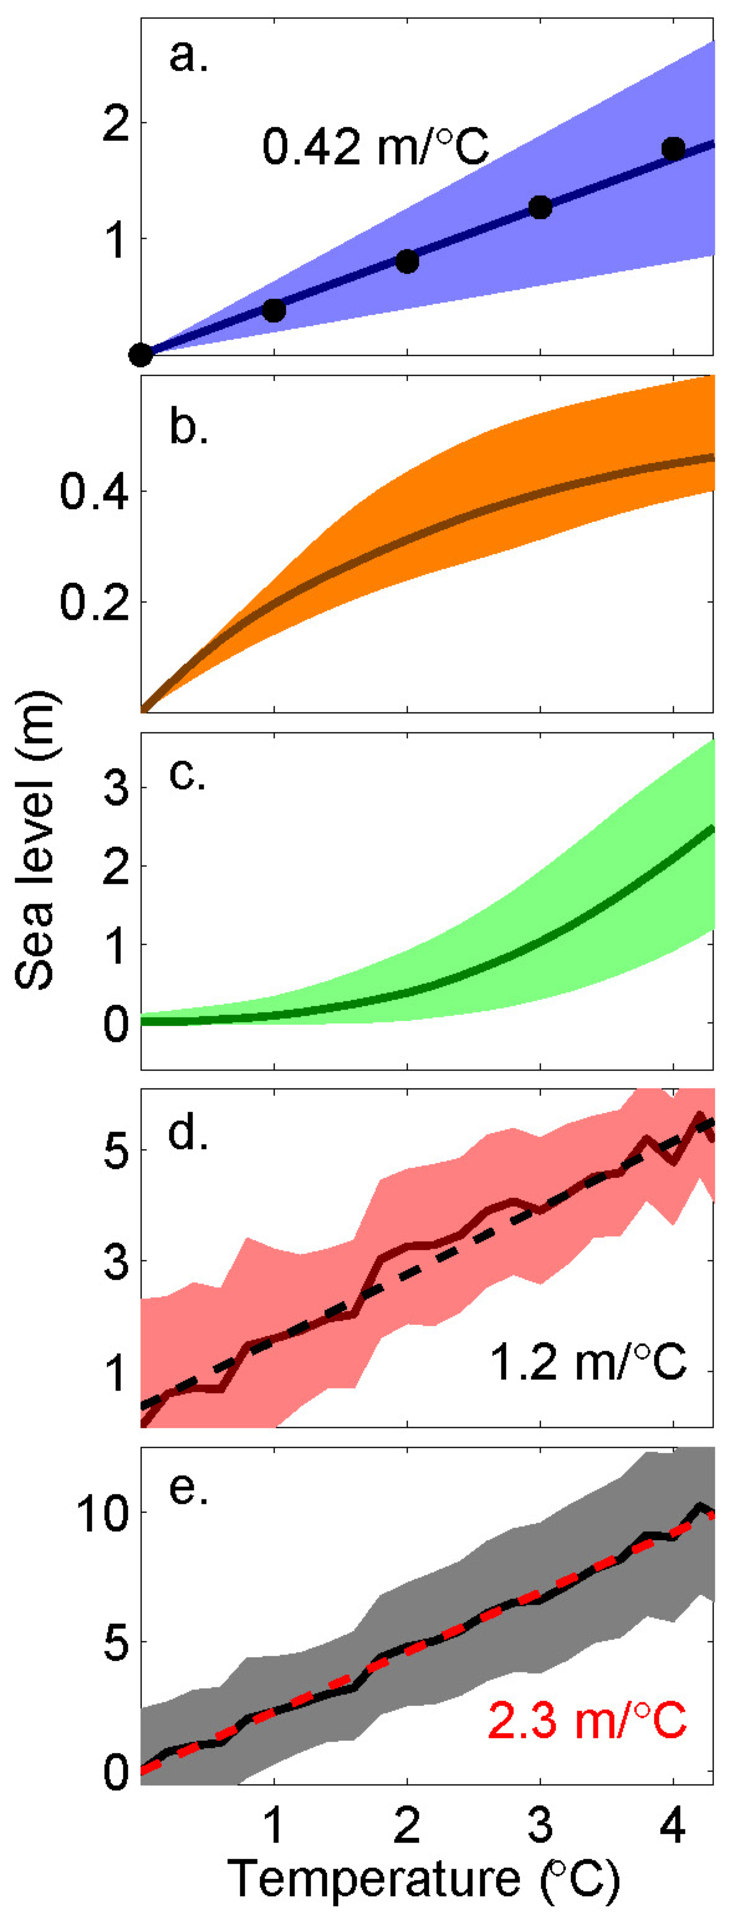
What we found was that for each degree of global warming above pre-industrial levels the ocean warming will contribute about 0.4 metres to global mean sea-level rise while Antarctica will contribute about 1.2 metres. The mountain glaciers have a limited amount of water stored and thus their contribution levels off with higher temperatures. This is over-compensated for by the ice loss from Greenland, so that in total sea level rises quasi-linearly by about 2.3 metres for each degree of global warming
http://theconversation.com/the-inevitability-of-sea-level-rise-16871
The multimillenial sea level commitment of global warming
20/8/2013
http://www.pik-potsdam.de/~anders/publications/levermann_clark13.pdf
29/7/2013
Simple analyses suggest that we have already committed to a long-term future sea level >1.3 or 1.9 m higher than today and are adding about 0.32 m/decade to the total: 10 times the rate of observed contemporary sea-level rise. By midcentury, the central estimate of commitment would rise to >3.1 m assuming today’s trends continue or to 2.1 m under an aggressive emissions cutting and atmospheric carbon dioxide removal scenario.
http://assets.climatecentral.org/pdfs/Strauss-PNAS-2013.pdf
2009
Potsdam Institute for Climate Impact Research
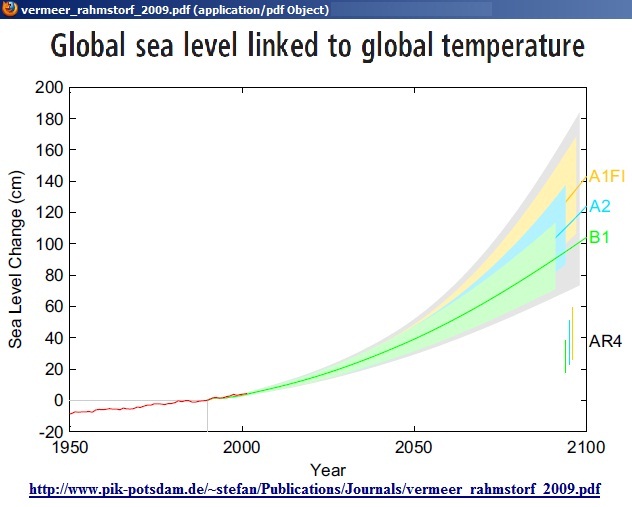 From Prof. Stefan Rahmstorf, PIK http://www.pik-potsdam.de/sealevel/
2008
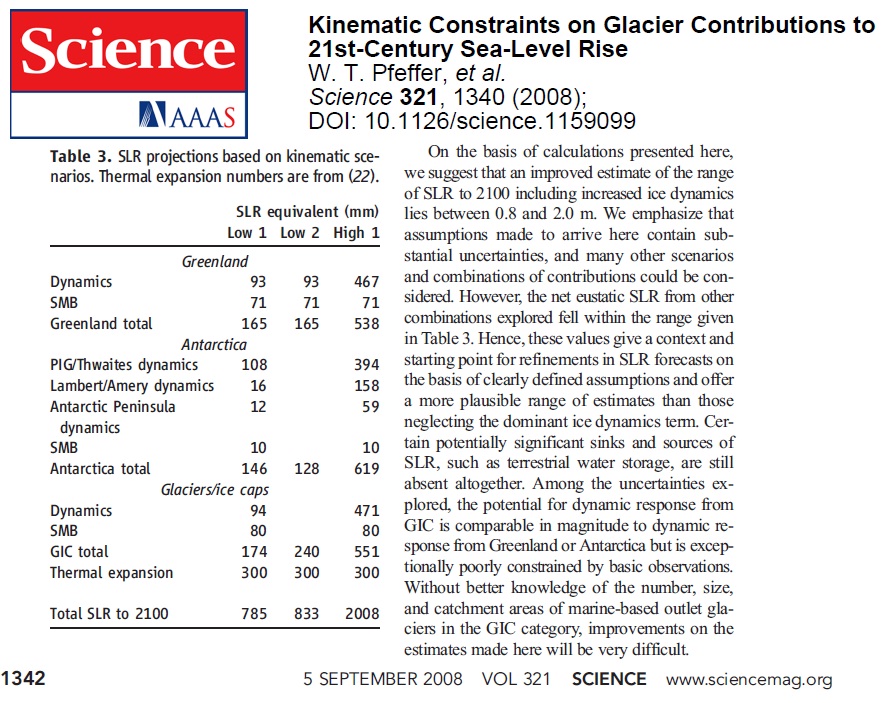 From Prof. Tad Pfeffer, INSTAAR http://instaar.colorado.edu/people/bios/pfeffer.html
2007
KERRY O’BRIEN: What are your particular fears with regard to the melting of the polar ice caps?
JAMES HANSEN: Well, the problem is that the climate system in general has a lot of inertia and that means that it takes time for the changes to begin to occur but then, once they do get under way, it becomes very difficult to stop them and that is true in spades for the ice sheets. If we once begin to disintegrate it will become very difficult, if not impossible, to stop them and we are beginning to see now on both Greenland and west Antarctica disintegration of those ice sheets. They’re both losing ice at a rate of about 150 cubic kilometres per year and that’s still not a huge sea level rise. Sea level rise is now going up about 3.5 centimetres per decade. So that’s more than double what it was 50 years ago. But it’s still not disastrous; it’s a problem, but it’s not disastrous. But the potential is for a much larger sea level rise. If we get warming of two or three degrees Celsius, then I would expect that both West Antarctica and parts of Greenland would end up in the ocean, and the last time we had an ice sheet disintegrate, sea level went up at a rate of 5 metres in a century, or one metre every 20 years. That is a real disaster, and that’s what we have to avoid.
KERRY O’BRIEN: What is the most recent evidence of what’s really going on with the ice caps, the Arctic and the Antarctic?
JAMES HANSEN: There are two things that are cause of concern. First of all, if we look at the history of the Earth, we know that at the warmest interglacial periods, which were probably less than 1 degree Celsius warmer than today, it was still basically the same planet. Sea level was perhaps a few metres higher. But if we go back to the time when the Earth was two or three degrees Celsius warmer, that’s about three million years ago, sea level was about 25 metres higher, so that tells us we had better keep additional warming less than about one degree. And the other piece of evidence is not from the history of the Earth but from looking at the ice sheets themselves, and what we see is that the disintegration of ice sheets is a wet process and it can proceed quite rapidly. We see that the ice streams have doubled in their speed on Greenland in the last few years and even more concern is west Antarctica because it’s now losing mass at about the same rate as Greenland, and west Antarctica, the ice sheet is sitting on rock that is below sea level. So it is potentially much more in danger of collapsing and so we have both the evidence on the ice sheets and from the history of the Earth and it tells us that we’re pretty close to a tipping point, so we’ve got to be very concerned about the ice sheets.
http://www.abc.net.au/7.30/content/2007/s1870955.htm
And this was under natural climate change, without CO2 impulse:
http://en.wikipedia.org/wiki/Meltwater_pulse_1A
2006
Hansen: “The effects of a rising sea level would not occur gradually, but rather they would be felt
mainly at the time of storms. Thus for practical purposes sea level rise being spread over one or
two centuries would be difficult to deal with. It would imply the likelihood of a need to
continually rebuild above a transient coastline.”
http://www.columbia.edu/~jeh1/2006/CaseForCalifornia_20060630.pdf