US shale oil has so far replaced 2 mb/d of its crude oil imports which peaked at around 10 mb/d in 2005. If this effort can be doubled the US would still need to import around 6 mb/d
US crude oil imports vs production

History: US crude imports skyrocketed in the early 1970s after the US peak. High oil prices as a result of the 1st and 2nd oil crises in 1973 and 1979 triggered a recession and therefore a drop in oil demand and a reduction in crude oil imports. After Alaska’s peak crude imports increased again until the 3rd oil crisis which started in 2005. Despite the shale oil boom which began in serious in 2011, the US still imports around 2 mb/d (25%) from the Persian Gulf and 3.5 mb/d (44%) from OPEC. So there would be a long way to go for the US to become independent of crude oil imports.

The reduction in crude exports more or less corresponds to the increase in shale oil production so that refinery input basically remains on the same level.
Data are from here:
crude production: http://www.eia.gov/dnav/pet/pet_crd_crpdn_adc_mbblpd_a.htm
crude imports: http://www.eia.gov/dnav/pet/pet_move_impcus_a2_nus_epc0_im0_mbblpd_m.htm
Outlook for shale oil

This graph shows 3 crude oil production scenarios of EIA’s Annual Energy Outlook published in May 2013. Actual production appears to follow the “high resource scenario”.
Only another 2.5 mb/d can be expected by the mid 2020s which would reduce imports to 5.5 mb/d . This shows that the US will always be dependent on crude oil imports.
But it could also be that actual production reflects a fast extraction path resulting in an earlier peak.
The following graph shows the permanent battle in shale oil fields to grow production. As an example in Bakken, decline in old wells has now reached 60 kb/d EVERY MONTH which is 6.3 % of production (red columns), up from 5.5 % 2 years ago.
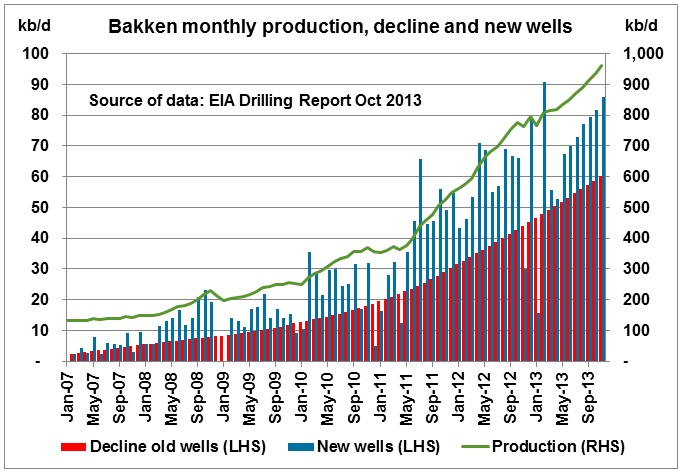
For November 2013, it is expected that new wells (blue columns) will yield 85 kb/d so the net increase is only 85-60=25 Kb/d. As the monthly decline is increasing with the number of old wells, drilling of new wells has to ever increase. Once this is no longer possible, production will peak.
Data from: AEO 2013 http://www.eia.gov/forecasts/aeo/pdf/0383(2013).pdf
Short term energy outlook http://www.eia.gov/forecasts/steo/report/
and Drilling Report Oct 2013 http://www.eia.gov/todayinenergy/detail.cfm?id=13471
.
This typical production profile of a shale oil play shows the steep declines experienced in such an oil supply system. If, for argument sake, drilling were to stop (e.g. in another credit crunch) total production would follow these declining lines.
US crude and product imports by country of origin
US crude and product imports peaked in 2005 at 13.7 mb/d and are now running at around 10 mb/d.

Canada, Mexico, Venezuela and Saudi Arabia are the main suppliers, making 60% of total imports.

Imports from Canada have increased steadily (syncrude from tar sands) but imports from Mexico have declined because of peak oil in this country. Imports from Europe are also in decline, somehow offset by imports from Russia.

Oil imports from OPEC have declined from around 6 Mb/d in 2008 to 3.7 mb/d in 2013 which is mostly crude. Only 240 kb/d were petroleum products.

Oil imports were reduced over a wide range of countries, especially vulnerable suppliers like Nigeria, Iraq, Algeria, Saudi Arabia and Venezuela (56% of the total reduction)
Conclusion
US shale oil has replaced around 2 mb/d of crude oil imports. If EIA’s projections are correct, crude imports could be reduced by another 2-2.5 mb/d. That would leave the US still with a crude import requirement around the 6 mb/d mark. To call this energy independency is more than an exaggeration.
Further reading
12/8/2013 Whither shale oil – an interview with David Hughes
http://peak-oil.org/2013/08/whither-shale-oil-an-interview-with-david-hughes/
1/5/2013 Interview with Steven Kopits from Douglas-Westwood
http://www.stcwa.org.au/index.php?option=com_content&task=view&id=5199&Itemid=134
Related posts:
11/9/2013 US shale oil hides crude oil peak in rest of world
https://crudeoilpeak.info/us-shale-oil-hides-crude-oil-peak-in-rest-of-world
22/7/2013 US oil demand peak was in 2007
https://crudeoilpeak.info/us-oil-demand-peak-was-in-2007
14/7/2013 The high cost of railroading unconventional crude oil
https://crudeoilpeak.info/the-high-cost-of-railroading-unconventional-crude
13/12/2012 US still needs to import 50% of its crude oil requirements despite increasing shale oil production
https://crudeoilpeak.info/us-still-needs-to-import-50-percent-of-its-crude-oil-requirements-despite-increasing-shale-oil-production