This article is using data collected in:
https://crudeoilpeak.info/tankers-arriving-and-departing-in-sydney
The objective here is to visualize the tanker traffic and where it comes from and to detect whether the number of tankers arriving is declining. In his Saturday press conferences the Energy Minister always gives the total number of tankers on the water to arrive in the next 4 weeks but no further details and – for the last 2 months – not how many have actually arrived.
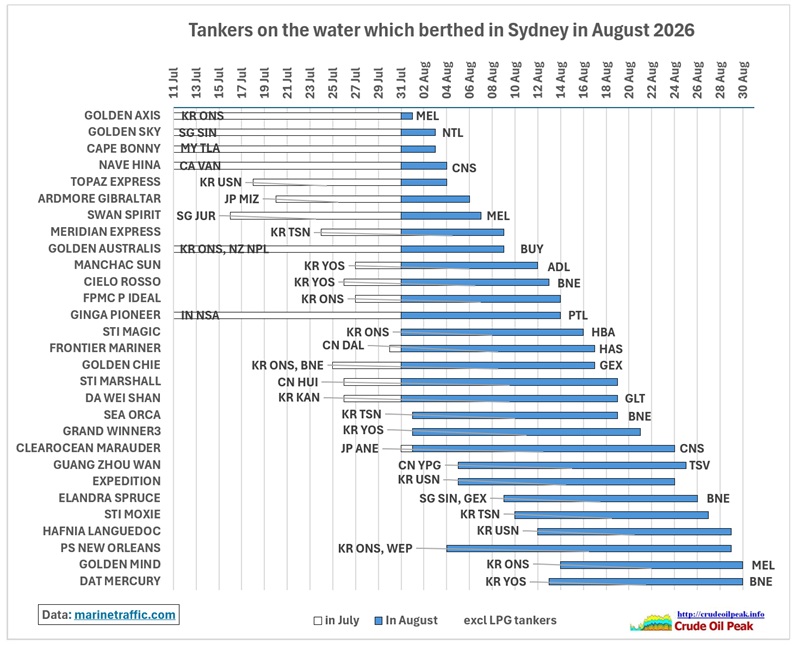
 Fig 1: Tanker arrivals in Sydney August 2026, total 29 tankers
We start on 11 July, an MSO update Saturday. On the left we see the ports where tankers were originally loaded. Sometimes, tankers have already offloaded part of the fuel along the coast. On the right we see the domestic ports to which tankers have proceeded after visiting berths in Sydney. If no domestic port is indicated, tankers have returned to a port overseas (but not necessarily the overseas port where the tanker departed)
LPG tankers are not included because firstly, LPG is not a fuel for which MSO rules have to be followed and secondly, this is mainly coastal shipping and does not depend much on what is happening in the Middle East. LPG tankers usually berth at Botany Bay BLB1 which is also used by other tankers. Insofar it can limit access for other tankers. However, LPG tankers normally do not stay very long. Except occasionally with large LPG supplies from the US (example CLIPPER ORION 44,000 dwt on 9 Aug).
On the left, we see the ports of origin (overseas) plus in some few cases Australian ports when these were visited first before coming to Sydney. On the right there are the ports of next call when along the Australian coast.
During the 4 weeks between Saturday 1 August and 28 August there were 27 tankers on the water (and arriving). Under MSO definitions, tankers are considered “on the water” until fully discharged. So in the above bar chart a couple of days would have to be added when tankers proceed to another Australian port. That would involve intensive follow up work in each case.
We have following number of tankers for August from:
South Korea: 3 Small tankers, 6 tankers MR, 1 Intermediate tanker, 1 Bitumen tanker, 3 PANAMAX (LR1), 4 AFRAMAX (LR2), total 18
Singapore: 2 Intermediate tanker, 1 Tanker MR
China 1 PANAMAX (LR1), 1 Tanker MR, 1 Bitumen tanker
Japan: 2 Tankers MR
Malaysia: 1 PANAMAX (LR1)
Canada: 1 Tanker MR
India: 1 Tanker Flexy
Total 29 tankers
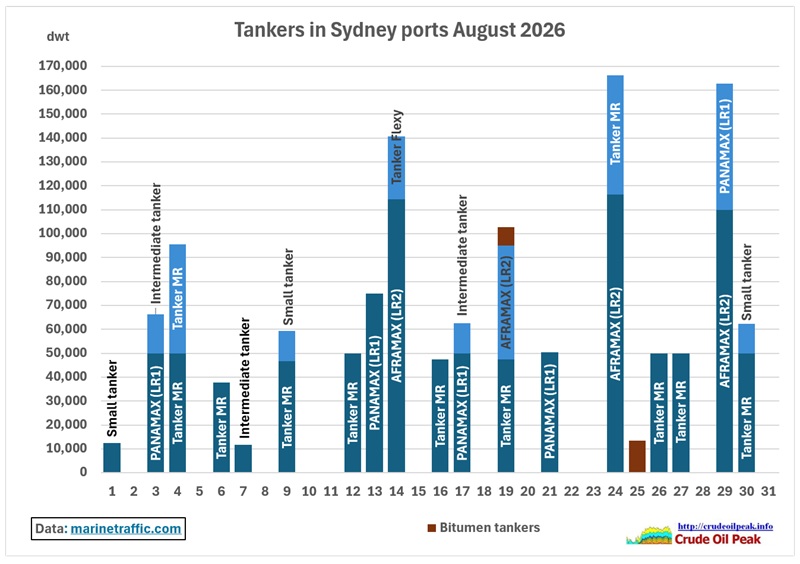 Fig 2: Tankers in Sydney ports, 29 tankers
The definition of tanker sizes are taken from https://maritimeoptima.com/
Small tanker appr. 12,000 dwt
Intermediate tanker appr. 16,000 dwt
Tanker MR (medium range) appr. 25,000 dwt – 50,000 dwt
PANAMAX (LR1) appr. 50,000 -70,000 dwt
AFRAMAX (LR2) appr. 100,000 – 120,000 dwt
We can see that most tankers are tankers MR and Panamax (LR1) but large deliveries are dominated by 4 Aframax (LR2) tankers (from South Korea)
It is difficult, if not impossible, to estimate how many ML were carried in each load because that depends on the type(s) of fuel. One tanker can carry several types of fuels. Petrol is lighter. We also don’t know how much was offloaded in Sydney and/or other ports.
Conclusion:
If the Energy Minister Chris Bowen were transparent, he would supply the above charts for all Australian ports at least monthly. There is no confidentiality involved here. All data are publicly available.