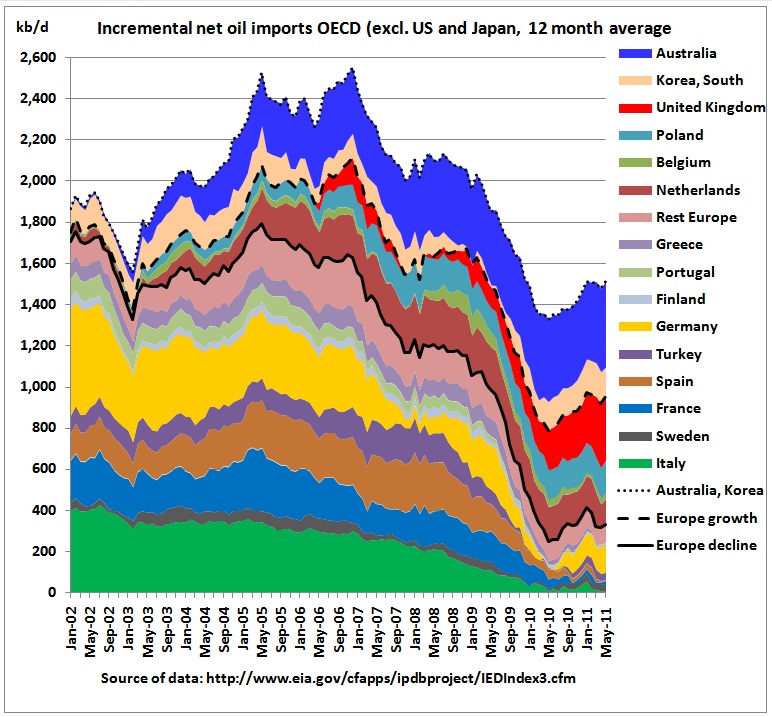
Among OECD countries Australia is #1 in increasing its net oil imports over the last decade, for some a proud, for others a sad achievement.
Federal Resource Minister Martin Ferguson told me in April 2010 at a Cabinet Community meeting http://www.dpmc.gov.au/community_cabinet/meetings/epping.cfm
that Australia can always buy oil. He was right. Was. But for how long he is right, is another question. Up to now it was sheer luck as we’ll see. And it came at a high price. Tapis in Asia is among the most expensive oil there is, 30 dollars more than WTI. In any case, importing more oil is not good for an economy which has to reduce its oil dependency. It delays the unavoidable adaptation process and hinders the development of alternative fuels.
Let’s get the evidence and have a look at OECD net oil import statistics, all data are from this website:
http://www.eia.gov/cfapps/ipdbproject/IEDIndex3.cfm?tid=50&pid=76&aid=3
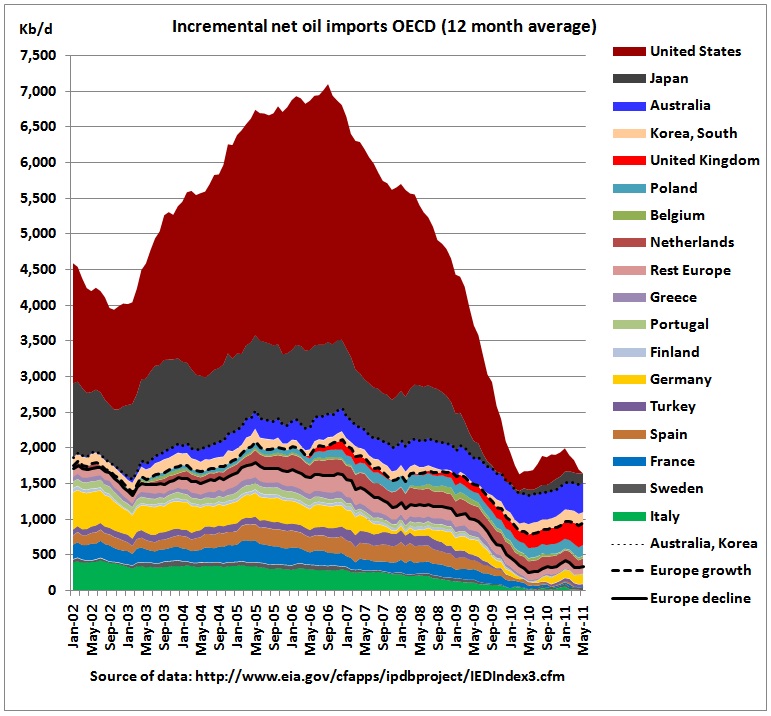 These are incremental net oil imports, based on monthly data. Since these vary considerably from month to month a 12 month average is calculated. Net imports are gross imports minus gross exports. Incremental is in relation to the minimum net imports found for each country in the period under consideration. This metric has to be taken because in a graph one cannot stack areas which are partially negative.
From the above graph we can see that the US was hit hardest by peak oil which started in 2005. Japan reduced its oil imports by almost 1 million barrels over 8 years. Let’s zoom into the rest of the OECD:
 Imports from the rest of the OECD peaked in 2006 and declined since then by around 1 mb/d. But then within this group there are countries with increasing oil imports. In Europe these are UK, Poland, Netherlands and, to a lesser extent, Belgium. In Asia it’s South Korea and, you guessed it, Australia. Let’s compare Australian net oil imports with those from a European country with the highest drop in exports between 2002 and 2010, Germany.
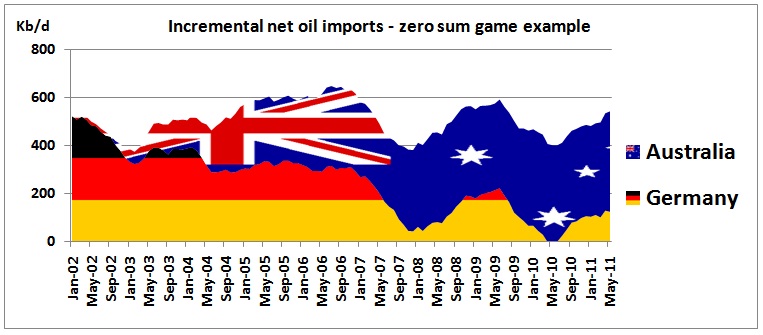
Both countries started off in Jan 2002 with a combined 523 Kb/d and ended up together with a similar 544 kb/d in May 2011. Whatever Germany “saved”, Australia gobbled it up, with just one quarter the population. Well done, Australia. There couldn’t be a better evidence of Australia’s oil addiction. Imagine all those BMW, Mercedes and Volkswagen engineers working hard to reduce fuel consumption for their vehicles in order to reduce CO2 emissions. It all comes to nothing. Of course this comparison is arbitrary. One could equally do this exercise with France or Italy.
Now back to the thinking of the Resource Minister that one can always buy oil. Were the Europeans able to buy Libyan oil when the war started there? Of course not:
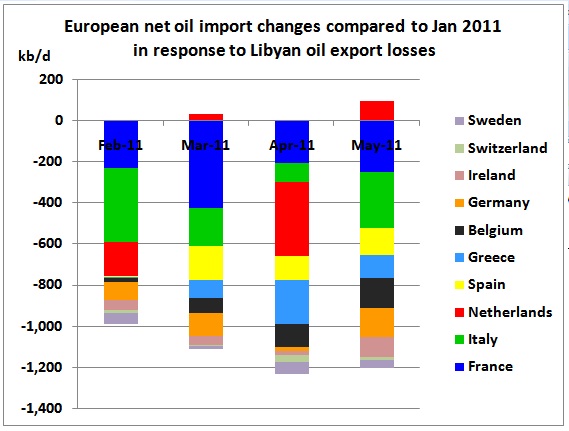
Libyan export losses were around 1.3 mb/d, approximately the amount of oil the above European countries were forced to import less. Oil prices went up. Thanks God the economy was not strong as a result of the financial crisis. Otherwise we would have seen oil prices going through the roof.
And what happened in Asian OECD countries?
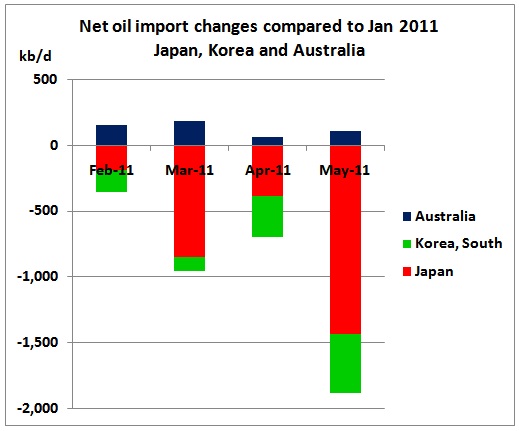
In the same period, Japan and South Korea reduced their imports and Australia was able to take advantage of this. Lucky country. But for how long? Asia imports as much oil as the whole Middle East exports.
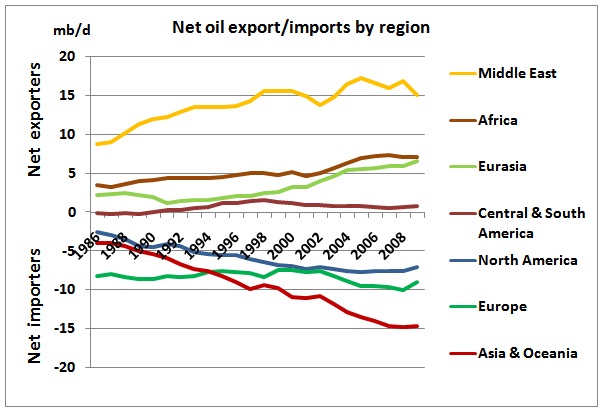
What happens when a war breaks out in the Middle East? Tensions between Saudi Arabia and Iran, civil unrest in Syria and Yemen spreading to neighbouring countries, the unresolvable issues between Israel and the Palestinians, the conflicts over gas in the Eastern Mediterranean, the planned withdrawal of US troops from Iraq: the density of problems is increasing with every week. Yet, Australian governments seem to live on a different planet, build new lanes on motorways and pull down bus ramps:

Anno Domini October 2011: Unnecessary M2 widening work in Sydney. This bus ramp to a rail hub is planned to be pulled down. New bridge columns can be seen blocking the ramp already now. Those allowing this work to proceed will be fully responsible for the consequences.