Categories
- Africa
- Algeria
- Angola
- Asia
- Australia
- Australia Budget
- Australia Transport
- Australian Mining
- Australian natural gas
- Australian rail
- Australian refineries
- Aviation
- BP
- BP Statistical Review
- Cars
- China
- Coal Seam Gas
- Crude oil analysis
- Debt
- Egypt
- Europe
- Feature1
- Global
- Hormuz
- India
- Iran
- Iraq
- Japan
- Korea
- Kuwait
- Latin America
- Libya
- Malaysia
- Middle East
- Motorways
- New South Wales
- North Sea
- OPEC
- Peaky Leaks
- Persian Gulf
- Power Supply
- Qatar
- Russia
- Saudi Arabia
- Shale gas
- Shell
- Shipping
- Singapore
- South East Asia
- Sudan
- Sydney
- Sydney Metros
- Syria
- Taiwan
- Tony Abbott Australian PM
- Ukraine
- United Arab Emirates
- United Kingdom
- United States
- Venezuela
- Vietnam
Sidebar menu
- Net oil importers
- Oil Exports
- Crude oil imports
- Downloads
- Latest Graphs
- Oil price analysis
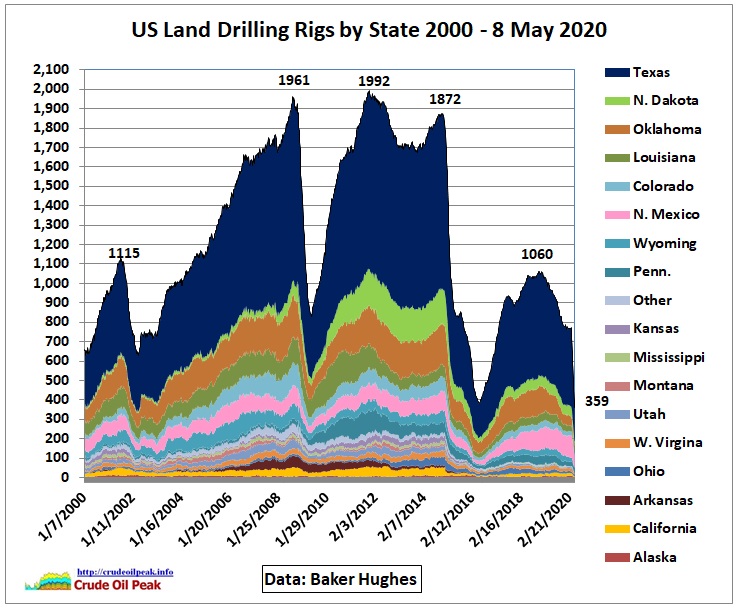 US drilling rig count
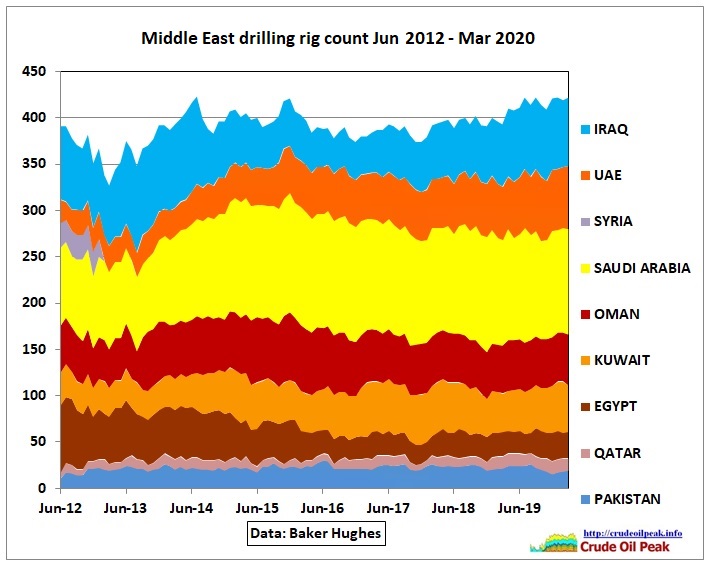 International drilling rig count
- Australian fuel prices
- Diary
- International oil companies
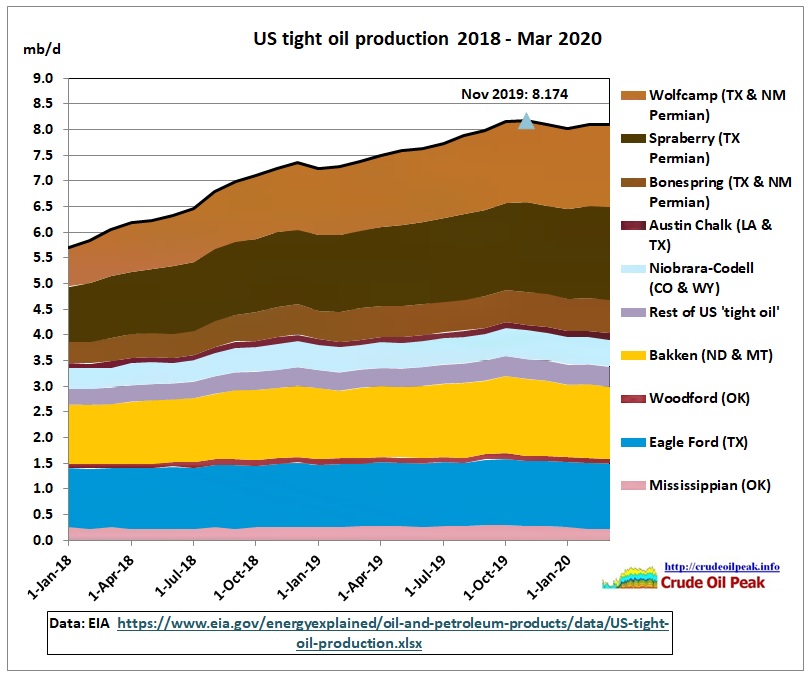 US tight oil production
 China peak oil
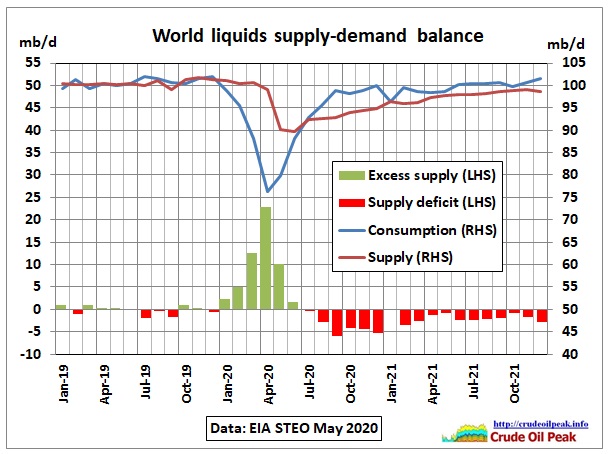 World liquids supply – demand balance
 Tankers arriving and departing in Sydney
 Australian oil and fuel imports
-
BP Statistical Review Archive
-
![The annual BP Statistical Review has come out, as usual in June. In this post we focus on the Asia Pacific region. This is important because the Australian government has […]](http://crudeoilpeak.info/wp-content/uploads/2015/06/Asia_oil_production_consumption_2005-2014-115x115.jpg "Asia’s oil consumption at record high while production peaked in 2010")
Asia’s oil consumption at record high while production peaked in 2010
Posted on June 23, 2015 | No CommentsThe annual BP Statistical Review has come out, as usual in June. In this post we focus on the Asia Pacific region. This is important because the Australian government has […] -
![This is the 1st post on the BP Statistical Review 2014 which has been published recently. There are many reasons why oil prices went up in the last 10 years […]](http://crudeoilpeak.info/wp-content/uploads/2014/06/BP_Stat_Review_1965_2013_Peaked_and_decline-115x115.jpg "Oil prices started to skyrocket when one quarter of global supplies went into irreversible decline")
Oil prices started to skyrocket when one quarter of global supplies went into irreversible decline
Posted on June 25, 2014 | No CommentsThis is the 1st post on the BP Statistical Review 2014 which has been published recently. There are many reasons why oil prices went up in the last 10 years […] -
![Summary: Oil reserves as reported in the Statistical Review have experienced a phenomenal growth but are not all proven (1P) reserves as claimed. The reserve tables provided contain a mixture […]](http://crudeoilpeak.info/wp-content/uploads/2012/08/Chavez_heavy_oil-115x115.jpg "BP Statistical Review 2012 The incredible growth of oil(y) resources")
BP Statistical Review 2012 The incredible growth of oil(y) resources
Posted on August 12, 2012 | No CommentsSummary: Oil reserves as reported in the Statistical Review have experienced a phenomenal growth but are not all proven (1P) reserves as claimed. The reserve tables provided contain a mixture […] -
![This is easy to check. From the Geoscience Australia website (GA – Oil and Gas Resources of Australia – OGRA) we add total reserves (proved and probable = 2P) for […]](http://crudeoilpeak.info/wp-content/uploads/2012/07/BP_Stat_Review_proved_reserves_vs_GA_proven_and_probable_reserves_1980_2011-115x115.jpg "BP Statistical Review 2012 Part 2 Australia proved oil reserves overreported by a factor of 2")
BP Statistical Review 2012 Part 2 Australia proved oil reserves overreported by a factor of 2
Posted on July 25, 2012 | No CommentsThis is easy to check. From the Geoscience Australia website (GA – Oil and Gas Resources of Australia – OGRA) we add total reserves (proved and probable = 2P) for […] -
![Graphs prepared using data from the BP Statistical Review 2012 http://www.bp.com/sectionbodycopy.do?categoryId=7500&contentId=7068481 (1) Discrepancies BP data show oil consumption being higher than oil production. The discrepancy has been growing from 1998 […]](http://crudeoilpeak.info/wp-content/uploads/2012/06/BP_Stat_Review_2012_Production_Deficit_1987_2011-115x115.jpg "BP Statistical Review 2012 Analysis Part 1 Discrepancies and Peak Exports")
BP Statistical Review 2012 Analysis Part 1 Discrepancies and Peak Exports
Posted on June 14, 2012 | No CommentsGraphs prepared using data from the BP Statistical Review 2012 http://www.bp.com/sectionbodycopy.do?categoryId=7500&contentId=7068481 (1) Discrepancies BP data show oil consumption being higher than oil production. The discrepancy has been growing from 1998 […]