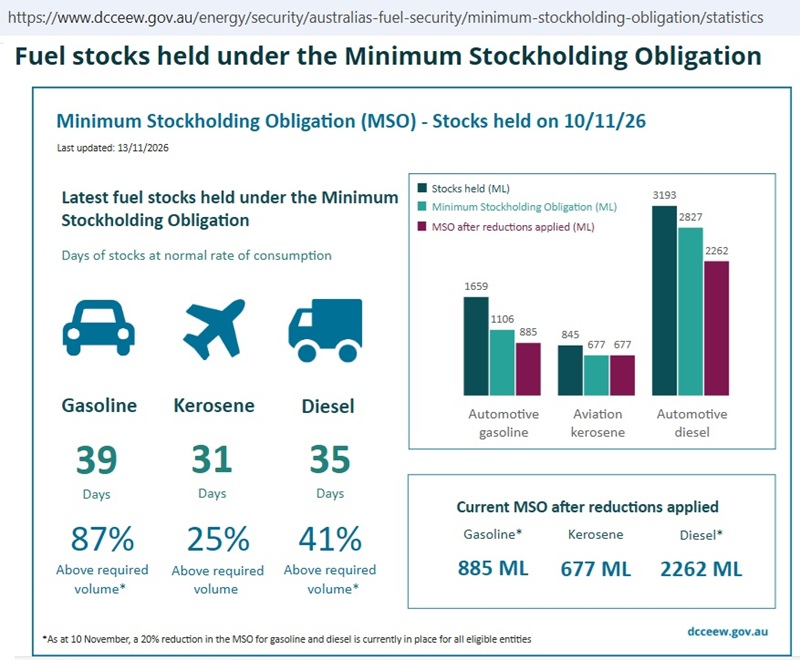
The latest Australian Petroleum Statistics show that end September diesel stock onshore was 2,073 ML when the Minimum Stock Holding Obligation was 2,225 ML at the time.
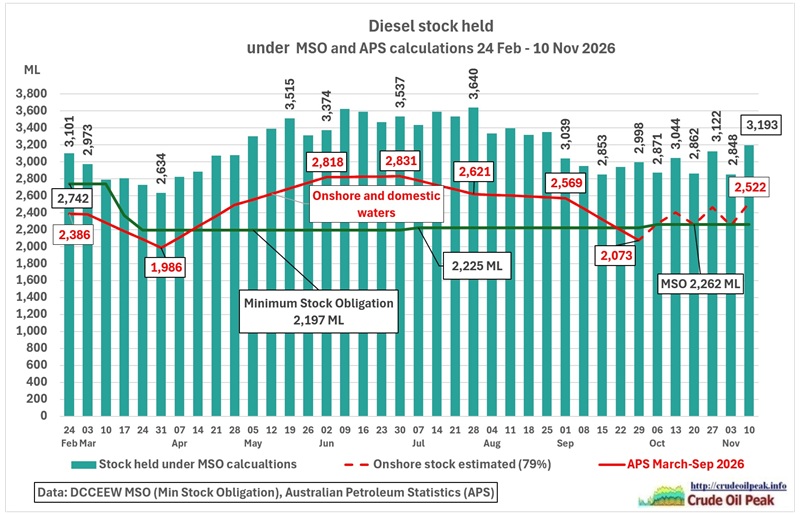 Fig 1: MSO diesel stock, APS stock and MSO
Since then, onshore stock is hovering barely above the increased MSO of 2,262 ML. Would Energy Minister Chris Bowen have explained this to the public? He is still at COP31. He released a beautifully designed and colored pictogram on Instagram and Facebook:
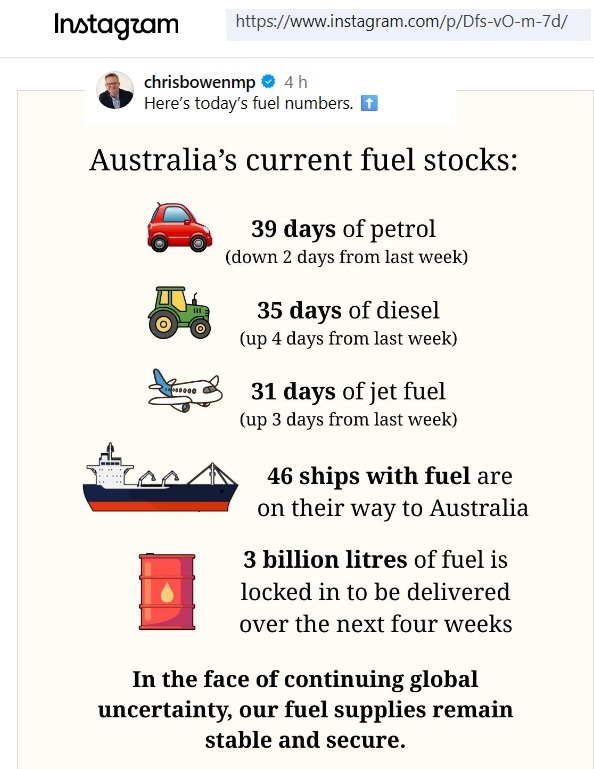 Fig 2: Fuel update 14 Nov 2026
https://www.instagram.com/chrisbowenmp/p/Dfs-vO-m-7d/
https://www.facebook.com/photo/?fbid=1678018430348971&set=a.334854787998682
At COP31, the conflict between energy security and the need to reduce emissions is very obvious. While the Prime Minister is lecturing the international community that “every fraction of a degree of warming we prevent will count” https://www.pm.gov.au/media/cop31-leaders-summit-opening-ceremony a coal mine re-opened in Queensland just this week https://www.abc.net.au/news/2026-11-12/qld-coalmine-reopens-after-being-in-receivership/107379524
Why is the MSO stock on this website https://www.dcceew.gov.au/energy/security/australias-fuel-security/minimum-stockholding-obligation/statistics so high? Because it includes the floating storage of tankers up to 200 nautical miles from the coast (EEZ):
Measures of liquid fuel stocks
22 Apr 2026
In addition to gasoline, kerosene and diesel stocks on land in Australia and domestic and coastal waters, the MSO includes:
• gasoline, kerosene and diesel stocks in pipelines and on water in Australia’s exclusive economic zone (EEZ)
• crude oil and certain unfinished stocks at refineries, converted to equivalent refined product.
https://www.dcceew.gov.au/energy/security/australias-fuel-security/measures-of-liquid-fuel-stocks
Did the Minister of the Environment, who replaced the Energy Minister, clarify that in his fuel update?
Press conference, Brisbane
14 November 2026
MURRAY WATT, MINISTER FOR THE ENVIRONMENT AND WATER:
I will just provide this week’s fuel update as well. Currently, Australia has 39 days’ worth of petrol, which is two days less than last week. We’ve got 35 days of diesel, which is four days more than last week, and we have 31 days of jet fuel, which is three days more than last week. That’s a total of 5.7 billion litres of fuel in Australia, which is 341 million litres more than last week. 46 ships are on the way to Australia with fuel, and 3 billion litres of fuel is locked in to be delivered over the next four weeks, and that includes 1.5 billion litres of diesel. 95 ships arrived in Australia carrying fuel. That’s the equal highest for the year, and 42 have all arrived already in November.
https://minister.dcceew.gov.au/watt/transcripts/press-conference-brisbane-3
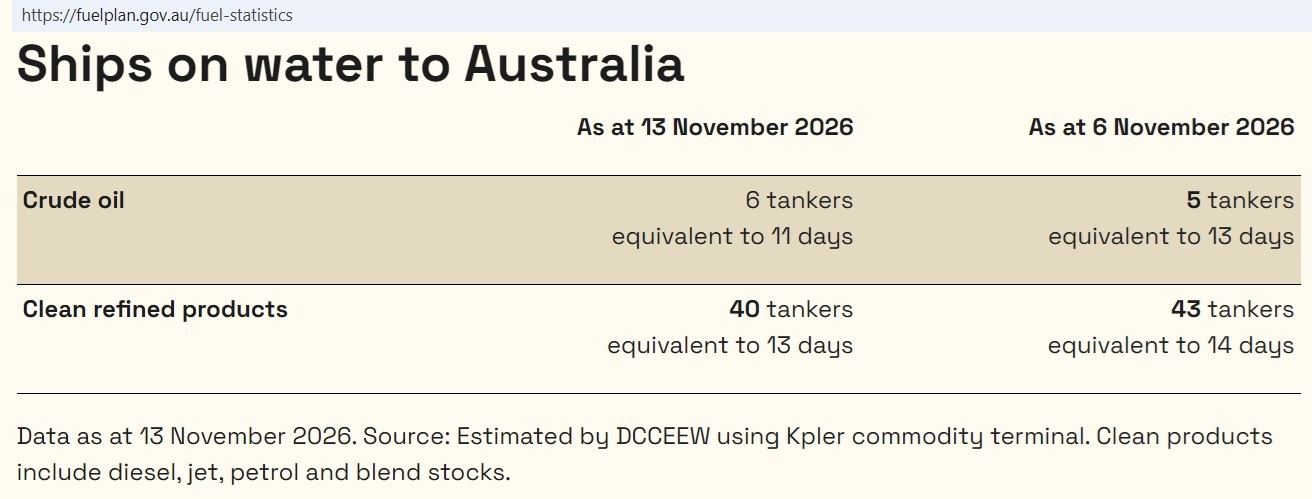
“Australia” is mentioned twice. The 5.7 billion liters include fuel in the EEZ. The 46 incoming ships are grouped under “scheduled to arrive from overseas in the next 4 weeks,” noting that “some of this is already on ships in transit and some is awaiting departure”
https://fuelplan.gov.au/fuel-statistics
After this clarification let’s have a look at the usual graphs prepared on this website.
The MSO stock numbers for all fuels together are a 6% improvement over last week.
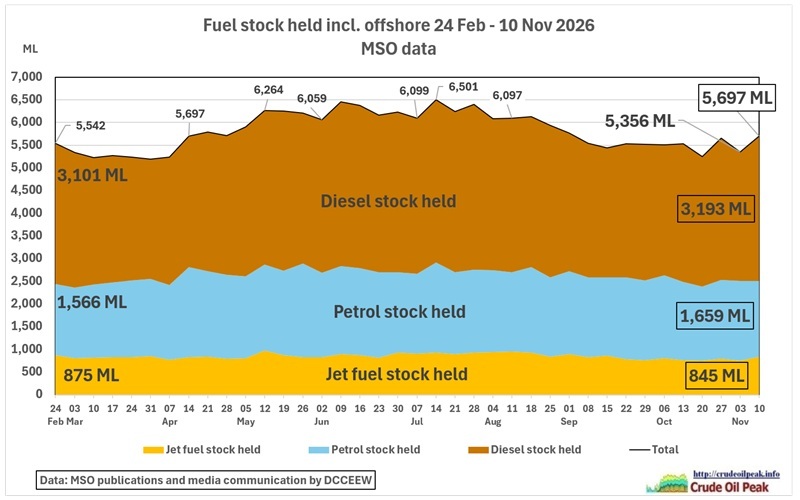 Fig 3: Stock of 3 fuels in ML
Let’s put the higher number of 35 diesel days into perspective:
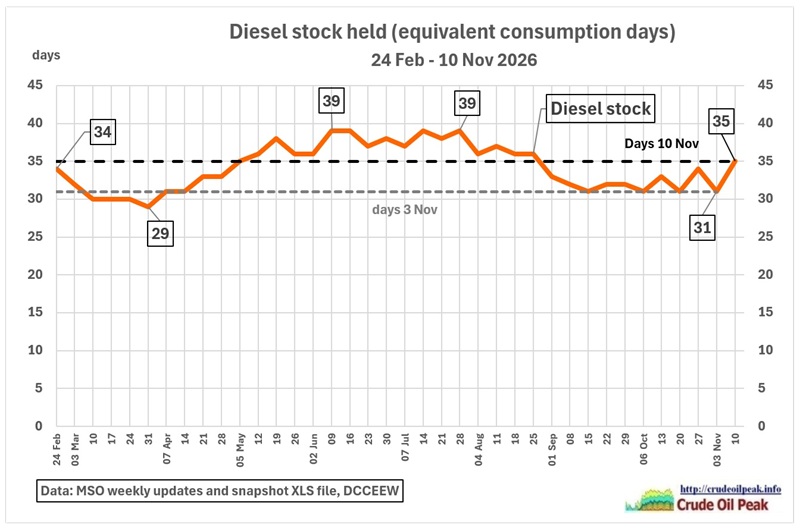 Fig 4: Diesel stock in days 24 Feb – 10 Nov
The horizontal line to compare with previous data has jumped up by 4 days but is still around the pre-war level end February. Here is a similar graph in ML:
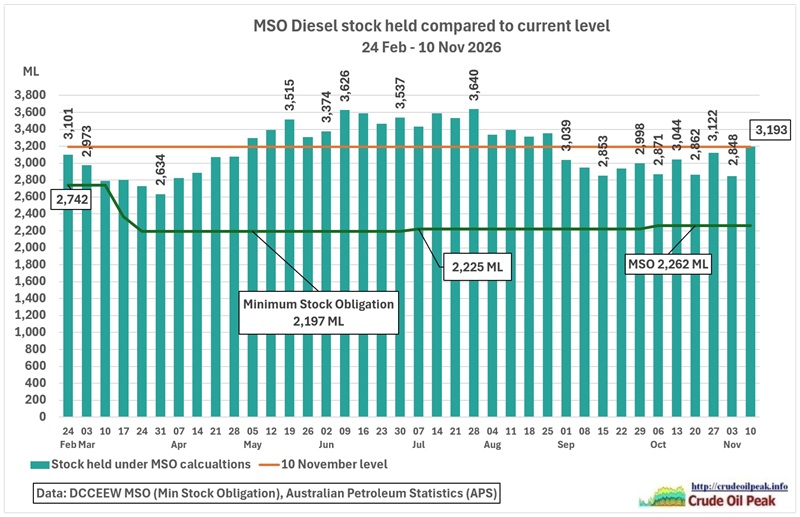 Fig 5: Diesel stock in ML
If the supply situation in the Middle East were to worsen Australia would not be in a better position than at the beginning of the Iran war. Where are we?
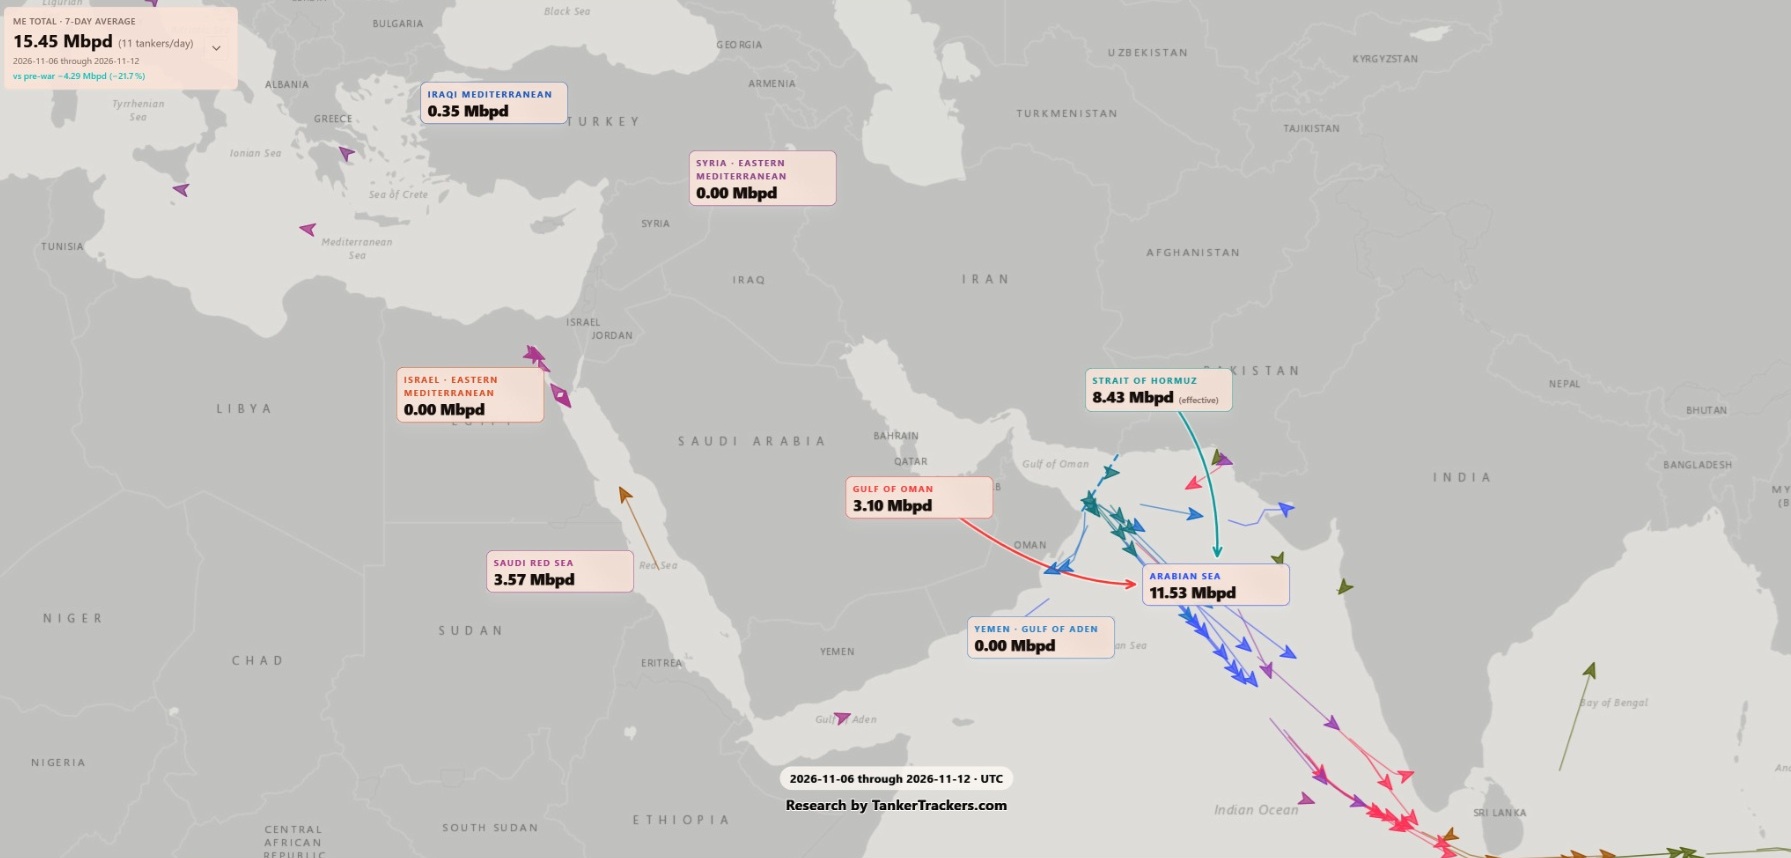 Fig 6: Crude oil exports from the Middle East 6-12 Nov 26 (colors inversed)
https://x.com/TankerTrackers/status/2121281065168109675/photo/1
In the Tankertracker’s hardly visible small print (top left) it says that exports are 4.29 mb/d down from pre-war levels (-21.7%). Note also that 3.57 mb/d of Saudi crude oil can’t pass through the Bab el Mandeb (arrow in direction of the Suez Canal and Sumed pipeline in Egypt). Supplies to Asia have to go around Africa, increasing cost, transit times and requiring more tanker capacity.
While writing this article:
Saudi-led coalition says air defenses intercept drone over eastern Saudi Arabia
15 Nov 2026
https://www.aa.com.tr/en/middle-east/saudi-led-coalition-says-air-defenses-intercept-drone-over-eastern-saudi-arabia/4125465
On 1 Nov JODI Data reported a Saudi oil production drop down to almost 6 mb/d in August
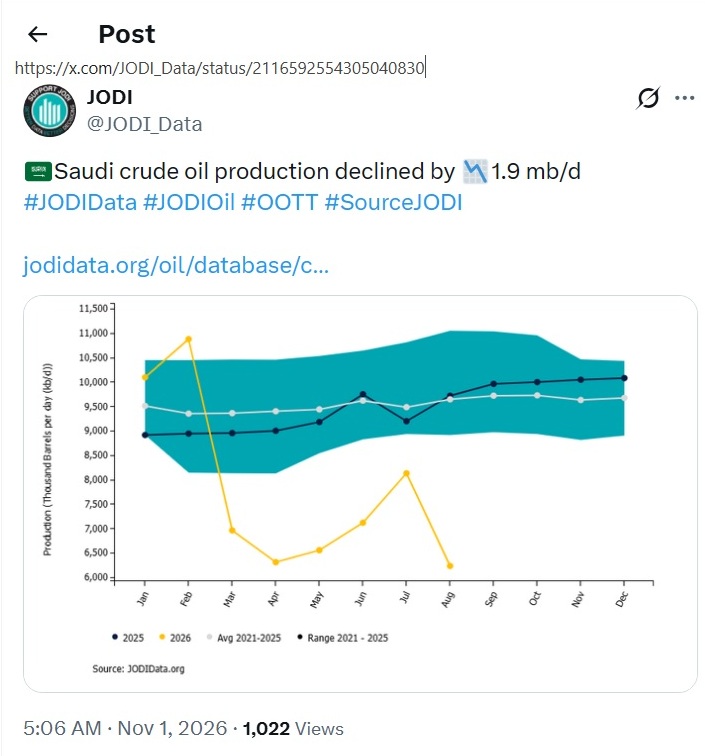 Fig 6: Saudi crude oil production up to August 26 compared to the 2021/25 range
https://x.com/JODI_Data/status/2116592554305040830
Back to tankers in Asia supplying Australia:
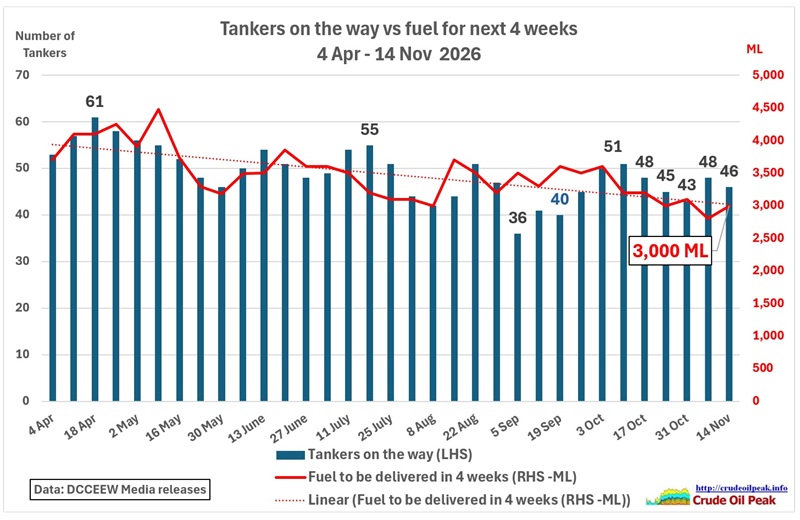 Fig 7: The number of tankers on the way is still on a declining trend
And let’s put the 3 bn litres of fuel to be delivered also into a timeline graph:
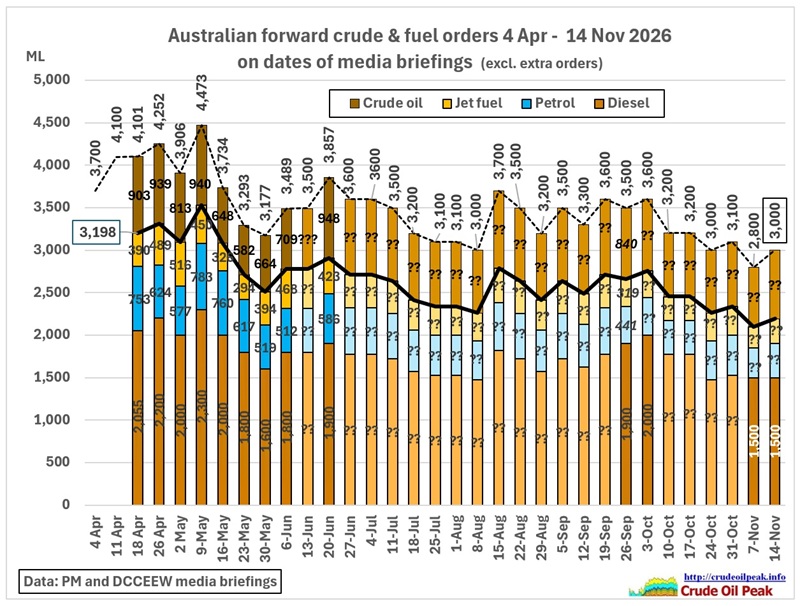 Fig 8: Oil and fuel deliveries in next 4 weeks
The declining trend since mid-August is not broken. Diesel orders are unchanged at 1,500 ML.
It would be interesting to compare forward orders with APS stock. We start by looking at reliable Australian Petroleum Statistics data for August 26
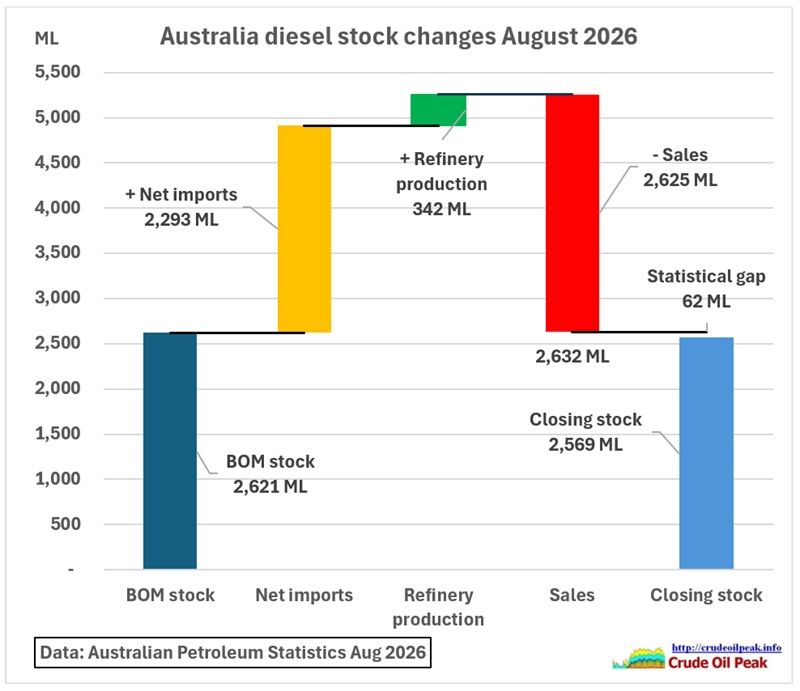 Fig 9: Diesel stock balance calculation for August 2026
In the 1st column at the left of the graph there is the opening stock (beginning of month stock BOM = closing stock of preceding month). We add in the 2nd column net imports and in the 3rd column the diesel production of the last 2 remaining refineries. Sales are deducted in the 4th column to arrive at an expected closing balance. But the actual closing stock in the APS statistics is 62 ML lower (2.4%). In an earlier post in May it was found the difference was negligible. Let’s have a look at all the months in this year so far:
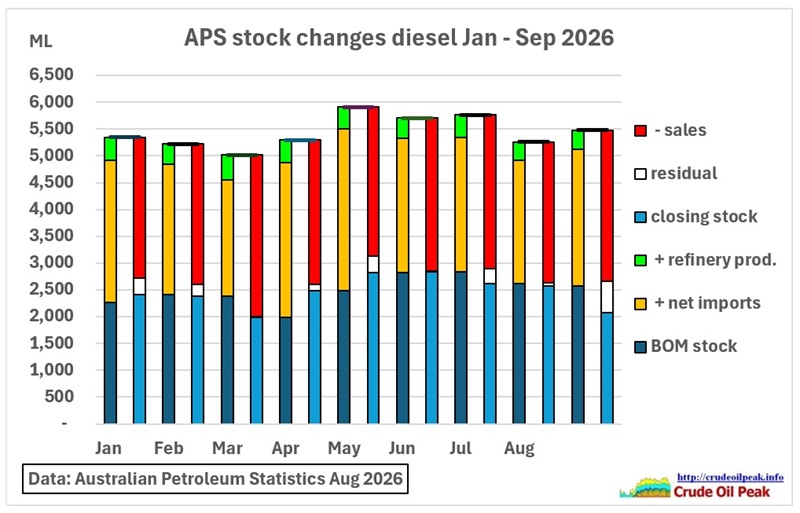 Fig 10: Diesel stock changes Jan – Sep 2026
Every month has 2 stacked columns. The left column is adding the BOM stock + net imports + refinery production, the right column is subtracting the sales (in red). Compared to the closing stock there is a residual (white). That is very likely the diesel gone to the mining industry
In another post we would need to estimate how these monthly balances look like using MSO data.
Annex