Skip to content

Crude Oil Peak

Menu
  • Home
    • About
    • Disclaimer
  • OECD imports
    • France
    • Germany
    • Italy
    • Japan oil imports
    • OECD Europe
    • OECD Pacific
    • South Korea
    • UK
    • US Imports
  • Australian graphs
    • Australian electricity supply graphs
    • Australian crude oil production
    • Australian crude oil reserves
    • Oil import dependency
    • Oil and fuel imports
    • ULP prices
    • Industry stocks
    • End use of oil
    • WA crude oil
    • WA domestic gas
    • East coast conventional gas
    • Geoscience Australia March 2010
    • Geoscience Australia 2005/2006
    • Gippsland
    • LPG
    • Petrol rationing in WW2
  • Oil reserves
    • OPEC paper barrels
    • Kuwait Reserves
    • Strategic Oil Reserve
  • Global Peak
    • Algeria peak
    • Angola peak oil
    • Argentina peak
    • Azerbaijan peak
    • Brazil
    • Brunei peak
    • Canada and tar sands
    • Caspian peak
    • China Peak Oil
    • Deepwater peak
    • Egypt
    • Gabon peak
    • India peak oil
    • Indonesia peak
    • Iran Peak
    • Libya peak oil
    • Malaysia-peak
    • Mexico peak
    • Norway peak oil
    • Qatar peak
    • Russia peak
    • Saudi Arabia export peak
    • Sudan Peak
    • Syria
    • Tunesia
    • UAE peak
    • UK Peak
    • US Peak
    • Vietnam peak
    • Venezuela peak
    • Yemen
  • Energy Transitions
    • Germany energy transition
    • Japan Energy Transition
    • UK Energy Transition
    • US
  • Fuel Shortages
    • China Fuel Shortages
    • Egypt Diesel shortages
    • India petrol price hike
    • Malawi fuel shortage
    • Nepal
    • Nigeria fuel shortage
    • Pakistan petrol shortage
    • Russia
    • Tanzania fuel shortage
    • Uganda Fuel Shortage
    • Yemen fuel shortages
  • I told you so
    • Top Ryde Shopping Centre
    • North South Bypass Tunnel (Clem7) Brisbane
    • Airportlink Brisbane
    • Cross City Tunnel
    • Lane Cove Tunnel
    • Too late for Metro tunnels
    • Australian car manufacturing closing down
    • How the first phase of peak oil brought Virgin Australia into minus after 2008
  • Solutions
    • Night trains
    • Electric Rail on Freeways
    • LNG locomotive conversion
    • Electric trolley buses
    • Walk to school
  • Oil crises
    • Oil crisis 1973
    • My experience oil crisis 1979
    • Historical Oil Disruptions
  • Food and Oil
    • Farm Costs Australia
    • Food crises and political instability
  • Global warming
    • Storms of my Grandchildren
    • Extreme weather events
    • Global warming and petrol lines
    • Compensation claims from global warming damage
    • Sea level rises
    • Why coal seam gas will not reduce CO2 emissions
Menu

More power price spikes on Australia’s east coast on 5 Aug 2024 lasting more than 2 hours

Posted on August 7, 2024

On 5 August 2024 Australia’s east coast experienced power price spikes in all States, only 5 days after it already happened on 31 July. Prices climbed as high as $17,500/MWh in NSW.

It is clear that this is an indicator of tight power supplies, while the problem is covered up by a $300 credit on all electricity bills, starting from 1 July 2024.

Yet, power hungry projects like apartment towers continue to be approved.
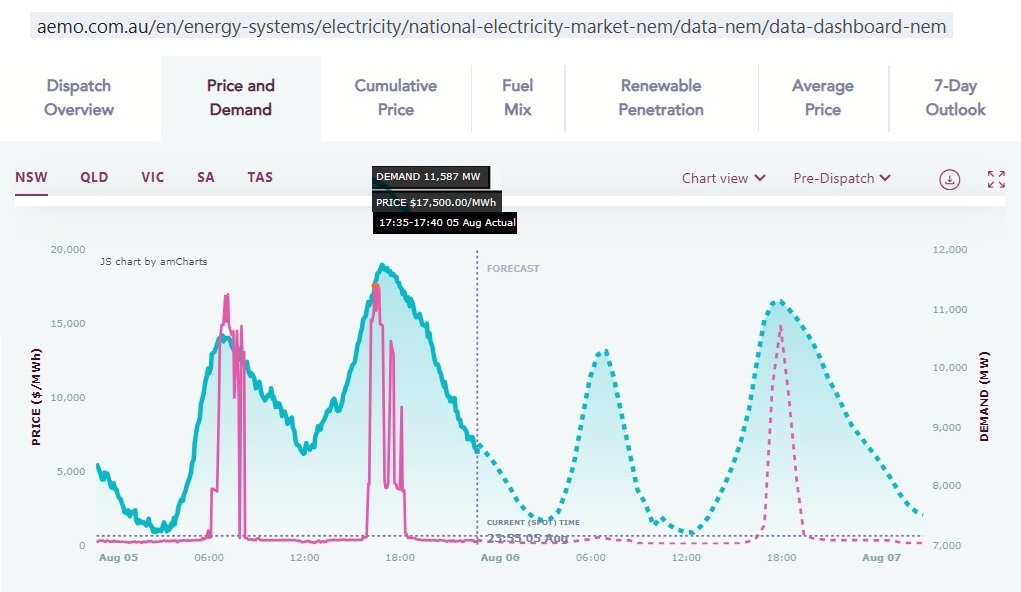
Fig 1: Two periods of power price spikes in the Premier State NSW on 5 Aug 2024
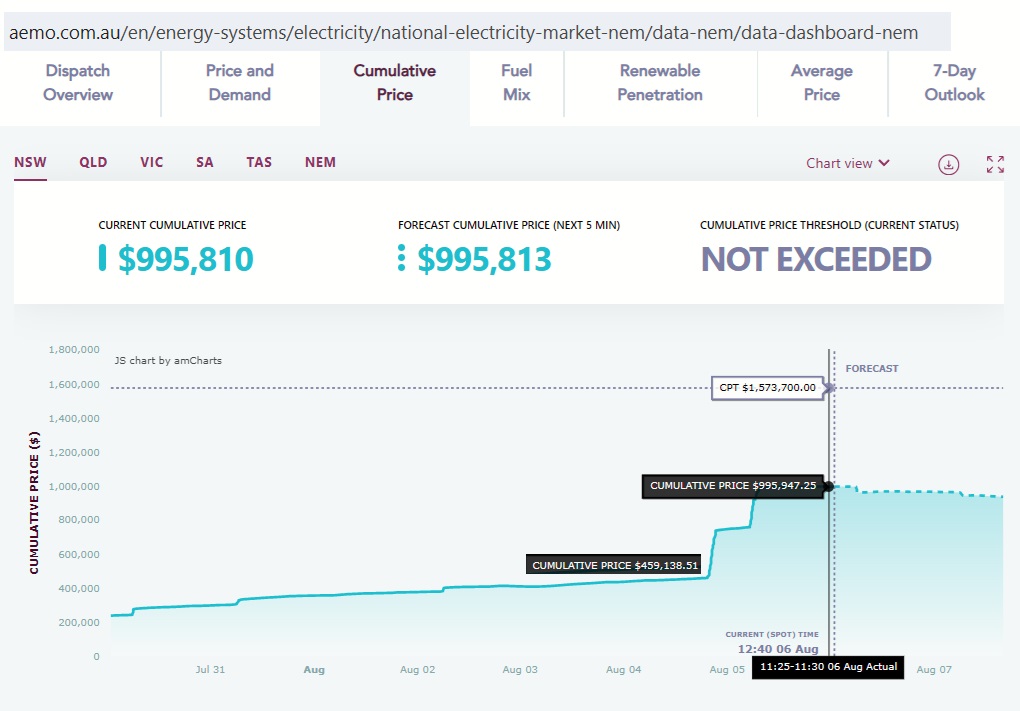
Data from: https://aemo.com.au/en/energy-systems/electricity/national-electricity-market-nem/data-nem/data-dashboard-nem

Fig 2: Cumulative prices in NSW doubled

The threshold is $1.57m at which point administered price capping is introduced
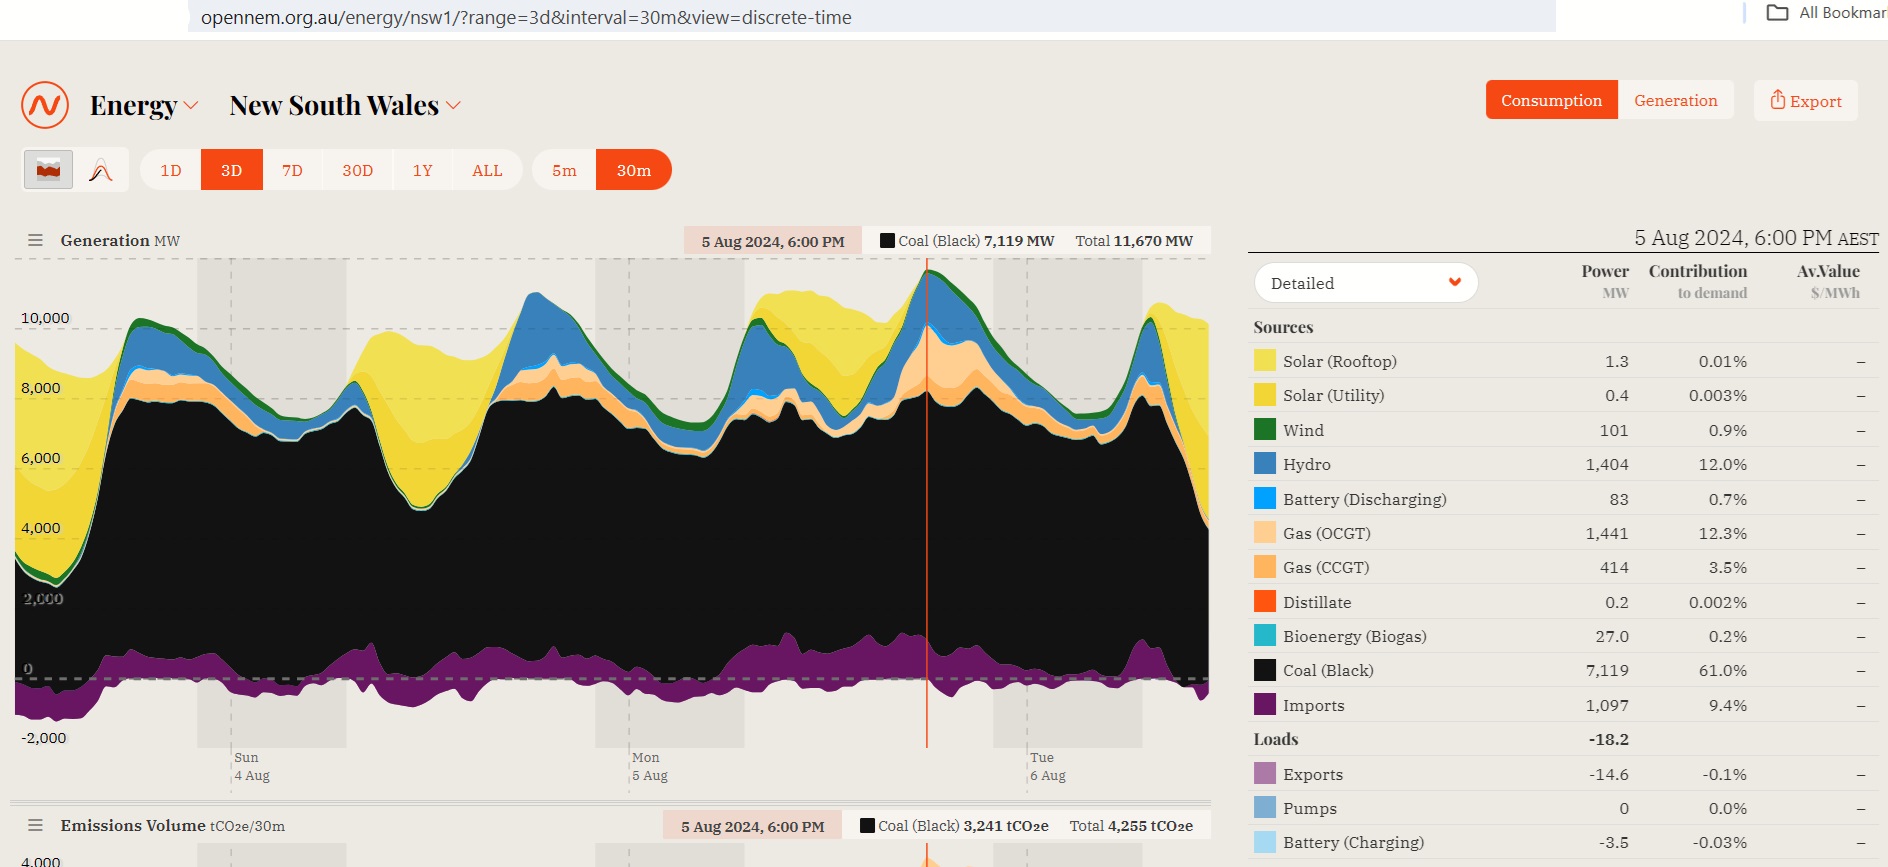
Fig 3: NSW power generation by fuel on 5 Aug

No wind. 2 cloudy days.
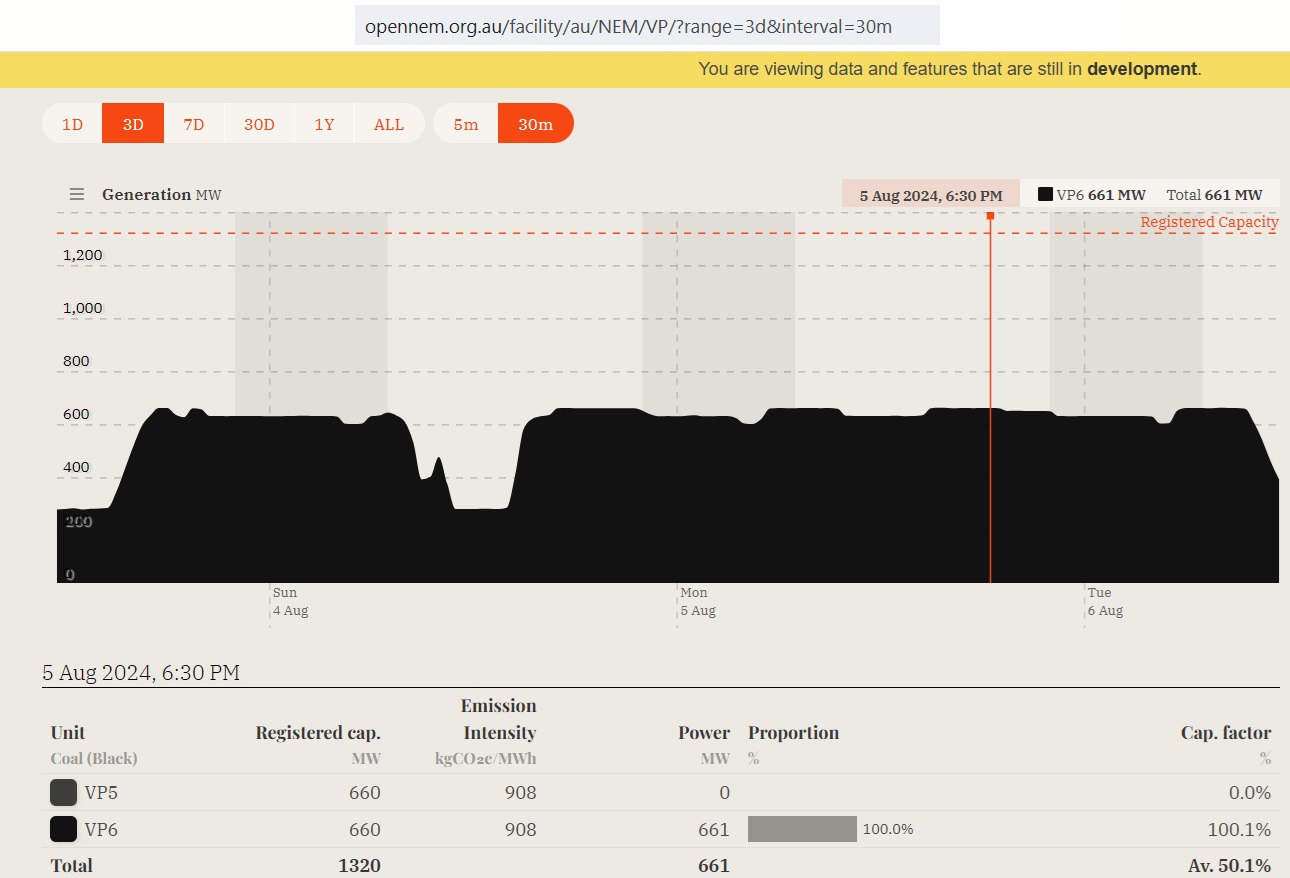
Fig 4: Vales Point unit VP5 offline

7/10/2022
Sale of Vales Point: How will Czech brown coal baron Pavel Tykac with
business registered in Liechtenstein impact on NSW coal and energy markets?
https://crudeoilpeak.info/sale-of-vales-point-how-will-czech-brown-coal-baron-pavel-tykac-with-business-registered-in-liechtenstein-impact-on-nsw-coal-and-energy-markets
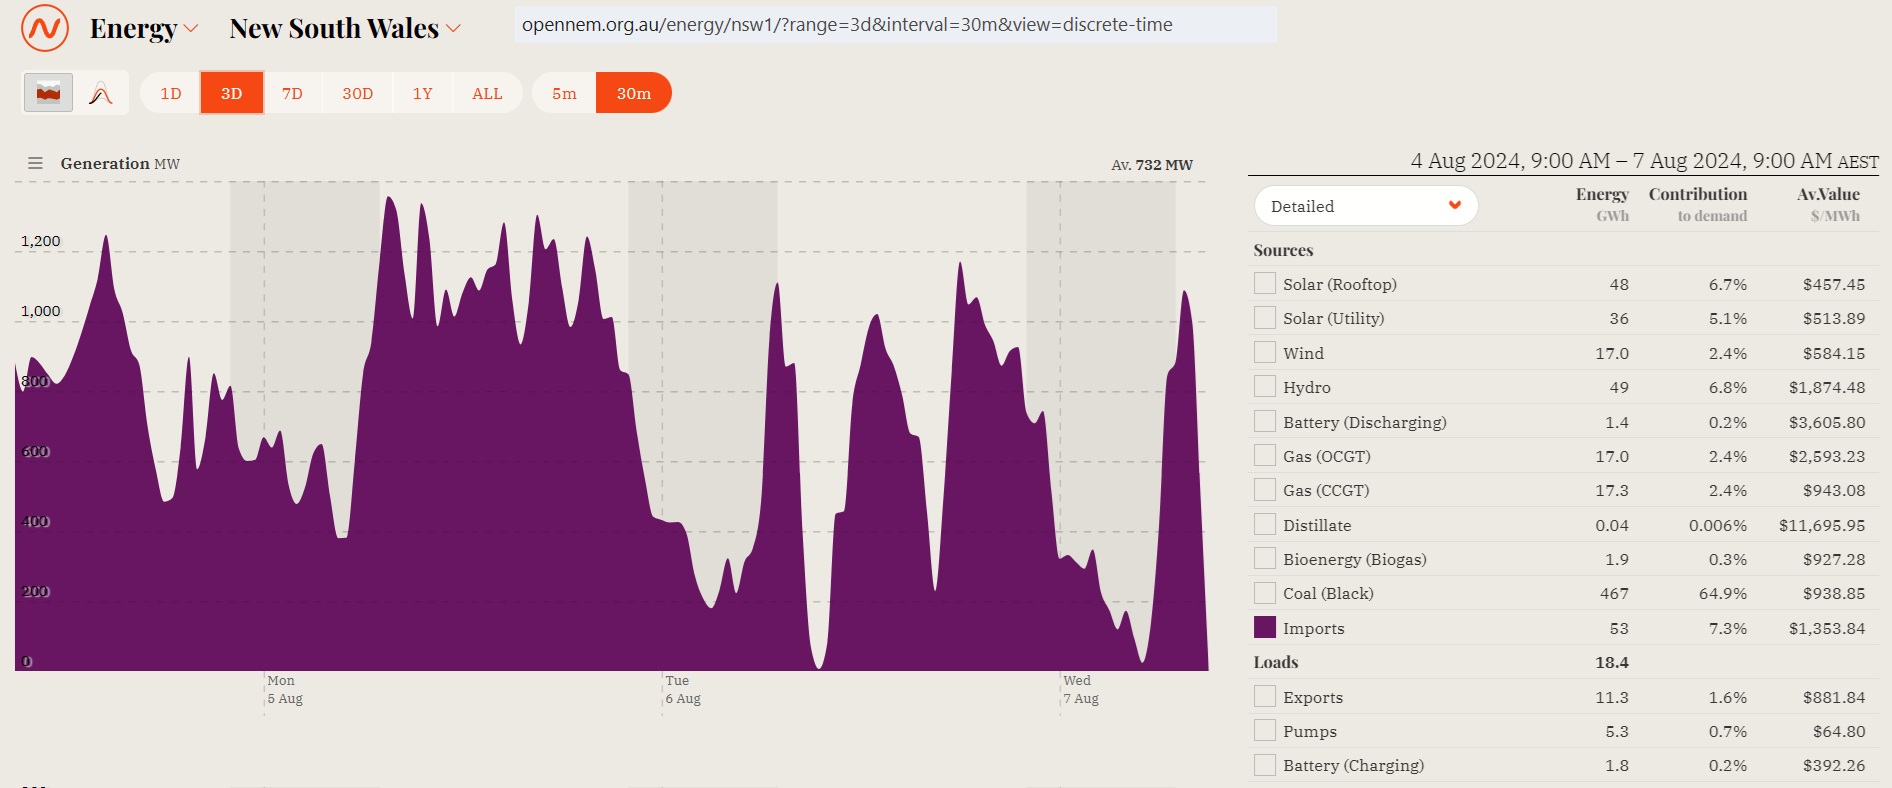
Fig 5: Continuous NSW power imports around 1,000 MW over 15 hrs on 5 Aug
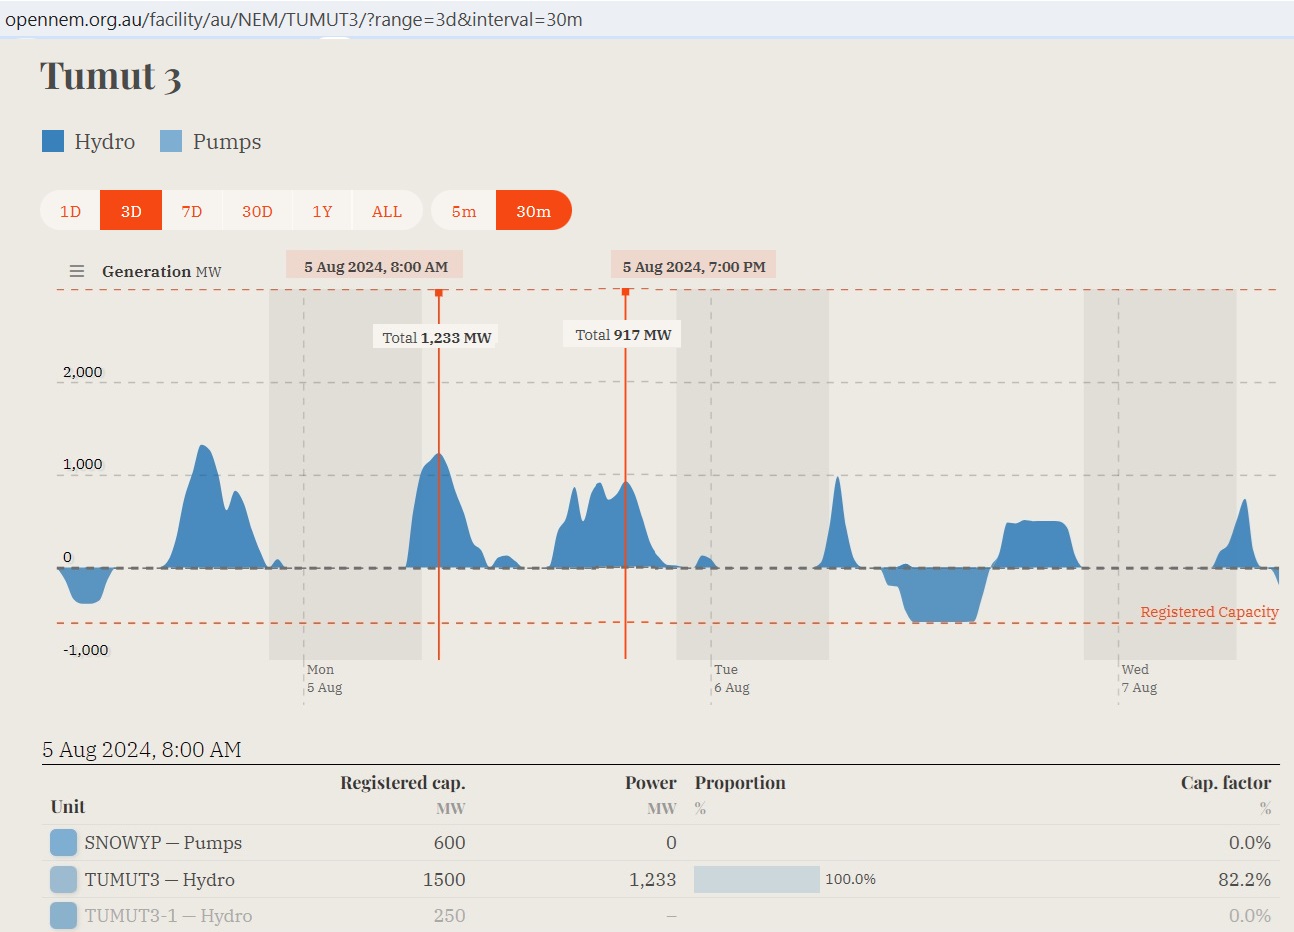
Fig 6: Tumut 3 pumped Hydro

We see that pumps are NOT operating as much as generators. This is a long term trend:
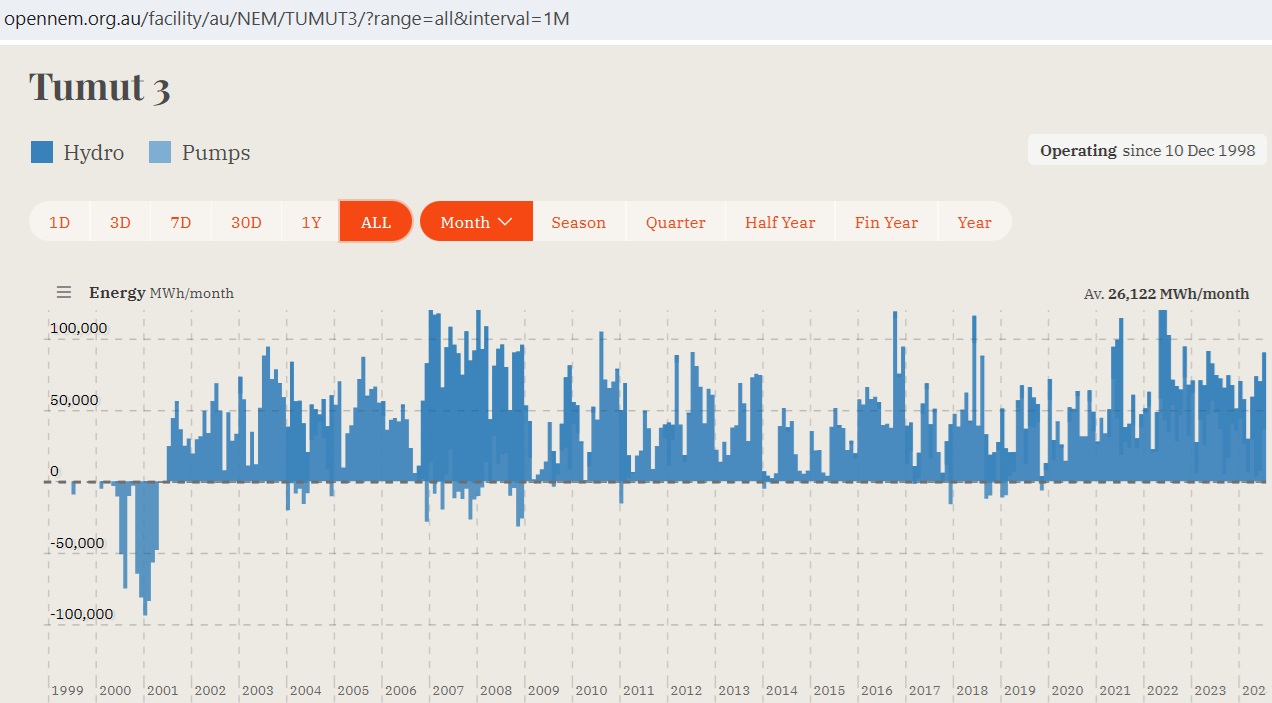
Fig 7: Tumut 3 is not really a pumped hydro over the long term

Output depends on rainfall and is therefore limited. Snowy2 will be better. Due to the delays in construction, it will be an exciting race with aging coal plants.
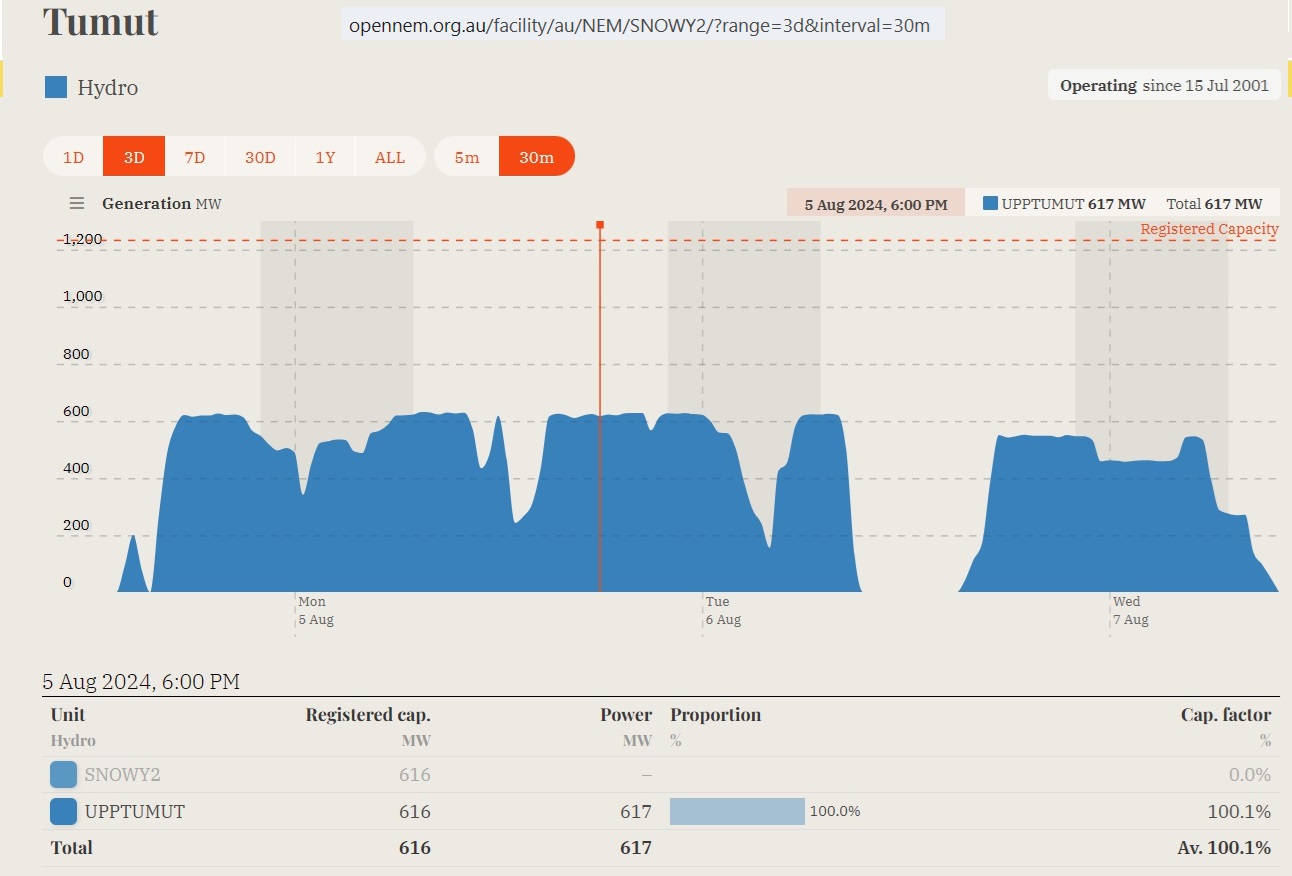
Fig 8: Tumut 1 (330 MW) and Tumut 2 (286 MW)
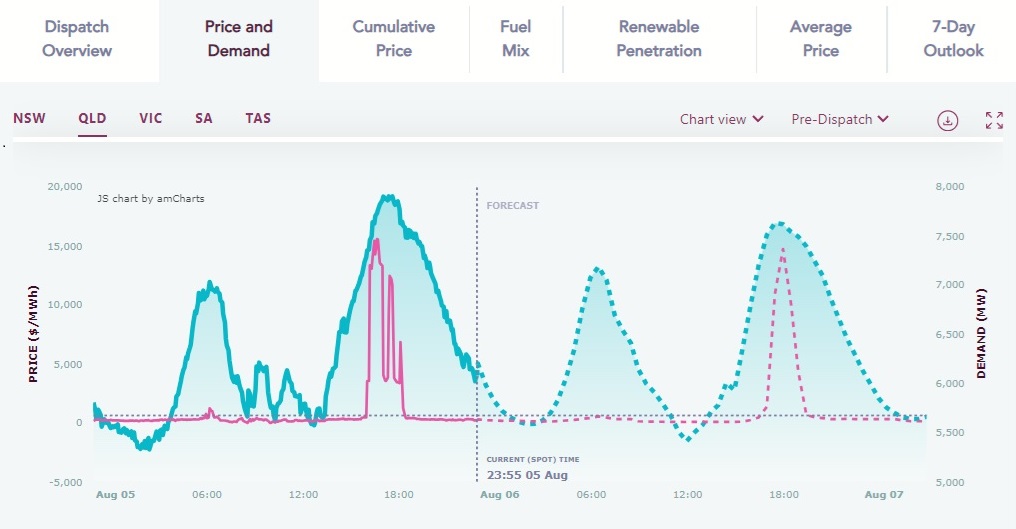
Fig 9: Afternoon/evening price spikes also in Queensland
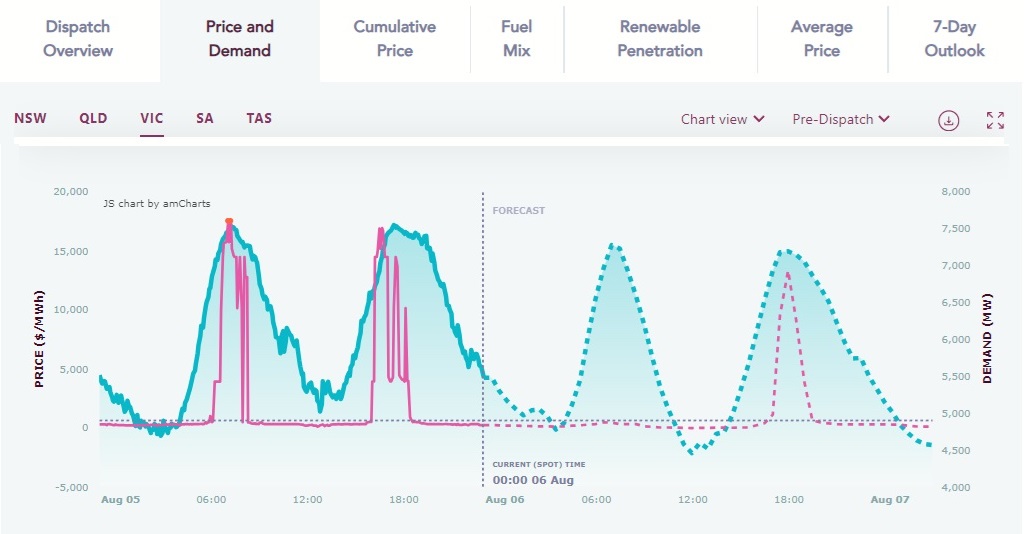
Fig 10: Two price spike periods in Victoria
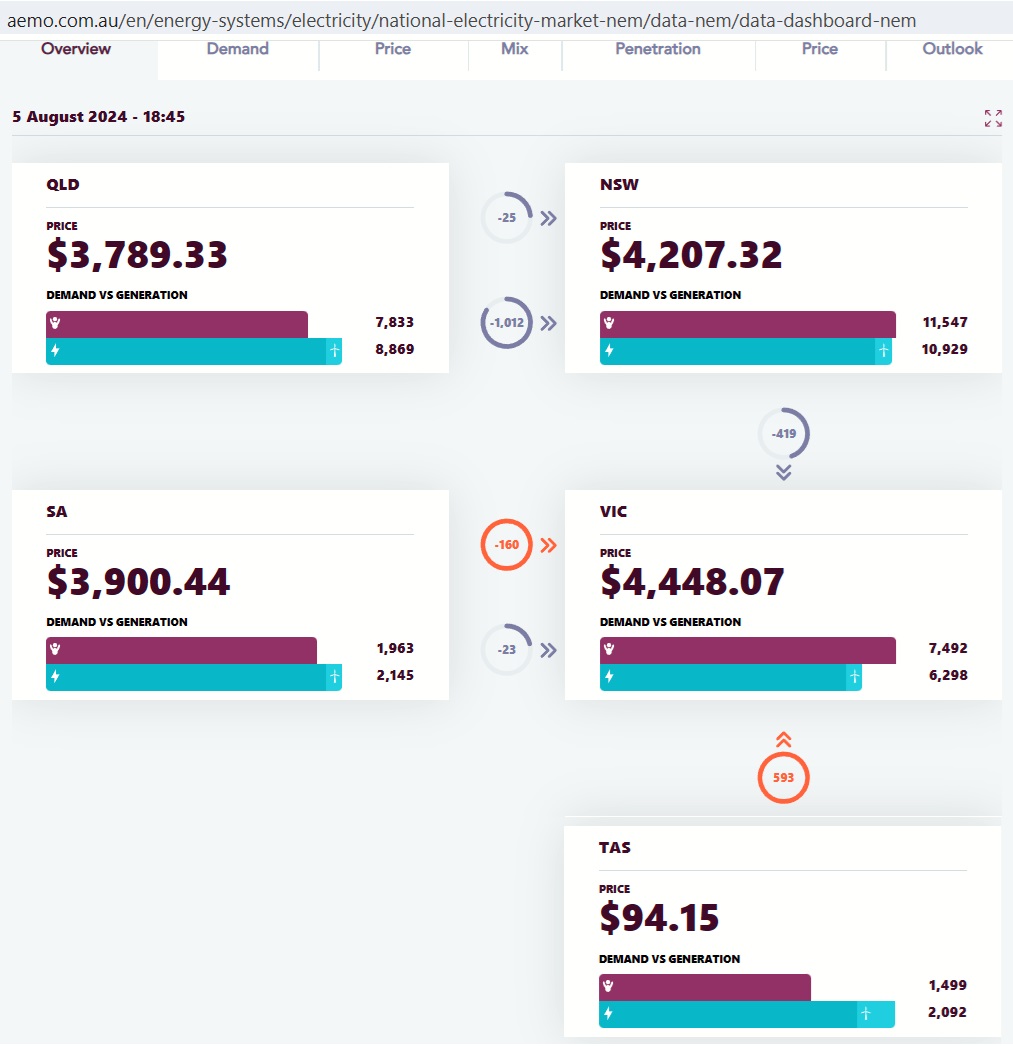
Fig 11: Power demand/generation balances by State during the evening peak

Victoria had the highest imbalance between demand and generation (1,194 MW), followed by NSW (618 MW). Queensland, South Australia and Tasmania were the exporters. These imbalances costed THE WHOLE EAST COAST dearly.

Please note that these calculations change every 5 min so Fig 11 is only a snapshot at that particular time. NSW imports over time are shown in Fig 5.

Conclusion:

It is obvious that the power supply system is under heavy stress in certain conditions. This is because redundancies like the Liddell power plant have been removed after this plant’s closure, contrary to media reports. The public is not aware of tight power supplies until the day the lights go out. And they will. Councils approve one energy hungry project after the other (mainly apartment towers), under duress from State governments who are energy complacent and have grand visions of perpetual growth.


Addendum with graphs from Watt Clarity

Wobbles in recent days, at Loy Yang A
posted on 15 Aug 2024
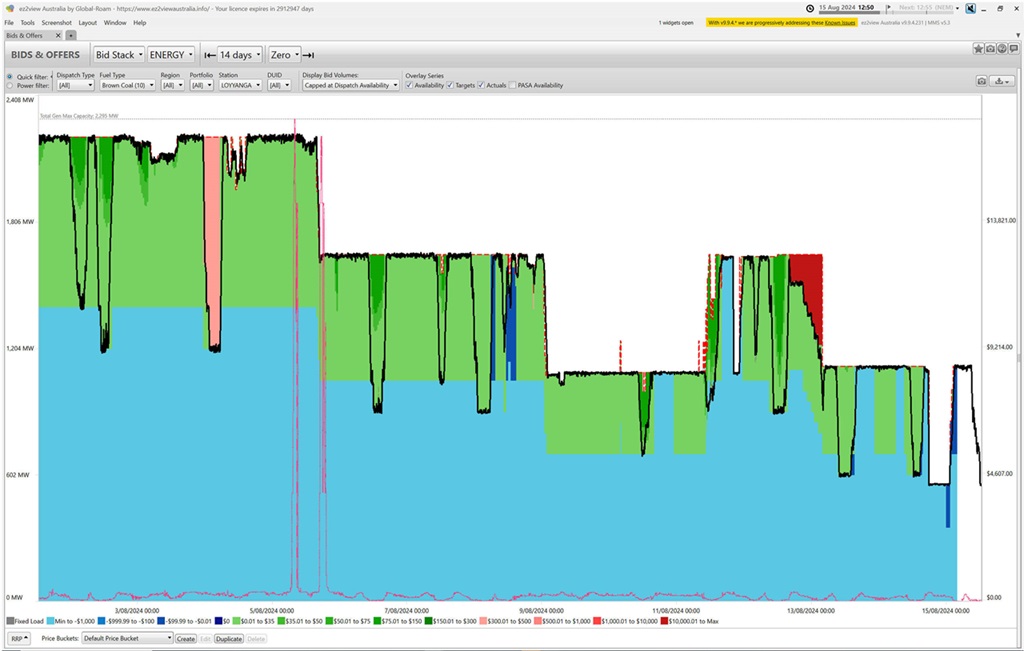
We see that the station dropped from 4 to 3 units online on Monday 5th August 2024, just prior to the second bout of volatility that day. There’s been 1, 2 or 3 units out simultaneously in the 10 days since.
https://wattclarity.com.au/articles/2024/08/15aug-loyyanga-unitsoff/
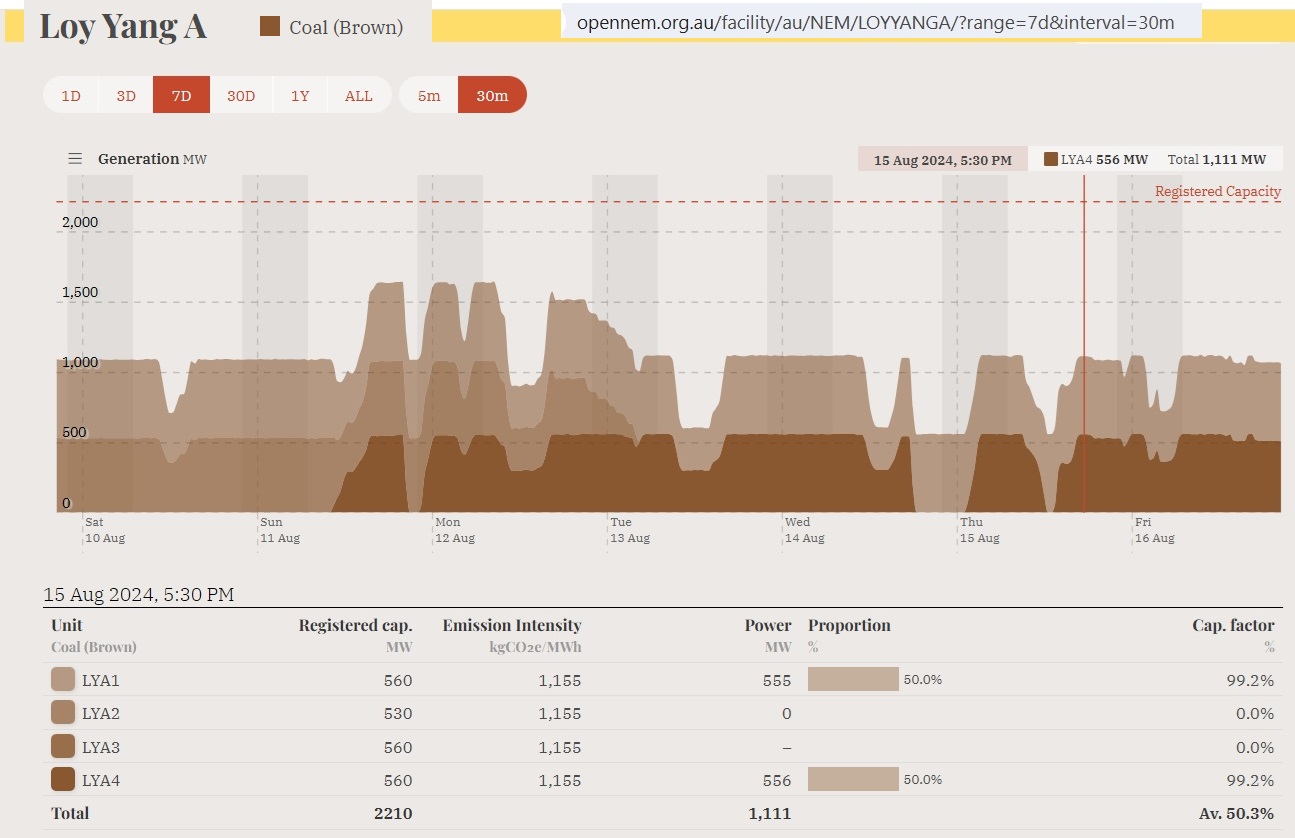
https://opennem.org.au/facility/au/NEM/LOYYANGA/?range=7d&interval=30m

Previous post:

31/7/2024
Chilly winter evenings and tight power supplies cause simultaneous price spikes in all Australian east coast States
https://crudeoilpeak.info/chilly-winter-evenings-and-tight-power-supplies-cause-simultaneous-price-spikes-in-all-australian-east-coast-states

Key data & graphs

  • Net oil importers
  • Oil Exports
  • Crude oil imports
  • Downloads
  • Latest Graphs
  • Oil price analysis
  • US drilling rig count
  • International drilling rig count
  • Australian fuel prices
  • Diary
  • International oil companies
  • US tight oil production
  • China peak oil
  • World liquids supply – demand balance
  • Tankers arriving and departing in Sydney
  • Australian oil and fuel imports

Latest posts

  • Australian fuel security update 7 Nov: Diesel cover falls by 20% to 31 days as forward fuel deliveries drop to lowest level since mid-August
  • Australian Energy Minister – Asked About Reports of Three Tankers Burning in Hormuz – Sees Only “General Uncertainty”
  • Jet fuel stocks just 2.6 days above the Minimum Stockholding Obligation as new Western Sydney Airport enthusiasm soars
  • Asia Pacific peak oil update 2025, consumption 5x higher than production
  • Australian jet fuel stock floating offshore while fuel prices are flying away
  • Australian Diesel imports in August dropped from high in May

Archives

©2026 Crude Oil Peak | Design: Newspaperly WordPress Theme