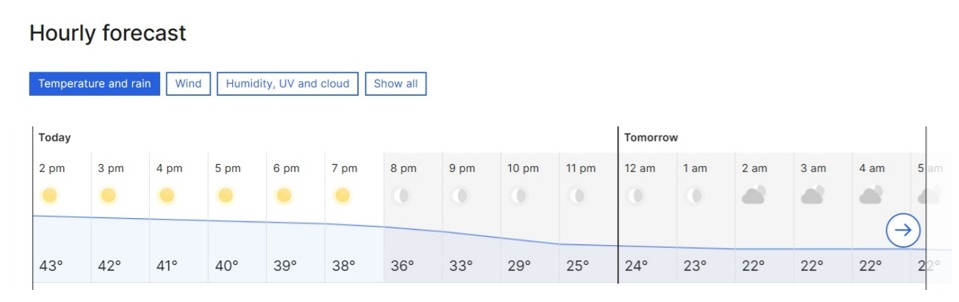
 Fig 1: Temperatures in Sydney on 10 Jan 2026
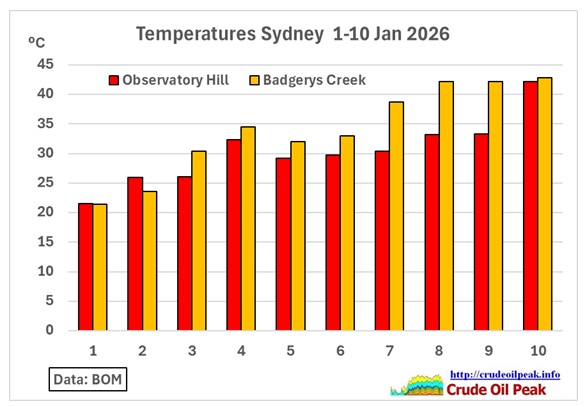
Fig 2: Temperatures in Sydney on 1 – 10 Jan 2026
Observatory Hill is in the city near the Harbour and therefore cooler. Sydney’s West is hotter. Temperatures at Badgery’s Creek, where the new 2nd Sydney airport is nearing completion, were 4 degrees higher. Instead of 1 day there were 3 days above 40 ºC. Under global warming conditions this will limit the usefulness of the airport. The approval of this project was given by Tony Abbott, a climate change denier. Good luck.
 Fig 3: NSW demand and prices, screen captured at 20:30
APC: administered price cap https://www.aemo.com.au/-/media/files/electricity/nem/security_and_reliability/dispatch/policy_and_process/guide-to-administered-pricing.pdf
Demand could have been higher had it not been a Saturday during a holiday.
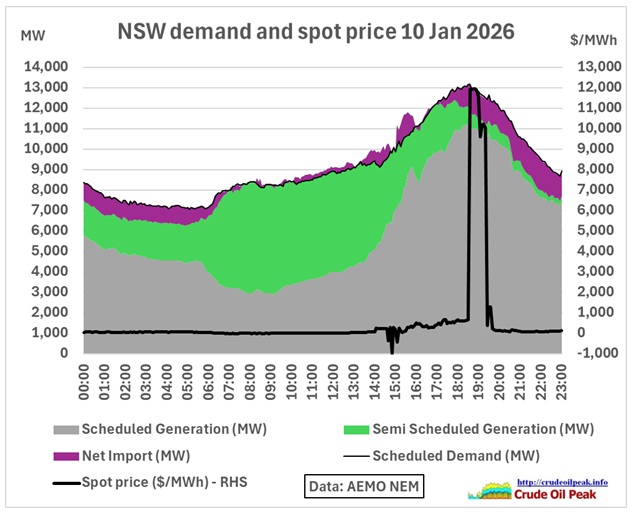 Fig 4: NSW generation, demand and prices
NSW ‘Market Demand reached 13,147MW on Saturday evening 10th January 2026
https://wattclarity.com.au/articles/2026/01/10jan-nsw-marketdemandpeak/
There were ten 5-min intervals with $11,000/MWh, each adding $38 to the average
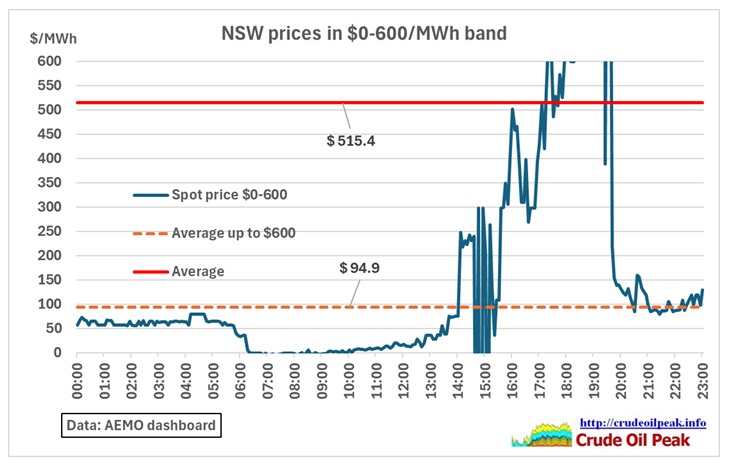 Fig 5: NSW spot prices and averages
132687 RESERVE NOTICE 10/01/2026 06:39:59 PM
Actual Lack Of Reserve Level 1 (LOR1) in the NSW region – 10/01/2026
AEMO ELECTRICITY MARKET NOTICE
Actual Lack Of Reserve Level 1 (LOR1) in the NSW region – 10/01/2026
An Actual LOR1 condition has been declared under clause 4.8.4(b) of the National Electricity Rules for the NSW region from 1830 hrs.
The Actual LOR1 condition is forecast to exist until 10/01/2026 1900 hrs
The capacity reserve requirement is 1370 MW
The minimum capacity reserve available is 1175 MW
https://www.aemo.com.au/market-notices
Cancelled at 19:10 in notice 132688
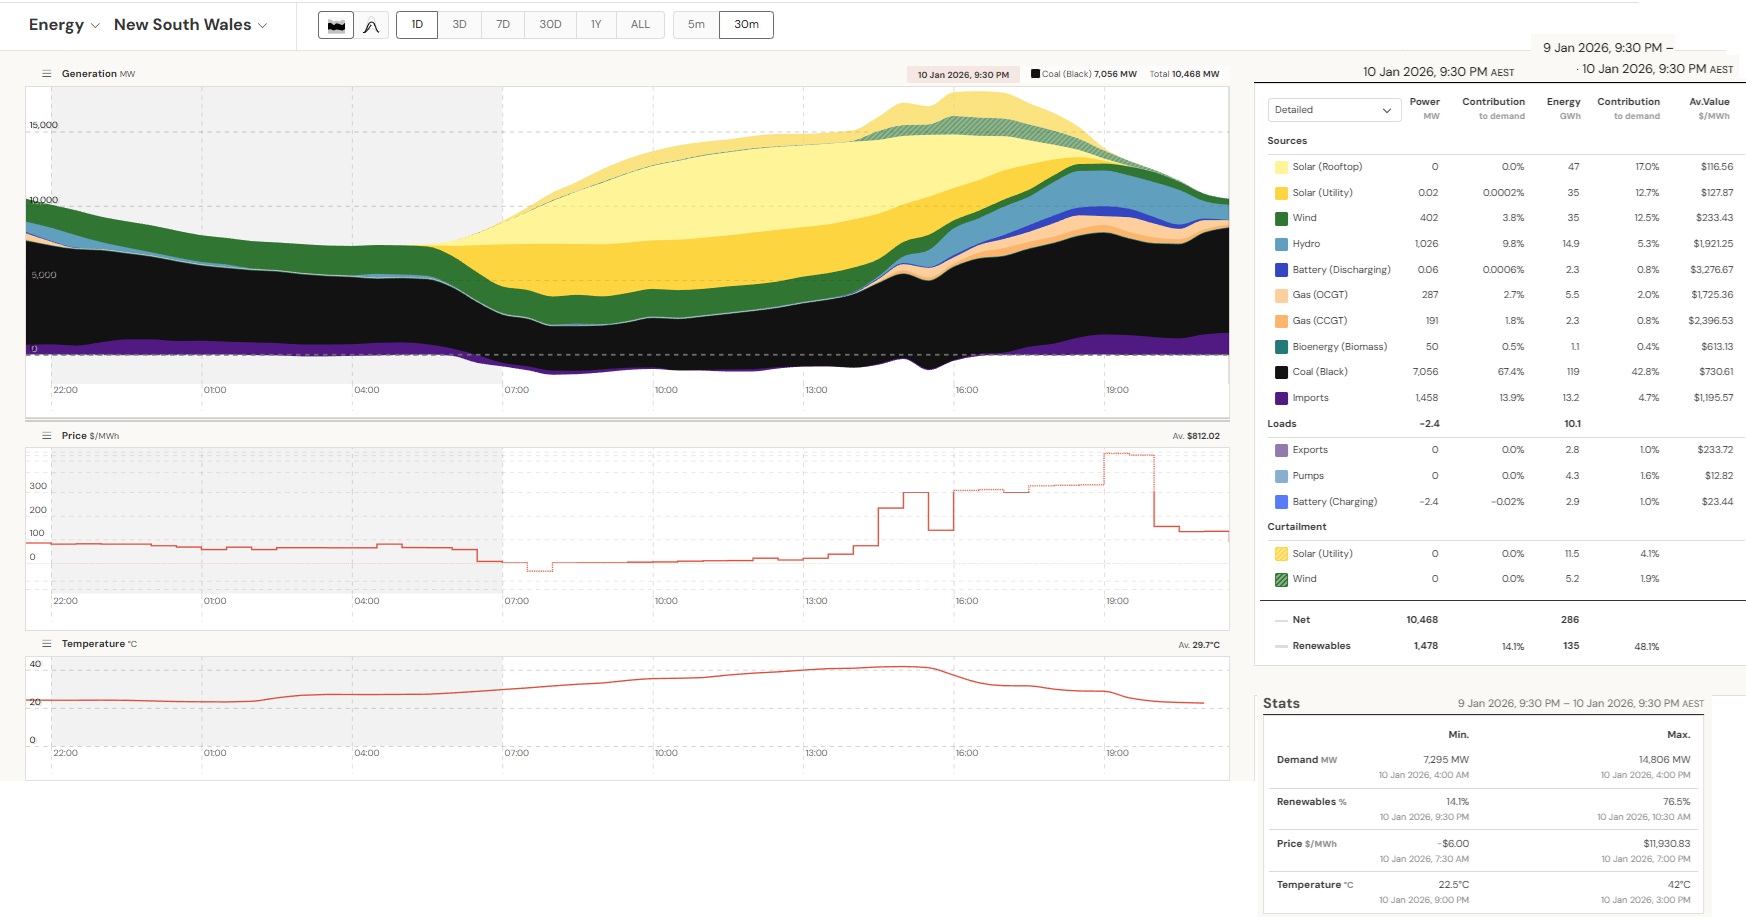 Fig 6: NSW power generation by fuel on 10 Jan 2026
Note that late in the evening at 21:30 coal generation was 7,056 MW at $730/MWh. Battery discharging cost $3,276/MWh much higher than the price of solar ($116-127/MWh) and wind ($233/MWh)
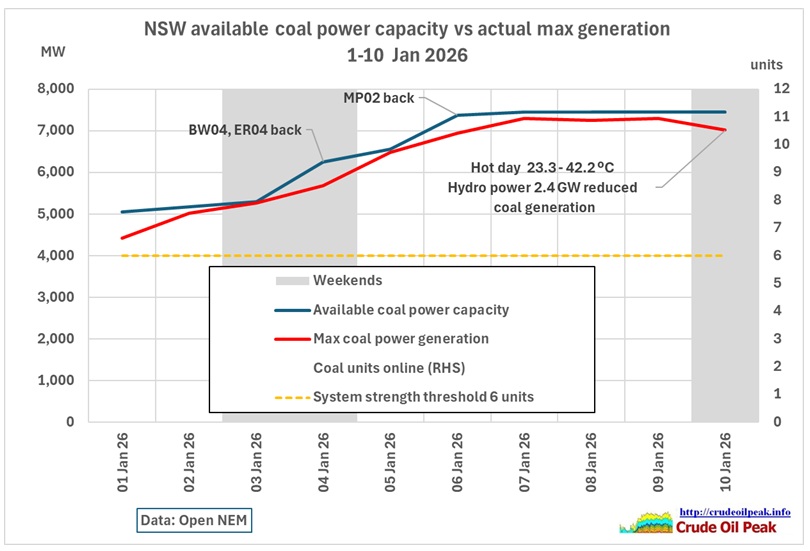 Fig 7: NSW generation from coal
3 units came back online just in time for 3 hot days. 11 (out of 12) units have a capacity of 7,470 MW which was actually used at an average of 95%. On the 10th 20:30 hrs there were 2.4 GW hydro while coal was almost maxed out at 94% of capacity, so the system managed to continue.
So how many hot days did we have in the last years?
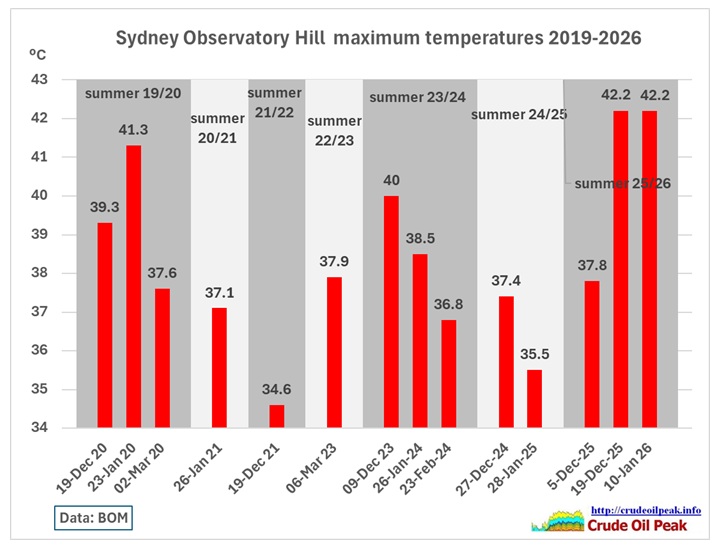 Fig 8: Sydney maximum temperatures >34 ºC
We can see:
In all 7 summers 14 days with max temps >34 ºC
In 6 summers 12 days with max temps > 36 ºC
In 3 summers 4 days with max temps >=40 ºC
Remember also that during the 2019/2020 summer we had disastrous bushfires
https://www.rfs.nsw.gov.au/resources/publications/nsw-bushfire-inquiry-report
And on that 41.3 ºC day:
Collision with terrain involving Lockheed Martin EC-130Q, N134CG 50 km north-east of Cooma-Snowy Mountains Airport (near Peak View), New South Wales, on 23 January 2020
https://www.atsb.gov.au/sites/default/files/media/5781842/ao-2020-007-final.pdf
This distracted our attention from the emerging Corona virus. On the same 23rd January 2020, a direct flight from Wuhan landed in Sydney. Thank you, CCP. They should have stopped all international flights by end December 2019
Person being tested after China Eastern Airlines flight from Wuhan arrives in Sydney
January 23, 2020
A person is being tested for the deadly coronavirus after a plane from the city at the centre of the outbreak landed in Sydney.
https://www.news.com.au/travel/travel-updates/health-safety/china-eastern-airlines-flight-from-wuhan-arrives-in-sydney/news-story/5fb3efe86240817cc1aeef15bc224569
An analysis to which extent that is already global warming, goes beyond the scope of this short post.
Conclusion:
This is not a story, not an academic exercise. Demand must not grow if this system is to survive on hot summer days. The minimum condition is that immigration comes down from its current high rates. A fine tuning is necessary so that population does no longer grow endlessly.
On 22 Dec 2025, 2 days before X’mas(!), when no one had time to look at it, the NSW government released the Sydney Plan in which it is thoughtlessly assumed that Sydney’s population will grow from 5.3 million in 2025 to 6.3 million in 2025 (+ 23 %) – overseas immigration the biggest contributor (p 11).
https://www.planning.nsw.gov.au/plans-for-your-area/the-sydney-plan
There is no chapter on power supplies. The only power station mentioned is the legacy White Bay Power station (p 41) which is now a cultural and arts centre.
“Energy” is only mentioned in this sentence: “Well designed, energy-efficient buildings, infrastructure, public spaces and precincts can help mitigate the effects of climate change and accelerate the transition to net zero emissions.” (p 36)
There is no reference to how this transition is going to work. NOTHING in the “Summary of Actions” (Appendix B)
Update:
20 Jan 2026
The country’s biggest coal-fired power station will stay open for another two years.
The Eraring plant in New South Wales was due to shut next year.
There was growing pressure for that timeline to be extended after a warning from the Australian Energy Market Operator (AEMO) that the grid was not ready, raising the threat of widespread blackouts.
What does that mean? These aging coal plants will continue until they run out of available spare parts or there are accidents where repairs are no longer financially viable. There are a lot of surprises ahead.