Categories
- Africa
- Algeria
- Angola
- Asia
- Australia
- Australia Budget
- Australia Transport
- Australian Mining
- Australian natural gas
- Australian rail
- Australian refineries
- Aviation
- BP
- BP Statistical Review
- Cars
- China
- Coal Seam Gas
- Crude oil analysis
- Debt
- Egypt
- Europe
- Feature1
- Global
- Hormuz
- India
- Iran
- Iraq
- Japan
- Korea
- Kuwait
- Latin America
- Libya
- Malaysia
- Middle East
- Motorways
- New South Wales
- North Sea
- OPEC
- Peaky Leaks
- Persian Gulf
- Power Supply
- Qatar
- Russia
- Saudi Arabia
- Shale gas
- Shell
- Shipping
- Singapore
- South East Asia
- Sudan
- Sydney
- Sydney Metros
- Syria
- Taiwan
- Tony Abbott Australian PM
- Ukraine
- United Arab Emirates
- United Kingdom
- United States
- Venezuela
- Vietnam
Sidebar menu
- Net oil importers
- Oil Exports
- Crude oil imports
- Downloads
- Latest Graphs
- Oil price analysis
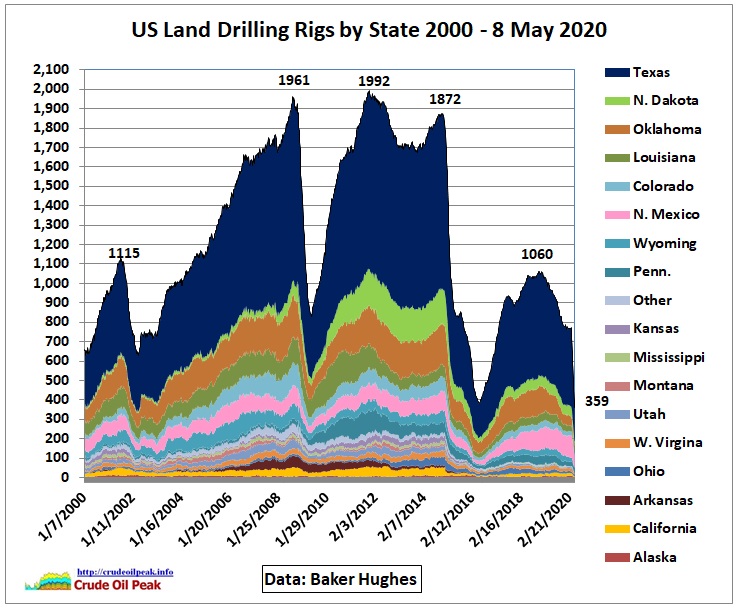 US drilling rig count
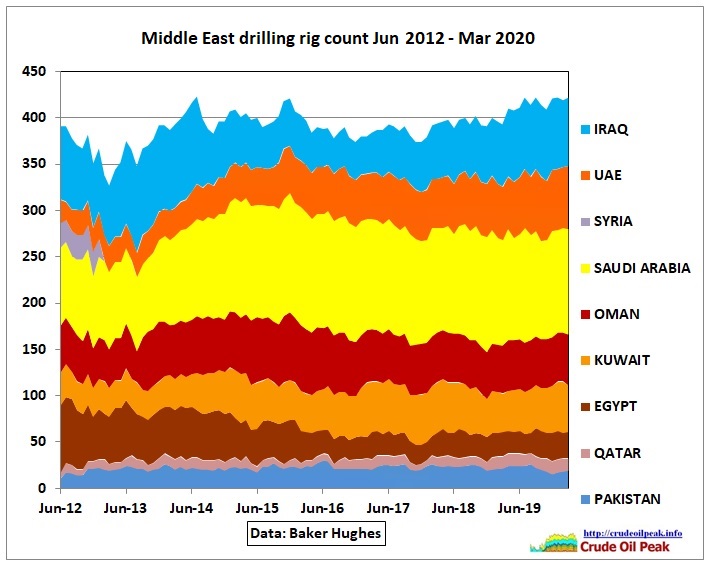 International drilling rig count
- Australian fuel prices
- Diary
- International oil companies
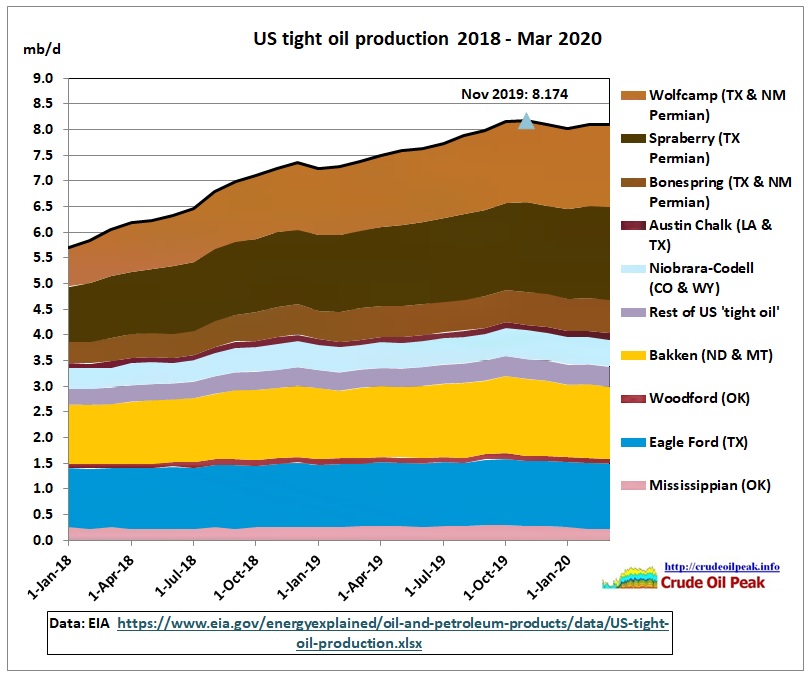 US tight oil production
 China peak oil
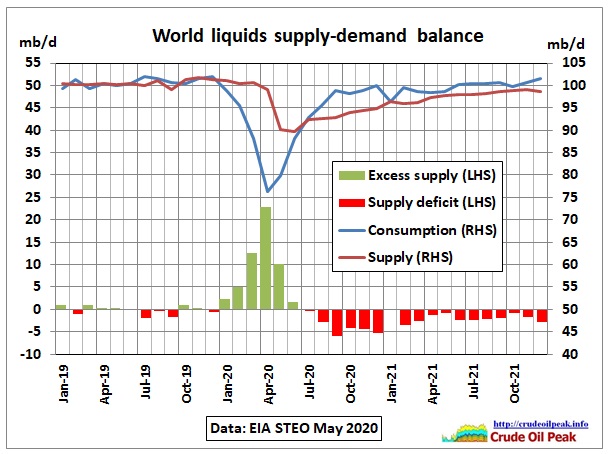 World liquids supply – demand balance
 Tankers arriving and departing in Sydney
 Australian oil and fuel imports
-
Crude oil analysis Archive
-
![Update on incremental world crude and condensate oil production Oct 2024 What happened to peak oil after conventional crude oil started to peak in 2005 at 74 mb/d? Here is […]](https://crudeoilpeak.info/wp-content/uploads/Incremental-crude-2004-Oct2024.jpg "US shale oil seems to cover up peaking crude oil production in the rest of the world since 2018")
US shale oil seems to cover up peaking crude oil production in the rest of the world since 2018
Posted on March 4, 2025 | No CommentsUpdate on incremental world crude and condensate oil production Oct 2024 What happened to peak oil after conventional crude oil started to peak in 2005 at 74 mb/d? Here is […] -
![According to EIA data global crude & condensate production peaked in November 2018 at 84.5 mb/d. The peak was short-lived: 2 months above 83 mb/d plus 3 months above 84 […]](https://crudeoilpeak.info/wp-content/uploads/World-incremental-crude-2016-Dec2021-115x115.jpg "Will the world ever reach peak crude production of November 2018 again? (part 1)")
Will the world ever reach peak crude production of November 2018 again? (part 1)
Posted on May 3, 2022 | No CommentsAccording to EIA data global crude & condensate production peaked in November 2018 at 84.5 mb/d. The peak was short-lived: 2 months above 83 mb/d plus 3 months above 84 […] -
![In the year 2005, the global crude production curve shows a definitive kink, going horizontal for several years. This caused the 2008 oil price shock and the following financial crisis […]](https://crudeoilpeak.info/wp-content/uploads/World_crude_production_1994-Dec2018-115x115.jpg "World crude production outside US and Iraq is flat since 2005")
World crude production outside US and Iraq is flat since 2005
Posted on June 10, 2019 | No CommentsIn the year 2005, the global crude production curve shows a definitive kink, going horizontal for several years. This caused the 2008 oil price shock and the following financial crisis […] -
![The IEA (in Paris) proudly announced in its latest September 2018 Monthly Oil Market Report that global supplies (of liquids) have reached 100 mb/d in August, an impressive figure. What […]](https://crudeoilpeak.info/wp-content/uploads/World_crude_production_1994-May2018-1-115x115.jpg "What happened to crude oil production after the first peak in 2005?")
What happened to crude oil production after the first peak in 2005?
Posted on September 18, 2018 | No CommentsThe IEA (in Paris) proudly announced in its latest September 2018 Monthly Oil Market Report that global supplies (of liquids) have reached 100 mb/d in August, an impressive figure. What […] -
![In yesterday’s 7 pm news ABC TV business presenter Alan Kohler got carried away with the news that the US drilling rig count increased by 2 rigs in the last […]](https://crudeoilpeak.info/wp-content/uploads/Stability_USD_2011-2016-115x115.jpg "Australian public broadcaster a true believer in US shale oil supremacy")
Australian public broadcaster a true believer in US shale oil supremacy
Posted on September 27, 2016 | No CommentsIn yesterday’s 7 pm news ABC TV business presenter Alan Kohler got carried away with the news that the US drilling rig count increased by 2 rigs in the last […] -
![OPEC Fig 1: OPEC’s incremental crude oil production Incremental production for each country is the production above the minimum production for the period Jan 2000 – May 2016 (the latest […]](https://crudeoilpeak.info/wp-content/uploads/World_Incremental_crude_production_2000-May2016-115x115.jpg "Incremental crude production update August 2016")
Incremental crude production update August 2016
Posted on September 11, 2016 | No CommentsOPEC Fig 1: OPEC’s incremental crude oil production Incremental production for each country is the production above the minimum production for the period Jan 2000 – May 2016 (the latest […] -
![After a delay of several months the US Energy Information Administration has published the latest international energy statistics for October 2015 This is an opportunity to update crude oil graphs […]](https://crudeoilpeak.info/wp-content/uploads/2016/02/Incremental_crude_world_growth_decline_OPEC_US_Canada_2001_Oct2015-115x115.jpg "World outside US and Canada doesn’t produce more crude oil than in 2005")
World outside US and Canada doesn’t produce more crude oil than in 2005
Posted on February 14, 2016 | No CommentsAfter a delay of several months the US Energy Information Administration has published the latest international energy statistics for October 2015 This is an opportunity to update crude oil graphs […] -
![The media is full with news that there is a global oil glut. There are now more than 3bn barrels of excess oil in the world 13/11/2015 http://www.telegraph.co.uk/finance/oilprices/11993687/There-are-now-more-than-3bn-barrels-of-excess-oil-in-the-world.html Record oil […]](https://crudeoilpeak.info/wp-content/uploads/2015/12/OECD_stock_change_Dec2015_by_fuel_region-115x115.jpg "Where actually is that much-hyped global oil glut?")
Where actually is that much-hyped global oil glut?
Posted on December 29, 2015 | No CommentsThe media is full with news that there is a global oil glut. There are now more than 3bn barrels of excess oil in the world 13/11/2015 http://www.telegraph.co.uk/finance/oilprices/11993687/There-are-now-more-than-3bn-barrels-of-excess-oil-in-the-world.html Record oil […] -
![According to EIA data, monthly US crude oil production peaked in April 2015 at 9.6 mb/d. Fig 1: US crude oil production to June 2015 http://www.eia.gov/dnav/pet/pet_crd_crpdn_adc_mbblpd_m.htm The above graph shows […]](https://crudeoilpeak.info/wp-content/uploads/2015/09/US_crude_production_Jan2007-Jun2015_EIA-115x115.jpg "US shale oil too expensive, peaks 1H 2015")
US shale oil too expensive, peaks 1H 2015
Posted on September 30, 2015 | No CommentsAccording to EIA data, monthly US crude oil production peaked in April 2015 at 9.6 mb/d. Fig 1: US crude oil production to June 2015 http://www.eia.gov/dnav/pet/pet_crd_crpdn_adc_mbblpd_m.htm The above graph shows […] -
![The International Energy Agency’s Medium Term Oil Market Report 2015 included an interesting graph showing changes in US and Russian oil production for the next 5 years: IEA MTOMR February […]](https://crudeoilpeak.info/wp-content/uploads/2015/03/US_crude_and_NGL_production_2009_2020_IEA_MTOMR_2015-115x115.jpg "IEA report: US shale oil growth practically zero in 2017")
IEA report: US shale oil growth practically zero in 2017
Posted on March 3, 2015 | No CommentsThe International Energy Agency’s Medium Term Oil Market Report 2015 included an interesting graph showing changes in US and Russian oil production for the next 5 years: IEA MTOMR February […]