Categories
- Africa
- Algeria
- Angola
- Asia
- Australia
- Australia Budget
- Australia Transport
- Australian Mining
- Australian natural gas
- Australian rail
- Australian refineries
- Aviation
- BP
- BP Statistical Review
- Cars
- China
- Coal Seam Gas
- Crude oil analysis
- Debt
- Egypt
- Europe
- Feature1
- Global
- Hormuz
- India
- Iran
- Iraq
- Japan
- Korea
- Kuwait
- Latin America
- Libya
- Malaysia
- Middle East
- Motorways
- New South Wales
- North Sea
- OPEC
- Peaky Leaks
- Persian Gulf
- Power Supply
- Qatar
- Russia
- Saudi Arabia
- Shale gas
- Shell
- Shipping
- Singapore
- South East Asia
- Sudan
- Sydney
- Sydney Metros
- Syria
- Taiwan
- Tony Abbott Australian PM
- Ukraine
- United Arab Emirates
- United Kingdom
- United States
- Venezuela
- Vietnam
Sidebar menu
- Net oil importers
- Oil Exports
- Crude oil imports
- Downloads
- Latest Graphs
- Oil price analysis
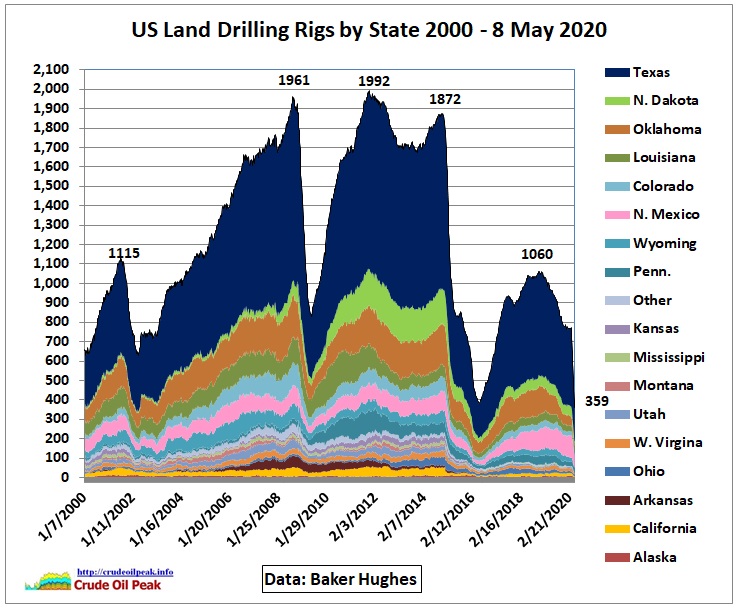 US drilling rig count
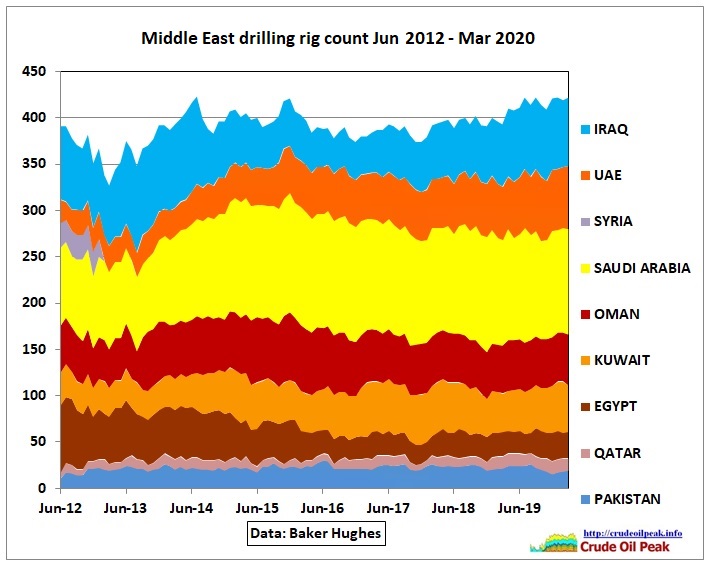 International drilling rig count
- Australian fuel prices
- Diary
- International oil companies
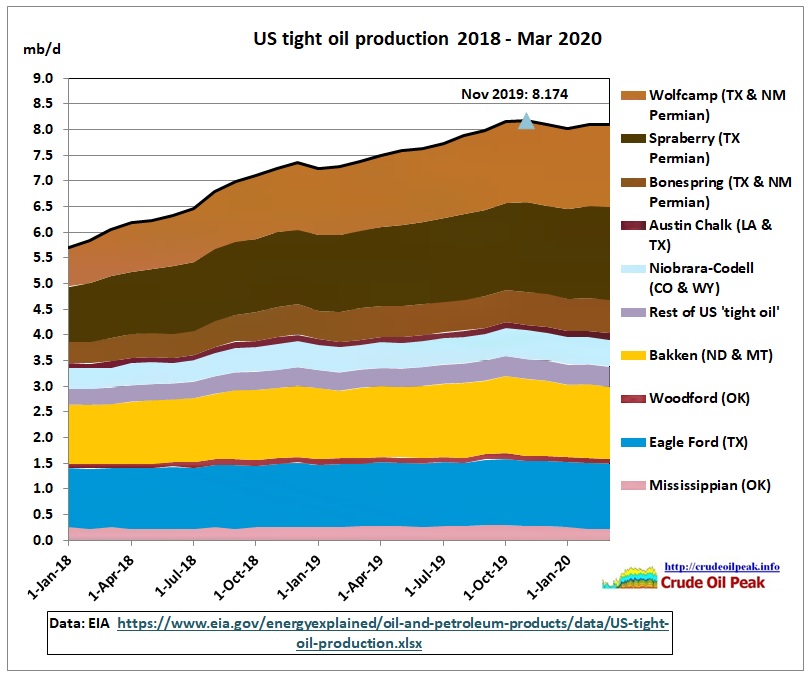 US tight oil production
 China peak oil
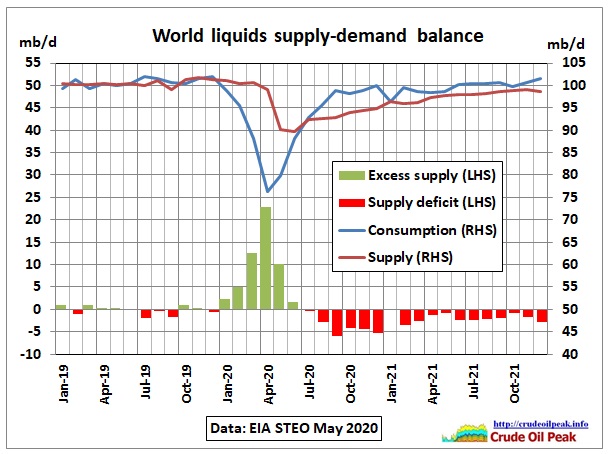 World liquids supply – demand balance
 Tankers arriving and departing in Sydney
 Australian oil and fuel imports
-
Global Archive
-
![This is the continuation of part 1 https://crudeoilpeak.info/nsw-power-generation-curves-lack-of-reserves-and-intervention-notices-september-2025-part1 Sample generation graphs from NEM Fig 15: High use of coal in cool spring night with little wind On 12-13 September (Fri-Sat) […]](https://crudeoilpeak.info/wp-content/uploads/NSW-12-13Sep25.jpg "NSW power generation curves, lack of reserves and intervention notices September 2025 (part 2)")
NSW power generation curves, lack of reserves and intervention notices September 2025 (part 2)
Posted on October 21, 2025 | No CommentsThis is the continuation of part 1 https://crudeoilpeak.info/nsw-power-generation-curves-lack-of-reserves-and-intervention-notices-september-2025-part1 Sample generation graphs from NEM Fig 15: High use of coal in cool spring night with little wind On 12-13 September (Fri-Sat) […] -
![This is part 2 of the previous post of 4 Mar 2025 https://crudeoilpeak.info/us-shale-oil-seems-to-cover-up-peaking-crude-oil-production-in-the-rest-of-the-world-since-2018 In this post we focus on the period 2016 – Oct 2024 This is a graph showing […]](https://crudeoilpeak.info/wp-content/uploads/Incremental-crude-Jun2020-Nov2024.jpg "Post-Covid crude production in world outside the US still lower than end 2018")
Post-Covid crude production in world outside the US still lower than end 2018
Posted on March 25, 2025 | No CommentsThis is part 2 of the previous post of 4 Mar 2025 https://crudeoilpeak.info/us-shale-oil-seems-to-cover-up-peaking-crude-oil-production-in-the-rest-of-the-world-since-2018 In this post we focus on the period 2016 – Oct 2024 This is a graph showing […] -
![Update on incremental world crude and condensate oil production Oct 2024 What happened to peak oil after conventional crude oil started to peak in 2005 at 74 mb/d? Here is […]](https://crudeoilpeak.info/wp-content/uploads/Incremental-crude-2004-Oct2024.jpg "US shale oil seems to cover up peaking crude oil production in the rest of the world since 2018")
US shale oil seems to cover up peaking crude oil production in the rest of the world since 2018
Posted on March 4, 2025 | No CommentsUpdate on incremental world crude and condensate oil production Oct 2024 What happened to peak oil after conventional crude oil started to peak in 2005 at 74 mb/d? Here is […] -
![The 2024 Statistical Review of World Energy has been published on 20 June 2024 by the Energy Institute (previously by BP) with data up to 2023. https://www.energyinst.org/statistical-review Oil production in […]](https://crudeoilpeak.info/wp-content/uploads/World-oil-crude-oil-production-1965-2023.jpg "Peak oil update 2023 – part 1 NGLs")
Peak oil update 2023 – part 1 NGLs
Posted on June 24, 2024 | No CommentsThe 2024 Statistical Review of World Energy has been published on 20 June 2024 by the Energy Institute (previously by BP) with data up to 2023. https://www.energyinst.org/statistical-review Oil production in […] -
![This is the continuation of part 1 on lack of reserves in NSW on 14 Dec 2023 https://crudeoilpeak.info/how-close-did-nsw-come-to-load-shedding-on-14-dec-2023-part-1 which culminated in: Fig 20: Actual LOR2 notice This meant that eg. […]](https://crudeoilpeak.info/wp-content/uploads/NSW-power-imports-14Dec2023.jpg "How close did NSW come to load shedding on 14 Dec 2023? (part 2)")
How close did NSW come to load shedding on 14 Dec 2023? (part 2)
Posted on December 21, 2023 | No CommentsThis is the continuation of part 1 on lack of reserves in NSW on 14 Dec 2023 https://crudeoilpeak.info/how-close-did-nsw-come-to-load-shedding-on-14-dec-2023-part-1 which culminated in: Fig 20: Actual LOR2 notice This meant that eg. […] -
![Empty roads, grounded aircraft, falling tourist and international student numbers, plunging car sales, empty super market shelves, disrupted supply chains… Fig 1: Empty roads in Wuhan in February 2020 China […]](https://crudeoilpeak.info/wp-content/uploads/Wuhan-20Feb2020-115x115.jpg "Impact of Corona Virus similar to some earlier peak oil scenarios")
Impact of Corona Virus similar to some earlier peak oil scenarios
Posted on March 10, 2020 | No CommentsEmpty roads, grounded aircraft, falling tourist and international student numbers, plunging car sales, empty super market shelves, disrupted supply chains… Fig 1: Empty roads in Wuhan in February 2020 China […] -
![In part 1 we had a summary table comparing Rystad’s 1P (proven reserves), 2P (proven + probable reserves) and 2PC (2P reserves + mean contingent) for all countries outside the […]](https://crudeoilpeak.info/wp-content/uploads/Oil-consumption_1965-2018-115x115.jpg "Uncertainties following the Abqaiq attack have shrunk the world’s safe oil reserves by around half (part 2)")
Uncertainties following the Abqaiq attack have shrunk the world’s safe oil reserves by around half (part 2)
Posted on October 24, 2019 | No CommentsIn part 1 we had a summary table comparing Rystad’s 1P (proven reserves), 2P (proven + probable reserves) and 2PC (2P reserves + mean contingent) for all countries outside the […] -
![Fig 1: The attackers hit at Fajr prayer time https://www.youtube.com/watch?v=sw_IwRPUZOQ When the late Houston based investment banker Matt Simmons wrote his 2005 book “Twilight in the desert, the coming Saudi […]](https://crudeoilpeak.info/wp-content/uploads/Abqaiq-attack-prayer-time-115x115.jpg "The Attacks on Abqaiq and Peak oil in Ghawar")
The Attacks on Abqaiq and Peak oil in Ghawar
Posted on October 1, 2019 | No CommentsFig 1: The attackers hit at Fajr prayer time https://www.youtube.com/watch?v=sw_IwRPUZOQ When the late Houston based investment banker Matt Simmons wrote his 2005 book “Twilight in the desert, the coming Saudi […] -
![This post is an update of a graph done in 2015: Fig 1: Conventional oil production on bumpy plateau 2005-2014 In http://crudeoilpeak.info/latest-graphs When adding the new data for 2015-2018 it […]](https://crudeoilpeak.info/wp-content/uploads/World_conv-crude_plateau_2005-2018-115x115.jpg "2005-2018 Conventional crude production on a bumpy plateau – with a little help from Iraq")
2005-2018 Conventional crude production on a bumpy plateau – with a little help from Iraq
Posted on August 26, 2019 | No CommentsThis post is an update of a graph done in 2015: Fig 1: Conventional oil production on bumpy plateau 2005-2014 In http://crudeoilpeak.info/latest-graphs When adding the new data for 2015-2018 it […] -
![In the year 2005, the global crude production curve shows a definitive kink, going horizontal for several years. This caused the 2008 oil price shock and the following financial crisis […]](https://crudeoilpeak.info/wp-content/uploads/World_crude_production_1994-Dec2018-115x115.jpg "World crude production outside US and Iraq is flat since 2005")
World crude production outside US and Iraq is flat since 2005
Posted on June 10, 2019 | No CommentsIn the year 2005, the global crude production curve shows a definitive kink, going horizontal for several years. This caused the 2008 oil price shock and the following financial crisis […]