Categories
- Africa
- Algeria
- Angola
- Asia
- Australia
- Australia Budget
- Australia Transport
- Australian Mining
- Australian natural gas
- Australian rail
- Australian refineries
- Aviation
- BP
- BP Statistical Review
- Cars
- China
- Coal Seam Gas
- Crude oil analysis
- Debt
- Egypt
- Europe
- Feature1
- Global
- Hormuz
- India
- Iran
- Iraq
- Japan
- Korea
- Kuwait
- Latin America
- Libya
- Malaysia
- Middle East
- Motorways
- New South Wales
- North Sea
- OPEC
- Peaky Leaks
- Persian Gulf
- Power Supply
- Qatar
- Russia
- Saudi Arabia
- Shale gas
- Shell
- Shipping
- Singapore
- South East Asia
- Sudan
- Sydney
- Sydney Metros
- Syria
- Taiwan
- Tony Abbott Australian PM
- Ukraine
- United Arab Emirates
- United Kingdom
- United States
- Venezuela
- Vietnam
Sidebar menu
- Net oil importers
- Oil Exports
- Crude oil imports
- Downloads
- Latest Graphs
- Oil price analysis
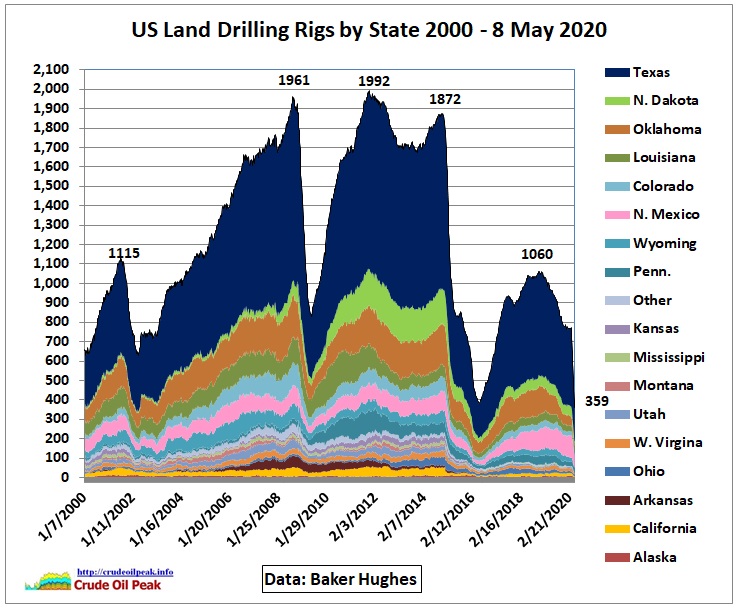 US drilling rig count
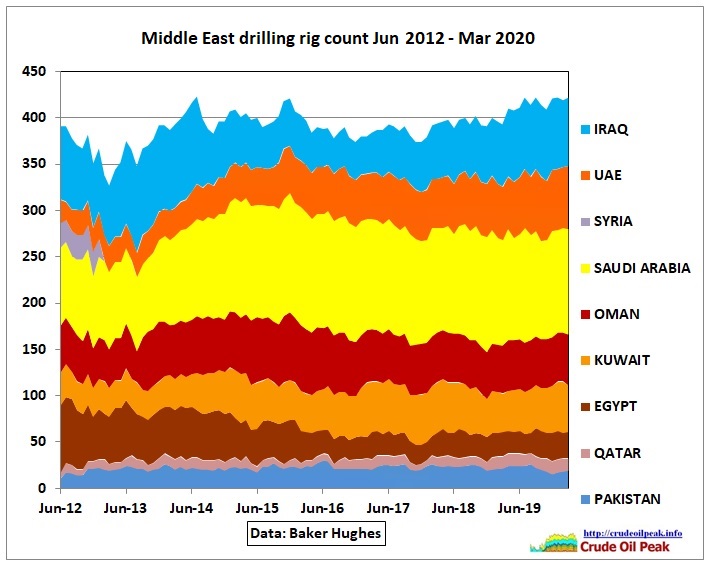 International drilling rig count
- Australian fuel prices
- Diary
- International oil companies
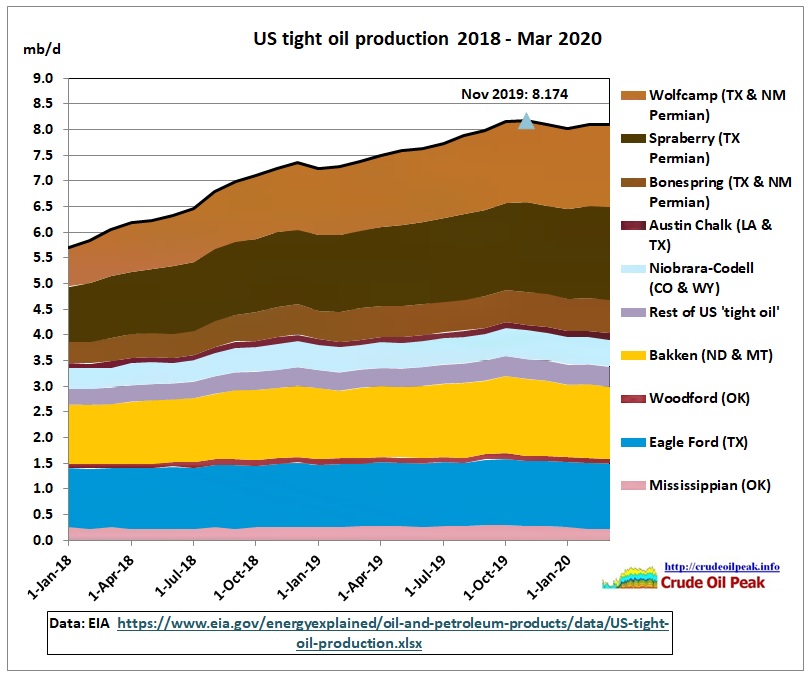 US tight oil production
 China peak oil
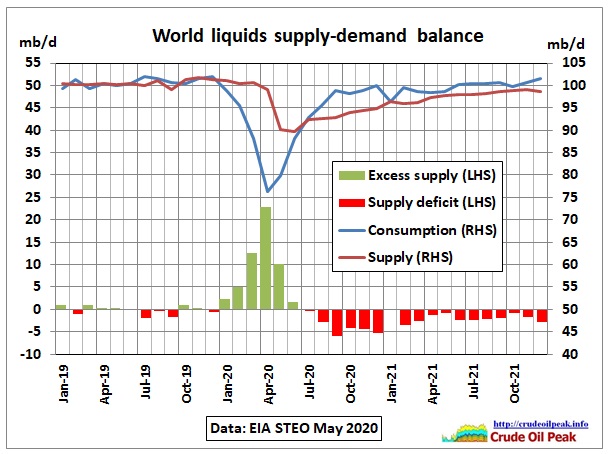 World liquids supply – demand balance
 Tankers arriving and departing in Sydney
 Australian oil and fuel imports
-
United States Archive
-
![This post turns information given to the media into easily understandable time line graphs. It includes implied and inconvenient facts the Energy Minister did not mention in: Press conference – […]](https://crudeoilpeak.info/wp-content/uploads/Australian-fuel-orders-excl-extra-4Apr-16May-2026.jpg "Australian forward fuel orders dropped by 12 % from previous week")
Australian forward fuel orders dropped by 12 % from previous week
Posted on May 18, 2026 | No CommentsThis post turns information given to the media into easily understandable time line graphs. It includes implied and inconvenient facts the Energy Minister did not mention in: Press conference – […] -
![Remember this: 15/4/26 ABC News finance report, including a picture of the “armada” of diesel tankers heading for Australia: Fig 1: Diesel Armada heading for Australia https://www.abc.net.au/news/2026-04-15/wednesday-finance-with-alan-kohler/106568156 Just as NORD […]](https://crudeoilpeak.info/wp-content/uploads/Diesel-tankers-from-US-Apr-May26.jpg "Alan Kohler’s Diesel Armada has hit Sydney")
Alan Kohler’s Diesel Armada has hit Sydney
Posted on April 22, 2026 | No CommentsRemember this: 15/4/26 ABC News finance report, including a picture of the “armada” of diesel tankers heading for Australia: Fig 1: Diesel Armada heading for Australia https://www.abc.net.au/news/2026-04-15/wednesday-finance-with-alan-kohler/106568156 Just as NORD […] -
![This is part 2 of the previous post of 4 Mar 2025 https://crudeoilpeak.info/us-shale-oil-seems-to-cover-up-peaking-crude-oil-production-in-the-rest-of-the-world-since-2018 In this post we focus on the period 2016 – Oct 2024 This is a graph showing […]](https://crudeoilpeak.info/wp-content/uploads/Incremental-crude-Jun2020-Nov2024.jpg "Post-Covid crude production in world outside the US still lower than end 2018")
Post-Covid crude production in world outside the US still lower than end 2018
Posted on March 25, 2025 | No CommentsThis is part 2 of the previous post of 4 Mar 2025 https://crudeoilpeak.info/us-shale-oil-seems-to-cover-up-peaking-crude-oil-production-in-the-rest-of-the-world-since-2018 In this post we focus on the period 2016 – Oct 2024 This is a graph showing […] -
![Update on incremental world crude and condensate oil production Oct 2024 What happened to peak oil after conventional crude oil started to peak in 2005 at 74 mb/d? Here is […]](https://crudeoilpeak.info/wp-content/uploads/Incremental-crude-2004-Oct2024.jpg "US shale oil seems to cover up peaking crude oil production in the rest of the world since 2018")
US shale oil seems to cover up peaking crude oil production in the rest of the world since 2018
Posted on March 4, 2025 | No CommentsUpdate on incremental world crude and condensate oil production Oct 2024 What happened to peak oil after conventional crude oil started to peak in 2005 at 74 mb/d? Here is […] -
![The US exported 4.2 mb/d of crude oil in the last 12 months to August 2024. Exports have substantially increased after an export ban ended in December 2015. Flashback: This […]](https://crudeoilpeak.info/wp-content/uploads/US-crude-exports_2014-Aug2024.jpg "US crude oil exports 2014 to August 2024")
US crude oil exports 2014 to August 2024
Posted on November 19, 2024 | No CommentsThe US exported 4.2 mb/d of crude oil in the last 12 months to August 2024. Exports have substantially increased after an export ban ended in December 2015. Flashback: This […] -
![This post is a continuation of part 1 https://crudeoilpeak.info/us-crude-oil-imports-by-gravity-and-country-of-origin-part-1 All data are from this website: http://www.eia.gov/dnav/pet/pet_move_impcus_a2_nus_epc0_im0_mbblpd_m.htm Fig 10: US imports from Africa US crude imports from Africa declined dramatically between […]](https://crudeoilpeak.info/wp-content/uploads/US-crude-imports-top15-excl-Canada-Aug2024.jpg "US crude oil imports by gravity and country of origin (part 2)")
US crude oil imports by gravity and country of origin (part 2)
Posted on November 14, 2024 | No CommentsThis post is a continuation of part 1 https://crudeoilpeak.info/us-crude-oil-imports-by-gravity-and-country-of-origin-part-1 All data are from this website: http://www.eia.gov/dnav/pet/pet_move_impcus_a2_nus_epc0_im0_mbblpd_m.htm Fig 10: US imports from Africa US crude imports from Africa declined dramatically between […] -
![Despite a boom in shale oil production, the US is still importing 6.6 mb/d of crude oil. while also exporting 4.2 mb/d, resulting in a net import of 2.4 mb […]](https://crudeoilpeak.info/wp-content/uploads/US-crude-imports_1965-Aug2024.jpg "US crude oil imports by gravity and country of origin (part 1)")
US crude oil imports by gravity and country of origin (part 1)
Posted on November 14, 2024 | No CommentsDespite a boom in shale oil production, the US is still importing 6.6 mb/d of crude oil. while also exporting 4.2 mb/d, resulting in a net import of 2.4 mb […] -
![The 2024 Statistical Review of World Energy has been published on 20 June 2024 by the Energy Institute (previously by BP) with data up to 2023. https://www.energyinst.org/statistical-review Oil production in […]](https://crudeoilpeak.info/wp-content/uploads/World-oil-crude-oil-production-1965-2023.jpg "Peak oil update 2023 – part 1 NGLs")
Peak oil update 2023 – part 1 NGLs
Posted on June 24, 2024 | No CommentsThe 2024 Statistical Review of World Energy has been published on 20 June 2024 by the Energy Institute (previously by BP) with data up to 2023. https://www.energyinst.org/statistical-review Oil production in […] -
![From the Energy Minister’s media release: Australia to boost fuel security and establish national oil reserve 22 April 2020 The Australian Government is boosting the nation’s long-term fuel security by […]](https://crudeoilpeak.info/wp-content/uploads/Strategic-Petroleum-Reserve_US-115x115.jpg "Australia outsources its oil reserve problem to the US")
Australia outsources its oil reserve problem to the US
Posted on May 22, 2020 | No CommentsFrom the Energy Minister’s media release: Australia to boost fuel security and establish national oil reserve 22 April 2020 The Australian Government is boosting the nation’s long-term fuel security by […] -
![This post is an update of a graph done in 2015: Fig 1: Conventional oil production on bumpy plateau 2005-2014 In http://crudeoilpeak.info/latest-graphs When adding the new data for 2015-2018 it […]](https://crudeoilpeak.info/wp-content/uploads/World_conv-crude_plateau_2005-2018-115x115.jpg "2005-2018 Conventional crude production on a bumpy plateau – with a little help from Iraq")
2005-2018 Conventional crude production on a bumpy plateau – with a little help from Iraq
Posted on August 26, 2019 | No CommentsThis post is an update of a graph done in 2015: Fig 1: Conventional oil production on bumpy plateau 2005-2014 In http://crudeoilpeak.info/latest-graphs When adding the new data for 2015-2018 it […]