On 2nd May the Australian Energy Minister released new data on fuel stocks, past tanker arrivals and tankers on the way.
This MSO chart was published Saturday morning
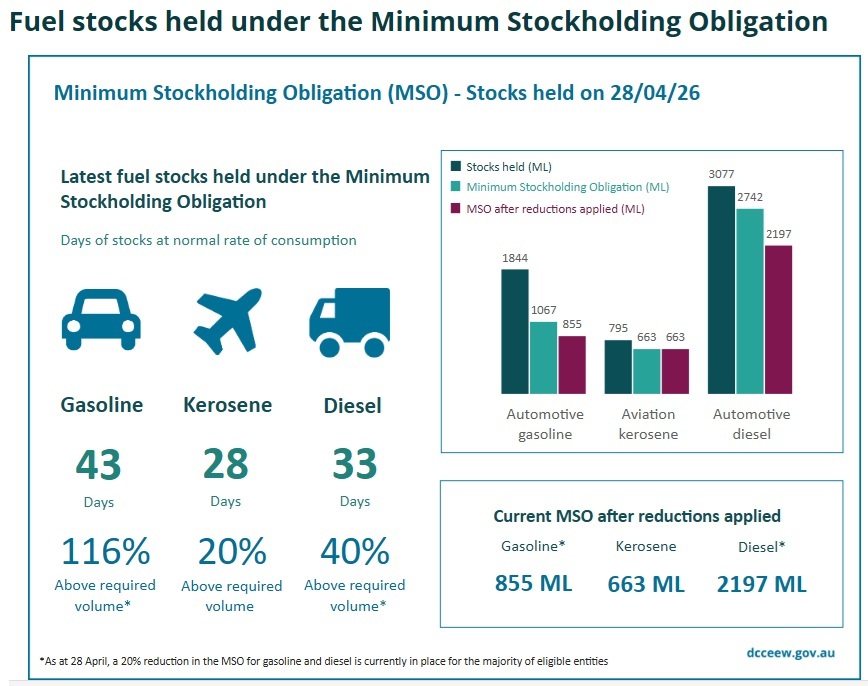 Fig 1: The weekly table provided by the Department of Energy and Climate Change
https://www.dcceew.gov.au/energy/security/australias-fuel-security/minimum-stockholding-obligation/statistics
The chart from the previous week was overwritten (as was the case in previous weeks) so that no comparison is possible (but see Fig 6). The above page is full with outdated information and without any focus or explanation of this chart.
The public messaging was given in:
ABC 7 pm news 2 May (min 7:06)
“The number of ships carrying fuel to Australia has surpassed levels recorded before the Iran war began. During April, 92 vessels carrying petrol, diesel, jet fuel arrived. In January it was 81.
4 billion litres have been secured for the next 4 weeks. The figure is down on last week but Energy Minister Bowen says supplies remain steady. However, he is warning the price of fuel will remain high while the Strait of Hormuz is closed. Bowen: It would be good if this situation is resolved because then we could get to more normal levels. It will not happen overnight, even if the Strait opened overnight we are still under strain. We are now in a position where we can say we are very well placed to weather this storm but it would be better if the storm ended”
https://iview.abc.net.au/video/NU2601H122S00 (available for 1 month)
This ABC News video clip showed this tanker
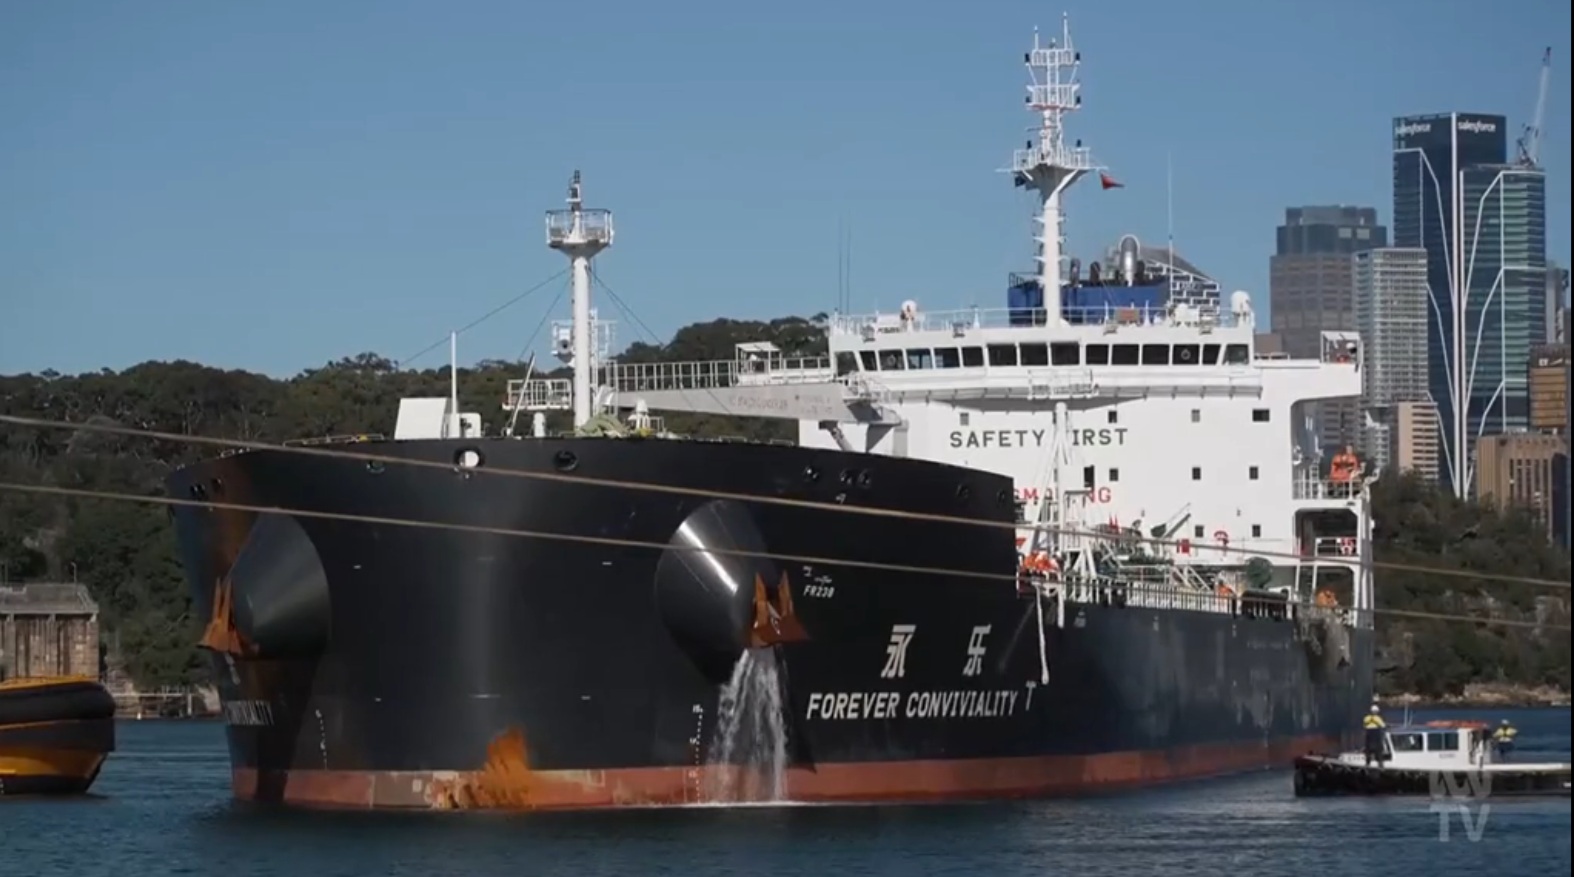 FOREVER CONVIVIALITY at Sydney’s Gore Bay jetty: 48,570 dwt, appr. 50 ML
The last time this tanker was at this jetty was on 26-28 April 26, arriving from Ulsan (South Korea) and departing for Singapore as shown here:
https://crudeoilpeak.info/tankers-arriving-and-departing-in-sydney
More details of the MSO data were given on Minster Chris Bowen’s transcripts website
Quote 1
Press conference, Sydney, New South Wales
2 May 2026
And firstly, given that we are now into May, I can tell you that over the course of April we received 92 shiploads of fuel – 92. That’s up substantially, compared to 77 in March and 81 in January. I think Australians can take confidence in the fact that fuel has continued to arrive, and in fact we have more fuel in Australia today than we did when this international crisis began. I can also report today there are 56 ships on the way to Australia with fuel.
https://minister.dcceew.gov.au/bowen/transcripts/press-conference-sydney-new-south-wales-3
“92 shiploads received in April” and a much lower “56 ships on the way”. How do these numbers work together?
Let’s put this into a graph:
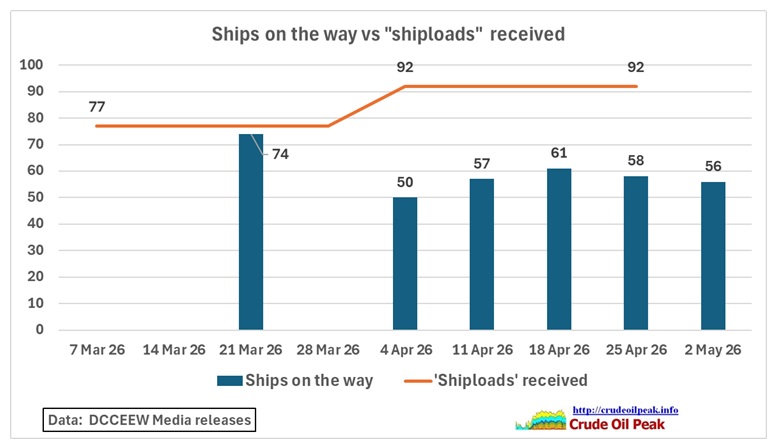 Fig 2: “Shiploads” received vs ships (tankers) on the way
The data are not consistent and can change quickly. In March:
22 March 26
Bowen: “So we get on average around 81 boats a month delivering fuel to Australia. We’re aware of six boats that have been cancelled out of that 81 on average….. if we’ve got, you know, at this point say 74 out of the 80 ships that we expect arriving over April and May”
https://minister.dcceew.gov.au/bowen/transcripts/abc-insiders-interview-david-speers
“April and May” suggests a period of 2 months. Later announcements on “ships on the way” referred to “rolling 4 weeks” (PM press conference in Sydney 18 April).
On the Prime Minister’s website itself 56 tankers at 1 May with crude oil and fuels are the equivalent to 17 days, not 4 weeks.
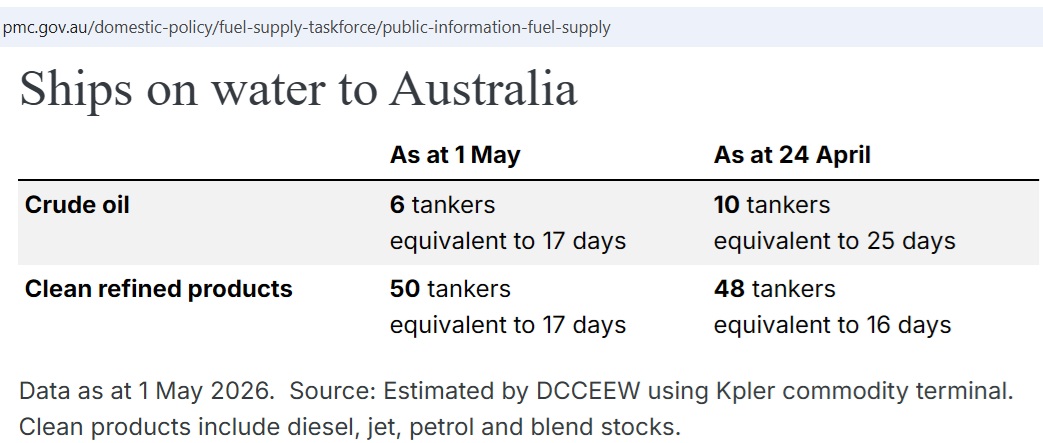 Fig: 3 Ships on water according to PM’s website (captured 6 May 2026)
https://www.pmc.gov.au/domestic-policy/fuel-supply-taskforce/public-information-fuel-supply
Here is an overview of the different sources of reporting:
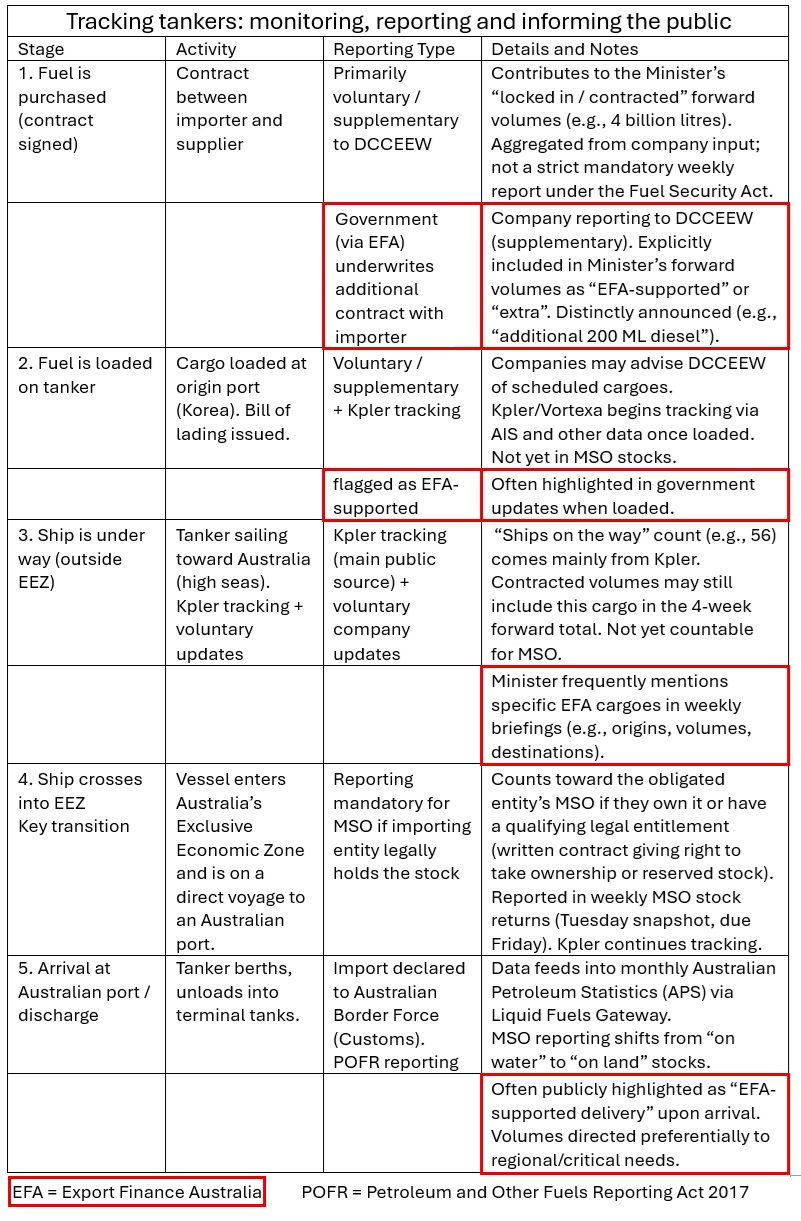 Fig 4: Tracking a tanker’s paper trail in the Australian bureaucracy
(compilation assisted by Grok AI)
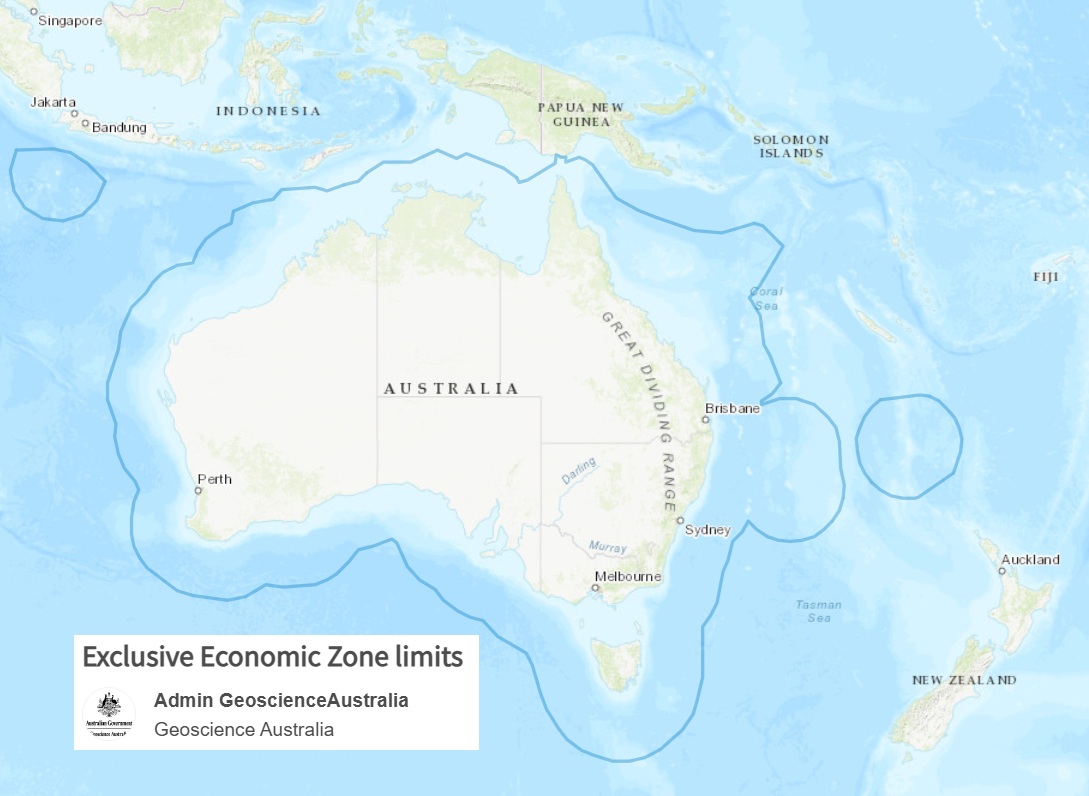 Fig 5: Australia’s EEZ
https://amsis-geoscience-au.hub.arcgis.com/datasets/geoscience-au::exclusive-economic-zone-limits/explore
We continue to look at the Ministers press conference
Quote 2
Bowen: “Our fuel stocks as they stand are that we have 43 days worth of petrol, 33 days worth of diesel and 28 days worth of jet fuel. In terms of petrol, that’s one less day than last week, steady for diesel, and two less days worth of jet fuel. But all those figures are either greater or broader consistent with what we had when the beginning- when this war began. In fact, we have seven days worth more of petrol in Australia today than we did on February 28.
I can also tell you that we have 4 billion litres of fuel locked in and contracted to be delivered to Australia over the next four weeks. That consists of 2 billion litres of diesel, 577 million litres of petrol, 516 million litres of jet fuel, and 813 million litres of crude oil.”
https://minister.dcceew.gov.au/bowen/transcripts/press-conference-sydney-new-south-wales-3
The consumption cover in days is not a very useful metric at present. Even in normal times there is a problem with measuring consumption (proxy sales):
13/4/2026
Discrepancies in diesel sales and stocks in the Australian Petroleum Statistics
https://crudeoilpeak.info/discrepancies-in-diesel-sales-and-stocks-in-the-australian-petroleum-statistics
But in the current crisis mode, consumption is changing often. It is better just to look at the stocks in ML.
The focus on this website so far was diesel because this is the most important fuel in our economy. Weekly MSO reporting started 3 March 2026
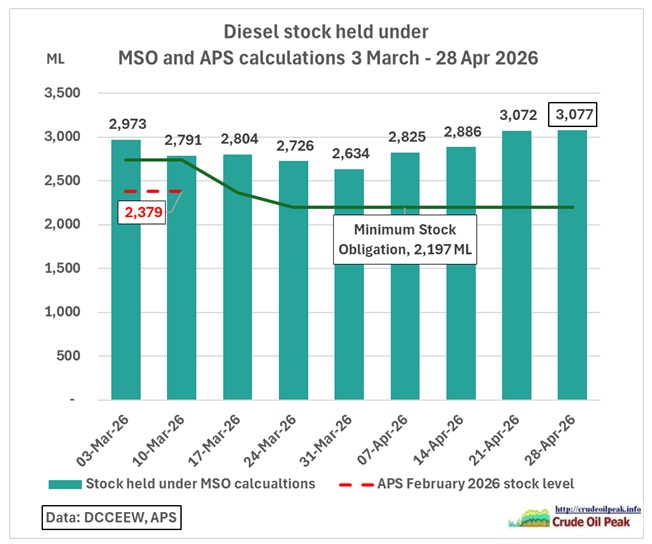 Fig 6: Timeline of diesel stock held: steady since last week
Such a timeline should actually be provided on the MSO website. As this crisis will go on for months, who will keep an overview of all these charts.
As we can see diesel stocks went down in March but then miraculously recovered in April to a level a bit higher than at the beginning of the crisis (appr. 2 Medium range tankers at 50 ML each)
Let’s look at all fuel stock and compare it with those magic shiploads
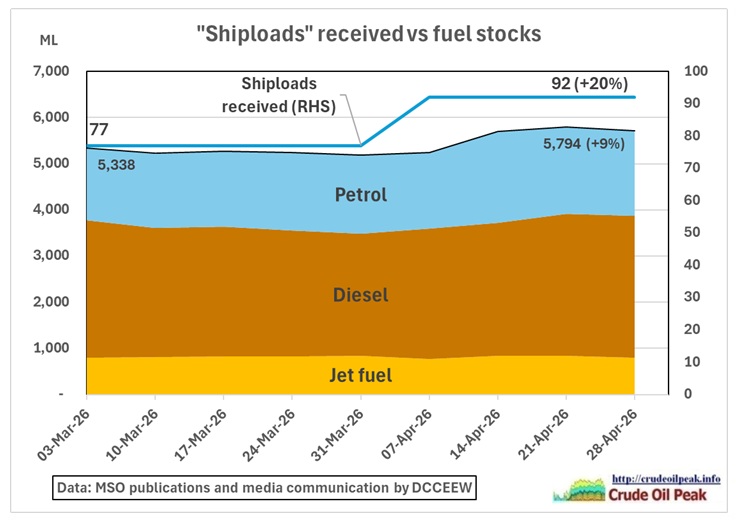 Fig 7: Number of shiploads compared to fuel stock
Stock levels are remarkably flat or have even increased (especially petrol) by 9%. But in order to achieve this outcome the number of shiploads has increased by 20%. This means the size of cargos has gone down, indicating it has become harder to get fuel into Australia.
Note that crude oil is converted to fuel equivalents. This should not be done and crude oil has to be shown separately because it has a different risk profile compared to fuel imports. Australian crude imports to not pass Hormuz or Bab Al-Mandeb. Also events like the Geelong refinery get buried in the numbers.
Note also that a single tanker can generate several shiploads at
• multiple ports
• more than 1 berth at the same port after a shift
• discharging different products
These are called milk-runs which require smoothly working logistics. But there are signs that tankers have to wait for slots and even compete with other bulk cargos like at berth K2 and K3 in Newcastle.
Hopefully there is no double counting.
Quote 3
Bowen: “….And of course, during the week, we announced more Export Finance Australia supported cargo deliveries. We now have 450 million litres of diesel and 100 million litres of jet fuel – over and above the normal supply – locked in, supported by the Albanese Government, procured, to give that extra buffer…..”
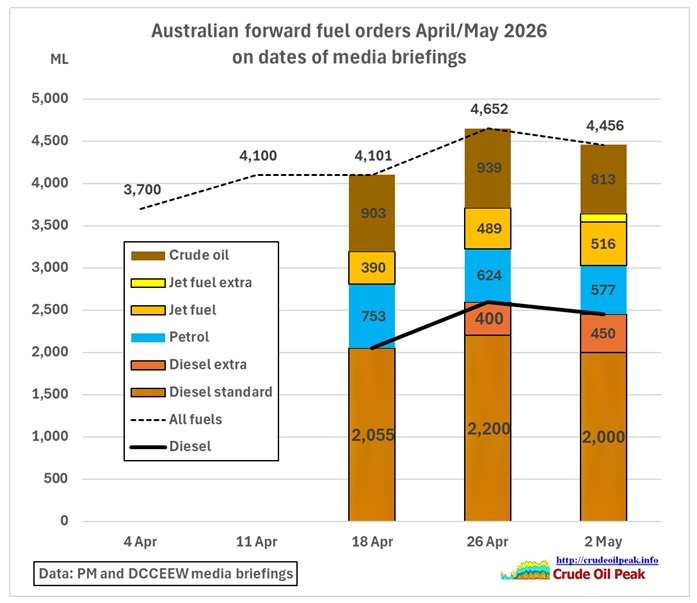 Fig 8: Fuel stock with extra orders (under EFA)
The MSO website should include such chart or similar so that the difference between stock and orders is very clear.
Quote 4
JOURNALIST: Minister, Connor McGoverne from Nine News. Your weekly update, there were some new figures in there. I think you said two billion worth- over two billion litres of diesel is on its way for the month.
CHRIS BOWEN: That’s right.
JOURNALIST: How does that compare to previous months? Because I don’t think we’ve had quite those numbers before.
CHRIS BOWEN: No, I have released those figures now for several weeks each week. Our diesel is down a little bit in terms of the forward orders, jet fuel is up substantially – so that’s a good thing. They’re pretty broadly consistent, Connor. What we’ve seen is, today, 4 billion litres. Last week it was 4.6 billion litres, but the week before that- the two weeks before that it 4.1 billion litres, and the week before that was 3.7.
https://minister.dcceew.gov.au/bowen/transcripts/press-conference-sydney-new-south-wales-3
The Minister is mixing up his own numbers. He can’t compare these numbers because
• 4 bn litres do not contain 550 ML extra supplies from EFA
• 4.6 bn litres contain the extra 400 ML from EFA.
Operational levels in tank farms
Let’s look how full the tanks are:
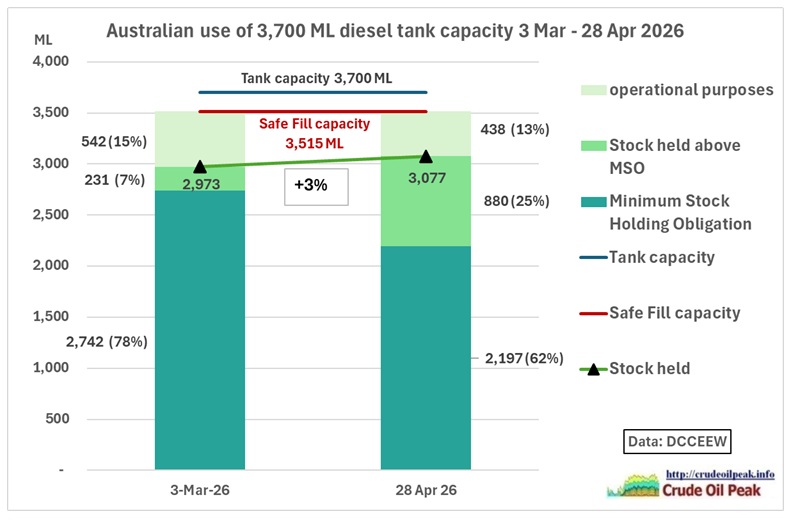 Fig 9: How diesel tank capacity is used
The tank volume between the MSO (2,197 ML) and the safe fill capacity (3,515 ML) is the operational volume of 1,318 ML. On 3 March the fill-level was 231/(231+542)= 30%. On 28 April was 880/(880+438) = 66%. More is hardly possible because there must always be space for the next tankers when they arrive, often after long voyages. The monthly consumption of diesel is around 2,600 ML. So about half of that is kept in the tanks above the MSO.
This means tanks have been filled bit by bit very likely because importers fear the situation will get worse in future.
Please keep in mind that these are national averages and that certain tank farms will have different levels.
It is just like topping up your car to have it at least half full at all times.
In the meantime, the Middle East is gyrating through the umpteenth cycle of threats, hopes and desperation while Hormuz still remains closed as it is effectively controlled by the IRGC. Maybe we’ll get a memorandum of misunderstanding.
OPEC has just released its latest statistics for 2025 and this graph shows where the exports go to:
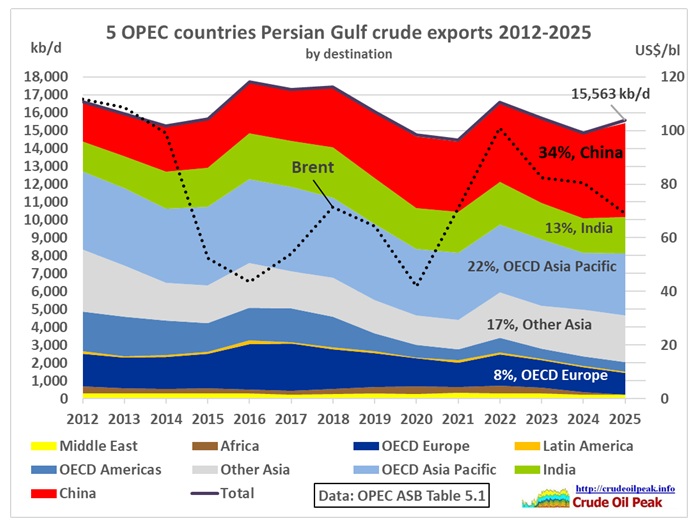 Fig 10: OPEC’s exports through Hormuz
Saudi Arabia manages to export appr. 4 mb/d from Yanbu which, however, depends on the Houthis refraining from attacking tankers in the Red Sea. And the UAE can export 1.5 mb/d via a pipeline to Fujairah in Oman but this port was attacked by 12 Iranian missiles on May 5th.
So with every day around 10-11 mb have to be drawn from inventories, mainly in Asia.
Conclusion:
Of course, the government wants to convey the news that everything is OK and quotes data which support this message. However, more detailed analysis in this article shows that there are logistical problems. The government is aware of this and has now proposed to spend $10.8 bn on a fuel security and resilience package. The largest part will go into financing EFA activities and around 30% will go to build new government controlled tank farms – which of course will take several years. This is topic for another post.