- Description
- Matt Mushalik (MEAust, CPEng) Sydney
![Excluding the US, rest-of-world crude oil production in the 2nd half of 2012 was on the same level as in the 2nd half of 2005, despite 85% higher oil prices. […]](https://crudeoilpeak.info/wp-content/uploads/2013/04/Incremental_crude_World_showing_decline_2001_Dec2012-115x115.jpg "Excluding the US, rest-of-world crude production in 2H2012 was not higher than in 2005")
![It is now 10 years that the coalition of the willing, err… peaking (US peak 1970, UK peak 1999, Australia peak 2000) invaded Iraq. This was not just an oil […]](https://crudeoilpeak.info/wp-content/uploads/2013/03/Energy_Task_Force_May_2001_Projection_vs_actual_2000_2011-115x115.jpg "Iraq war and its aftermath failed to stop the beginning of peak oil in 2005")
![Oil production (crude and NGLs) of 5 international oil companies has been declining by a total of 15% over the period 2004-2011. Merci, Jean (Lahererre, ASPO France) pour m’avoir envoyé […]](https://crudeoilpeak.info/wp-content/uploads/2013/03/5_IOC_oil_production_underlying_decline_2000_2011-115x115.jpg "International oil companies’ oil production peaked in 2004 and declined by 2.1 % pa")
![1 year ago the Australian Federal Government refused to table their internal peak oil report BITRE 117 before a Senate hearing on the grounds that the report was not “up […]](https://crudeoilpeak.info/wp-content/uploads/2013/01/BITRE_117_vs_EIA_actual_2007_2012-115x115.jpg "How good was the Australian peak oil report BITRE 117 (peaky leaks part 4)")
![Only 2 weeks after NSW infrastructure boss Nick Greiner could not answer the question how toll-way debt in Sydney can be paid back, the answer comes from another Australian capital […]](https://crudeoilpeak.info/wp-content/uploads/2013/02/Brisbane_airport_link_traffic_Aug_Dec_2012-115x115.jpg "Brisbane Airport Link: at the end of the road tunnel investor money flies away (part 2)")
![At a recent ITLS seminar, Infrastructure NSW’s chairman Nick Greiner could not show calculations how Sydney’s existing toll-way debt, not to mention future debt from proposed new toll-ways, will ever […]](https://crudeoilpeak.info/wp-content/uploads/2013/02/Transurban_debt_maturities_Dec2012-115x115.jpg "No debt repayment plan for Sydney’s toll-ways")
![Using JODI data, crude oil exports have peaked in 2005/2006 and since then have shrunk by a total of 5% despite export growth in several countries including Iraq and Canada […]](https://crudeoilpeak.info/wp-content/uploads/2013/02/Crude_exports_JODI_Jan2002_Nov2012-115x115.jpg "Shrinking crude oil exports A tough game for oil importers")
![Contents: 1 Australian government failed to update its internal peak oil report 2 NSW government can’t deal with peak oil 3 Media dropped ball on peak oil and impact of […]](https://crudeoilpeak.info/wp-content/uploads/2013/01/Tollopoly-115x115.jpg "Report Card 2012: it was a very good year – for peak oil denial")
![The following graph shows the changes in global crude oil production since January 2001. The data source is the EIA International Energy Statistics downloaded in December 2012 http://www.eia.gov/cfapps/ipdbproject/iedindex3.cfm Countries have […]](https://crudeoilpeak.info/wp-content/uploads/2013/01/Incremental_crude_World_2001_Sep2012-115x115.jpg "75 pct of global crude production in 2012 was not higher than in 2005")
![Ho, Ho, Ho. Doors closing, line closing ….. stand clear. As a perfect X’mas present, NSW Planning Minister Brad Hazzard announced the closure of the rail line to the Newcastle […]](https://crudeoilpeak.info/wp-content/uploads/2012/12/Newcastle_express-santa-115x115.jpg "Last Xmas train from Sydney to Newcastle CBD")
Categories
- Africa
- Algeria
- Angola
- Asia
- Australia
- Australia Budget
- Australia Transport
- Australian Mining
- Australian natural gas
- Australian rail
- Australian refineries
- Aviation
- BP
- BP Statistical Review
- Cars
- China
- Coal Seam Gas
- Crude oil analysis
- Debt
- Egypt
- Europe
- Feature1
- Global
- Hormuz
- India
- Iran
- Iraq
- Japan
- Korea
- Kuwait
- Latin America
- Libya
- Malaysia
- Middle East
- Motorways
- New South Wales
- North Sea
- OPEC
- Peaky Leaks
- Persian Gulf
- Power Supply
- Qatar
- Russia
- Saudi Arabia
- Shale gas
- Shell
- Singapore
- South East Asia
- Sudan
- Sydney
- Sydney Metros
- Syria
- Taiwan
- Tony Abbott Australian PM
- Ukraine
- United Arab Emirates
- United Kingdom
- United States
- Venezuela
- Vietnam
Sidebar menu
- Net oil importers
- Oil Exports
- Crude oil imports
- Downloads
- Latest Graphs
- Oil price analysis
- Australian fuel prices
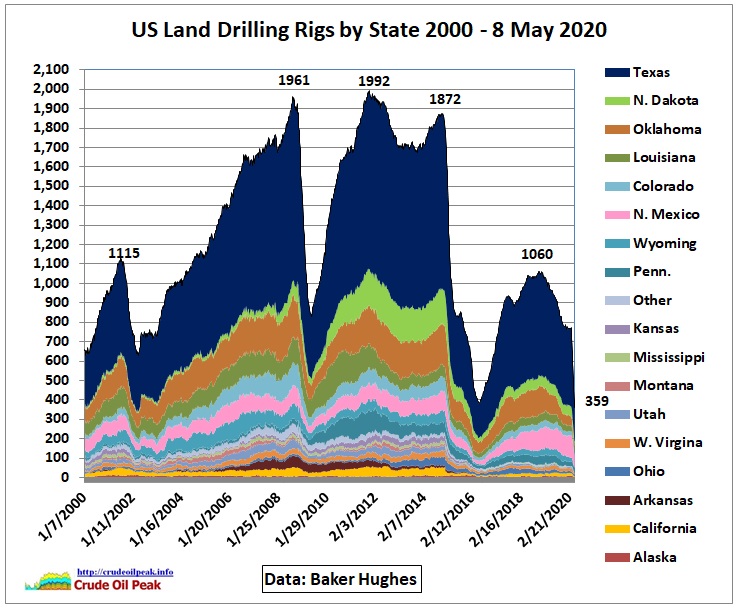 US drilling rig count
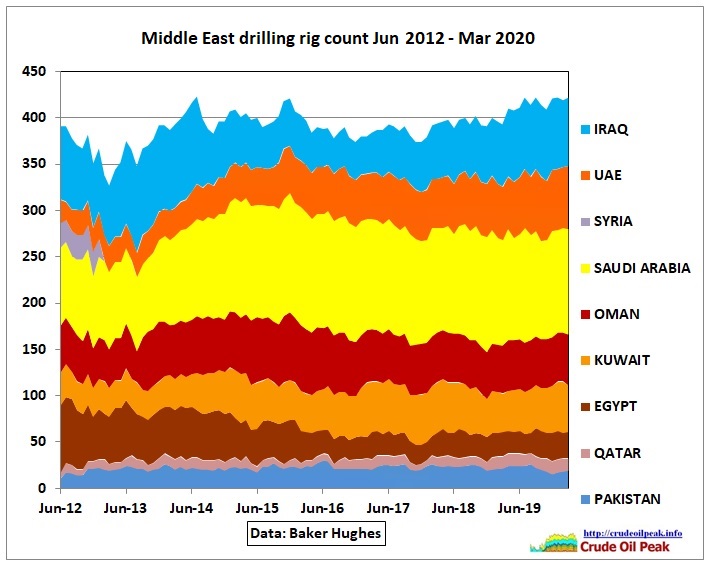 International drilling rig count
- International oil companies
- Diary
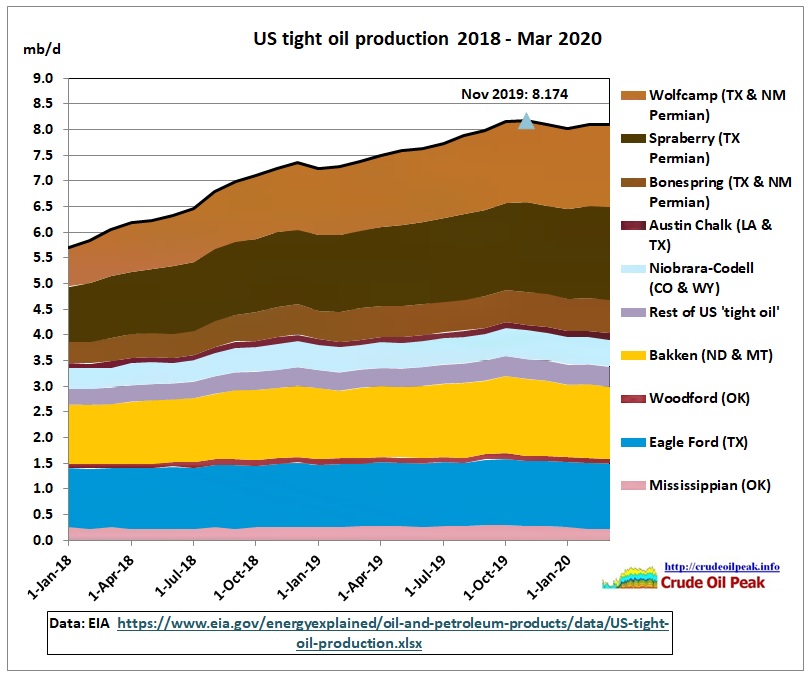 US tight oil production
 China peak oil
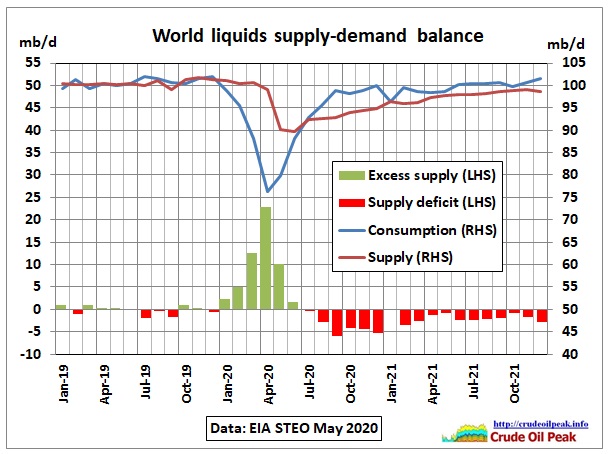 World liquids supply – demand balance
 Australian oil and fuel imports
-