- Description
- Matt Mushalik (MEAust, CPEng) Sydney
![Summary: Oil reserves as reported in the Statistical Review have experienced a phenomenal growth but are not all proven (1P) reserves as claimed. The reserve tables provided contain a mixture […]](https://crudeoilpeak.info/wp-content/uploads/2012/08/Chavez_heavy_oil-115x115.jpg "BP Statistical Review 2012 The incredible growth of oil(y) resources")
![“Iran’s Supreme Leader Ayatollah Ali Khamenei said in Tehran that Iran has become addicted to selling crude oil and the time has come that the country voluntarily shut down some […]](https://crudeoilpeak.info/wp-content/uploads/2012/08/Grand_Ayatollah_Ali_Khamenei-635x357-115x115.jpg "Iran’s 2nd and last oil peak")
![Oil prices are now 5-6 times higher than in the late 1990s and 3-4 times higher than in the early 2000s before peak oil started in 2005. Now, do governments […]](https://crudeoilpeak.info/wp-content/uploads/2012/08/Car_pooling_fun-115x115.jpg "Poor peak oil preparation rating for NSW budget 2012")
![Welcome to the Asian century. As the Caltex refinery in Sydney will close in 2014, Caltex will get its fuel from Chevron with refineries in Singapore, Thailand and South Korea. […]](https://crudeoilpeak.info/wp-content/uploads/2012/07/Kurnell-closed-115x115.jpg "After Sydney refinery closure, Caltex to import fuel from Chevron’s shrinking sales")
![This is easy to check. From the Geoscience Australia website (GA – Oil and Gas Resources of Australia – OGRA) we add total reserves (proved and probable = 2P) for […]](https://crudeoilpeak.info/wp-content/uploads/2012/07/BP_Stat_Review_proved_reserves_vs_GA_proven_and_probable_reserves_1980_2011-115x115.jpg "BP Statistical Review 2012 Part 2 Australia proved oil reserves overreported by a factor of 2")
![Summary Brisconnections’ Airport Link is based on a financing model with increasing debt until 2026 and repayment of debt only after 2035. In the context of the evolving debt crisis […]](https://crudeoilpeak.info/wp-content/uploads/2012/07/AirportLink_Bowen_Hills-115x115.jpg "Brisbane Airport Link: another tollway miracle of growing debt and assumed traffic growth (part 1)")
![Do it yourself. This takes 2 minutes. Australian government web site. CLICK 1 Type in google the search word “Geoscience Australia” CLICK 2 Click on http://www.ga.gov.au/ CLICK 3 Click on […]](https://crudeoilpeak.info/wp-content/uploads/2012/06/Australian_EDR_of_crude_oil_Produced_Remaining_1982_2010_trend_2020-115x115.jpg "10 mouse clicks to calculate Australian crude oil depletion of 83 per cent")
![The Pocahontas tollway South of Richmond, Virginia, is the latest example how the combination of embellished traffic projections and a weak economy – caused by high oil prices – have […]](https://crudeoilpeak.info/wp-content/uploads/2012/06/Pocahontas_tollway_traffic_actual_vs_projected_gasoline_prices_2002_2012-115x115.jpg "Ghost traffic on US tollway hits peak oil ignorant banks and investors")
![Graphs prepared using data from the BP Statistical Review 2012 http://www.bp.com/sectionbodycopy.do?categoryId=7500&contentId=7068481 (1) Discrepancies BP data show oil consumption being higher than oil production. The discrepancy has been growing from 1998 […]](https://crudeoilpeak.info/wp-content/uploads/2012/06/BP_Stat_Review_2012_Production_Deficit_1987_2011-115x115.jpg "BP Statistical Review 2012 Analysis Part 1 Discrepancies and Peak Exports")
![From the Economist’s website: global public debt has reached $US 45 trillion. http://www.economist.com/content/global_debt_clock We compare the stacked debt curves with the NYMEX oil price: The steep rise of both debt […]](https://crudeoilpeak.info/wp-content/uploads/2012/06/Global_debt_clock_4_June_2012-115x115.jpg "Global debt and oil prices")
Categories
- Africa
- Algeria
- Angola
- Asia
- Australia
- Australia Budget
- Australia Transport
- Australian Mining
- Australian natural gas
- Australian rail
- Australian refineries
- Aviation
- BP
- BP Statistical Review
- Cars
- China
- Coal Seam Gas
- Crude oil analysis
- Debt
- Egypt
- Europe
- Feature1
- Global
- Hormuz
- India
- Iran
- Iraq
- Japan
- Korea
- Kuwait
- Latin America
- Libya
- Malaysia
- Middle East
- Motorways
- New South Wales
- North Sea
- OPEC
- Peaky Leaks
- Persian Gulf
- Power Supply
- Qatar
- Russia
- Saudi Arabia
- Shale gas
- Shell
- Singapore
- South East Asia
- Sudan
- Sydney
- Sydney Metros
- Syria
- Taiwan
- Tony Abbott Australian PM
- Ukraine
- United Arab Emirates
- United Kingdom
- United States
- Venezuela
- Vietnam
Sidebar menu
- Net oil importers
- Oil Exports
- Crude oil imports
- Downloads
- Latest Graphs
- Oil price analysis
- Australian fuel prices
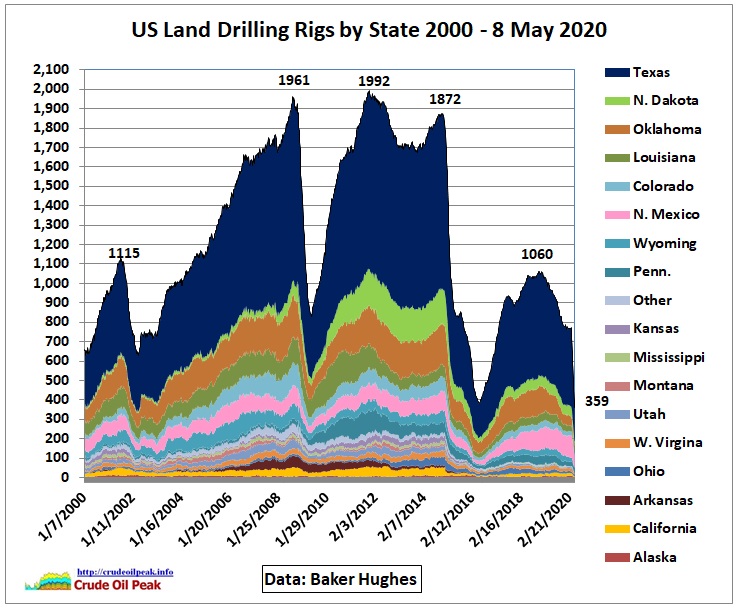 US drilling rig count
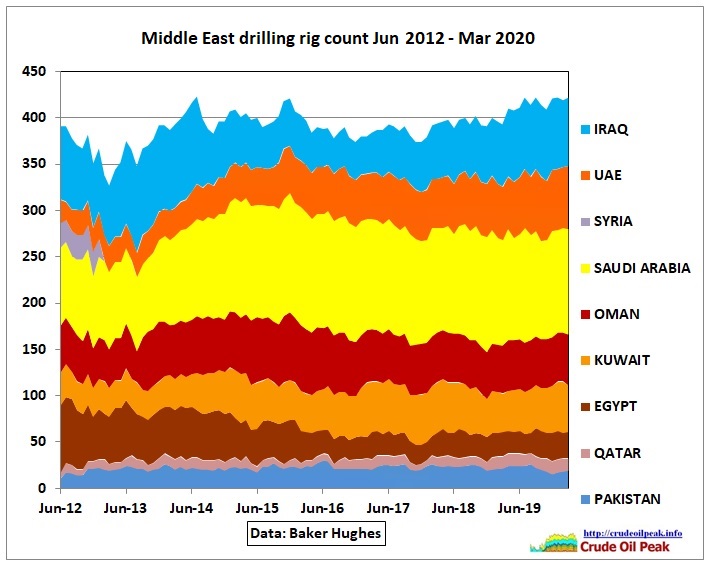 International drilling rig count
- International oil companies
- Diary
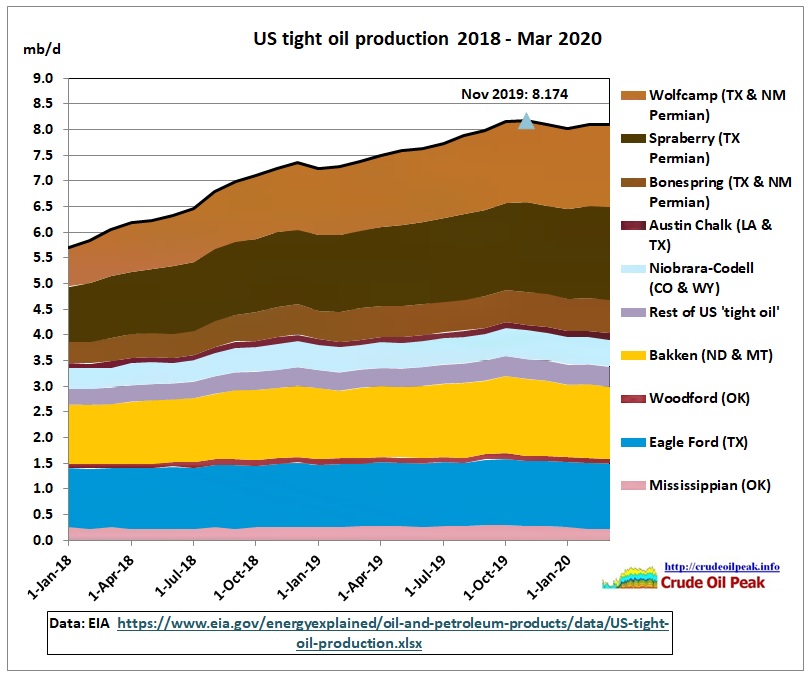 US tight oil production
 China peak oil
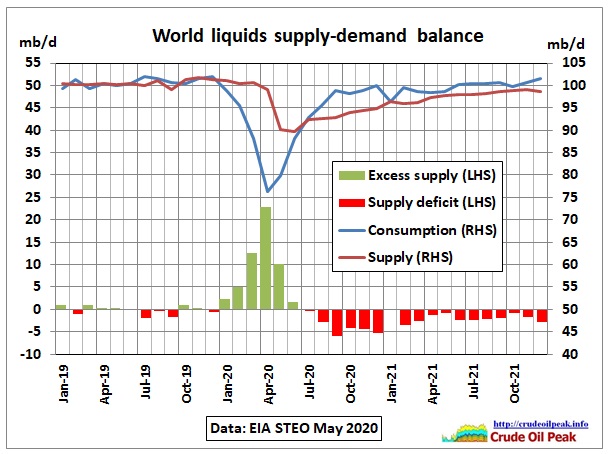 World liquids supply – demand balance
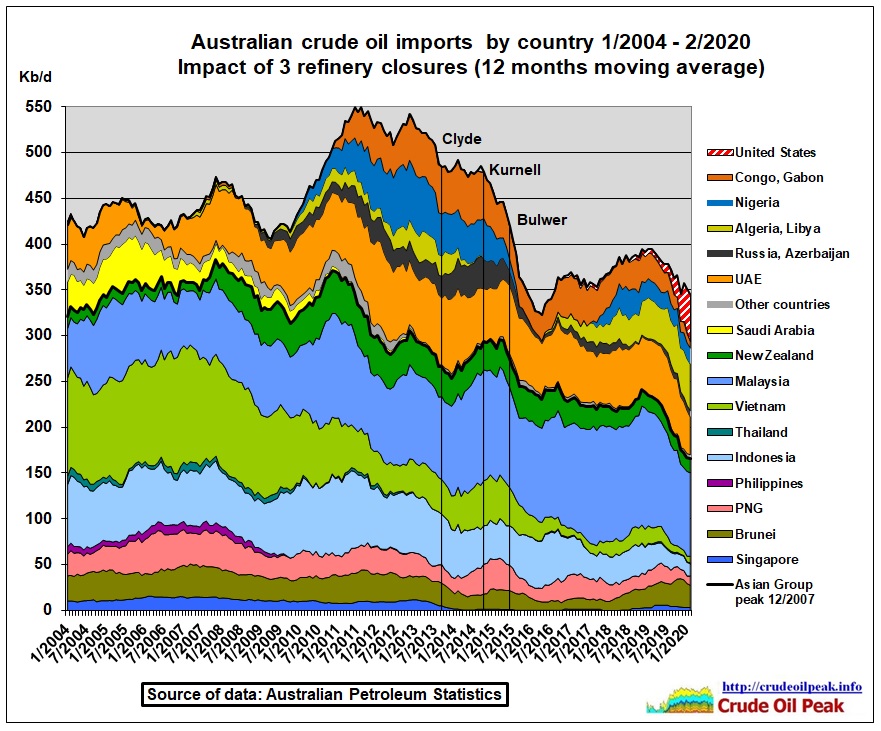 Australian oil and fuel imports
-