Categories
- Africa
- Algeria
- Angola
- Asia
- Australia
- Australia Budget
- Australia Transport
- Australian Mining
- Australian natural gas
- Australian rail
- Australian refineries
- Aviation
- BP
- BP Statistical Review
- Cars
- China
- Coal Seam Gas
- Crude oil analysis
- Debt
- Egypt
- Europe
- Feature1
- Global
- Hormuz
- India
- Iran
- Iraq
- Japan
- Korea
- Kuwait
- Latin America
- Libya
- Malaysia
- Middle East
- Motorways
- New South Wales
- North Sea
- OPEC
- Peaky Leaks
- Persian Gulf
- Power Supply
- Qatar
- Russia
- Saudi Arabia
- Shale gas
- Shell
- Shipping
- Singapore
- South East Asia
- Sudan
- Sydney
- Sydney Metros
- Syria
- Taiwan
- Tony Abbott Australian PM
- Ukraine
- United Arab Emirates
- United Kingdom
- United States
- Venezuela
- Vietnam
Sidebar menu
- Net oil importers
- Oil Exports
- Crude oil imports
- Downloads
- Latest Graphs
- Oil price analysis
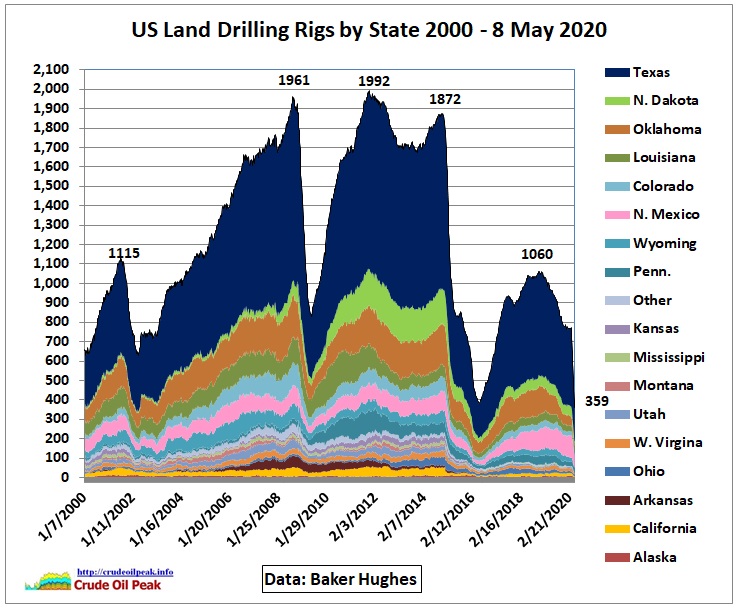 US drilling rig count
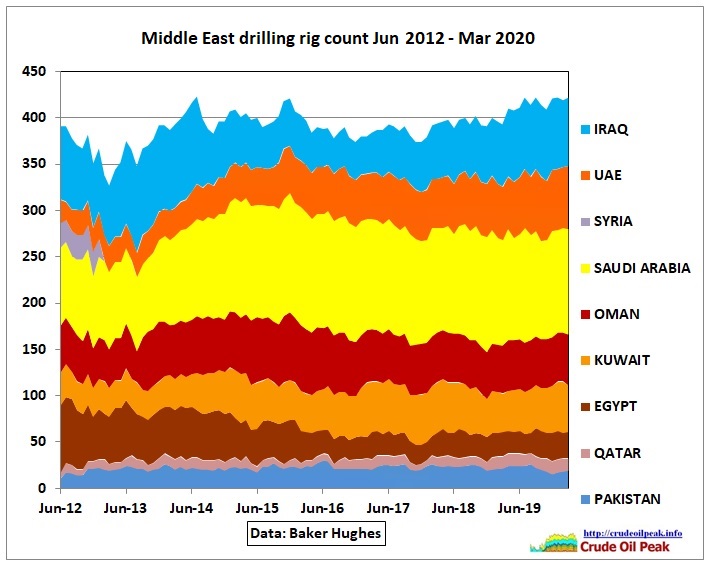 International drilling rig count
- Australian fuel prices
- Diary
- International oil companies
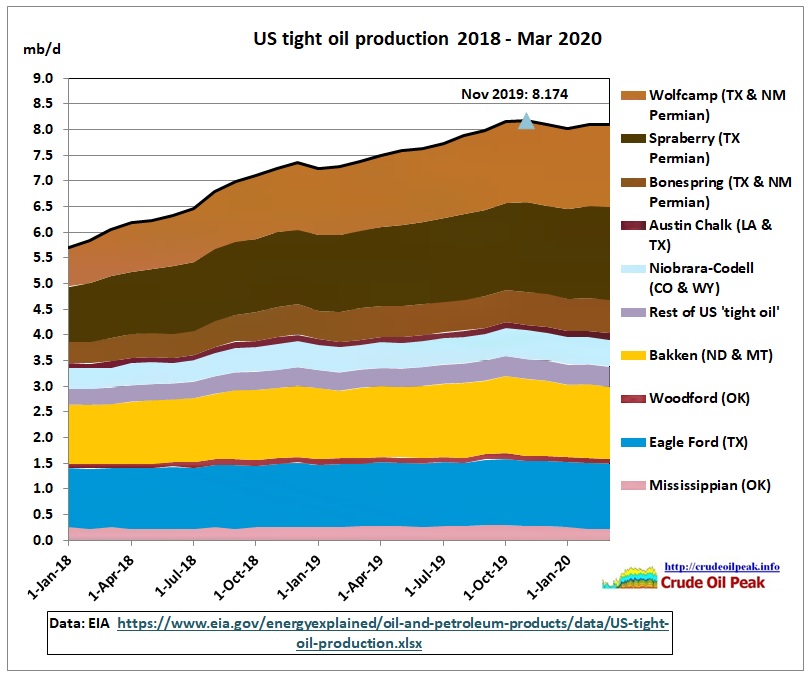 US tight oil production
 China peak oil
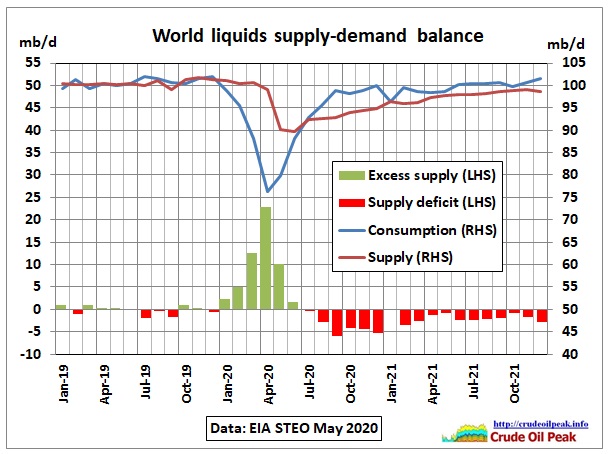 World liquids supply – demand balance
 Tankers arriving and departing in Sydney
 Australian oil and fuel imports
-
United States Archive
-
![Google for “US energy independence” and you will get 134k results, “US self sufficiency” yields 10k results. Here are some examples of what the media reports: In Aljazeera’s Inside Story, […]](https://crudeoilpeak.info/wp-content/uploads/2016/01/US_crude_oil_imports_and_production_to_Oct2015-115x115.jpg "The myth of US self-sufficiency in crude oil")
The myth of US self-sufficiency in crude oil
Posted on January 21, 2016 | No CommentsGoogle for “US energy independence” and you will get 134k results, “US self sufficiency” yields 10k results. Here are some examples of what the media reports: In Aljazeera’s Inside Story, […] -
![The media is full with news that there is a global oil glut. There are now more than 3bn barrels of excess oil in the world 13/11/2015 http://www.telegraph.co.uk/finance/oilprices/11993687/There-are-now-more-than-3bn-barrels-of-excess-oil-in-the-world.html Record oil […]](https://crudeoilpeak.info/wp-content/uploads/2015/12/OECD_stock_change_Dec2015_by_fuel_region-115x115.jpg "Where actually is that much-hyped global oil glut?")
Where actually is that much-hyped global oil glut?
Posted on December 29, 2015 | No CommentsThe media is full with news that there is a global oil glut. There are now more than 3bn barrels of excess oil in the world 13/11/2015 http://www.telegraph.co.uk/finance/oilprices/11993687/There-are-now-more-than-3bn-barrels-of-excess-oil-in-the-world.html Record oil […] -
![You want $40 oil? Yes, please. But according to the World Energy Outlook 2015 of the International Energy Agency, recently released in London, that would mean 3 mb/d less US […]](https://crudeoilpeak.info/wp-content/uploads/2015/11/US_crude_production_USD_50_scenario_2020_IEA_WEO_Nov-2015-115x115.jpg "IEA: US$ 40 oil means 3 mb/d less tight oil by 2020")
IEA: US$ 40 oil means 3 mb/d less tight oil by 2020
Posted on November 16, 2015 | No CommentsYou want $40 oil? Yes, please. But according to the World Energy Outlook 2015 of the International Energy Agency, recently released in London, that would mean 3 mb/d less US […] -
![According to EIA data, monthly US crude oil production peaked in April 2015 at 9.6 mb/d. Fig 1: US crude oil production to June 2015 http://www.eia.gov/dnav/pet/pet_crd_crpdn_adc_mbblpd_m.htm The above graph shows […]](https://crudeoilpeak.info/wp-content/uploads/2015/09/US_crude_production_Jan2007-Jun2015_EIA-115x115.jpg "US shale oil too expensive, peaks 1H 2015")
US shale oil too expensive, peaks 1H 2015
Posted on September 30, 2015 | No CommentsAccording to EIA data, monthly US crude oil production peaked in April 2015 at 9.6 mb/d. Fig 1: US crude oil production to June 2015 http://www.eia.gov/dnav/pet/pet_crd_crpdn_adc_mbblpd_m.htm The above graph shows […] -
![This post uses data from the inter area oil movement section of the BP Statistical Review published in June 2015. It is a continuation of an earlier post on Asian […]](https://crudeoilpeak.info/wp-content/uploads/2015/07/Asia_oil_imports_by_region_2001_2014-115x115.jpg "Asia depends on Middle East for 66 % of its oil imports")
Asia depends on Middle East for 66 % of its oil imports
Posted on July 1, 2015 | No CommentsThis post uses data from the inter area oil movement section of the BP Statistical Review published in June 2015. It is a continuation of an earlier post on Asian […] -
![This is a post on the EIA Short Term Energy Outlook March 2015 (STEO) The following graph shows total US crude production according to EIA statistics until Feb 2015 and […]](https://crudeoilpeak.info/wp-content/uploads/2015/03/World_liquids_supply_2011_2016_EIA_STEO_Mar2015-115x115.jpg "US enters undulating crude oil production plateau in 2015")
US enters undulating crude oil production plateau in 2015
Posted on March 18, 2015 | No CommentsThis is a post on the EIA Short Term Energy Outlook March 2015 (STEO) The following graph shows total US crude production according to EIA statistics until Feb 2015 and […] -
![The International Energy Agency’s Medium Term Oil Market Report 2015 included an interesting graph showing changes in US and Russian oil production for the next 5 years: IEA MTOMR February […]](https://crudeoilpeak.info/wp-content/uploads/2015/03/US_crude_and_NGL_production_2009_2020_IEA_MTOMR_2015-115x115.jpg "IEA report: US shale oil growth practically zero in 2017")
IEA report: US shale oil growth practically zero in 2017
Posted on March 3, 2015 | No CommentsThe International Energy Agency’s Medium Term Oil Market Report 2015 included an interesting graph showing changes in US and Russian oil production for the next 5 years: IEA MTOMR February […] -
![This is another post in the series on how US tight oil has impacted on global oil markets. This time we look at US petroleum product exports. (1) Destination of […]](https://crudeoilpeak.info/wp-content/uploads/2015/01/US_product_exports_by_country_1993_Oct2014-115x115.jpg "40 % of US petroleum product exports didn’t grow since 2011")
40 % of US petroleum product exports didn’t grow since 2011
Posted on January 27, 2015 | No CommentsThis is another post in the series on how US tight oil has impacted on global oil markets. This time we look at US petroleum product exports. (1) Destination of […] -
![We continue to look at what impact US tight oil has on global oil markets, in this post the reduction of US petroleum product imports. This analysis shows that only […]](https://crudeoilpeak.info/wp-content/uploads/2015/01/US_petroleum_product_imports_by_country_1993_2014E-115x115.jpg "Tight oil boom can explain only part of drop in US oil product imports")
Tight oil boom can explain only part of drop in US oil product imports
Posted on January 13, 2015 | No CommentsWe continue to look at what impact US tight oil has on global oil markets, in this post the reduction of US petroleum product imports. This analysis shows that only […] -
![In part 3 of this series on the impact of US tight oil, we look at US crude oil imports from Non-OPEC countries. Excluding Canada – which is a special […]](https://crudeoilpeak.info/wp-content/uploads/2014/12/US_crude_imports_Non_OPEC_1973_2013_excl-Canada-115x115.jpg "US crude imports from Non-OPEC countries peaked 10 years before tight oil boom")
US crude imports from Non-OPEC countries peaked 10 years before tight oil boom
Posted on December 2, 2014 | No CommentsIn part 3 of this series on the impact of US tight oil, we look at US crude oil imports from Non-OPEC countries. Excluding Canada – which is a special […]