Categories
- Africa
- Algeria
- Angola
- Asia
- Australia
- Australia Budget
- Australia Transport
- Australian Mining
- Australian natural gas
- Australian rail
- Australian refineries
- Aviation
- BP
- BP Statistical Review
- Cars
- China
- Coal Seam Gas
- Crude oil analysis
- Debt
- Egypt
- Europe
- Feature1
- Global
- Hormuz
- India
- Iran
- Iraq
- Japan
- Korea
- Kuwait
- Latin America
- Libya
- Malaysia
- Middle East
- Motorways
- New South Wales
- North Sea
- OPEC
- Peaky Leaks
- Persian Gulf
- Power Supply
- Qatar
- Russia
- Saudi Arabia
- Shale gas
- Shell
- Shipping
- Singapore
- South East Asia
- Sudan
- Sydney
- Sydney Metros
- Syria
- Taiwan
- Tony Abbott Australian PM
- Ukraine
- United Arab Emirates
- United Kingdom
- United States
- Venezuela
- Vietnam
Sidebar menu
- Net oil importers
- Oil Exports
- Crude oil imports
- Downloads
- Latest Graphs
- Oil price analysis
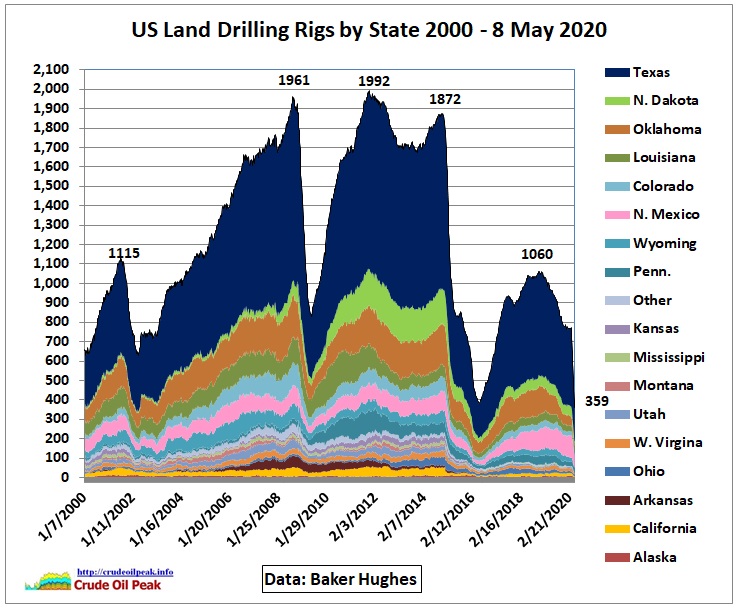 US drilling rig count
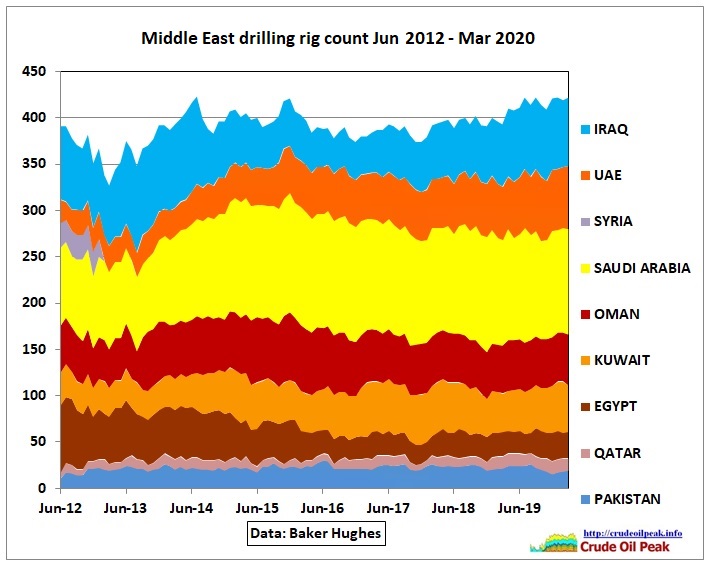 International drilling rig count
- Australian fuel prices
- Diary
- International oil companies
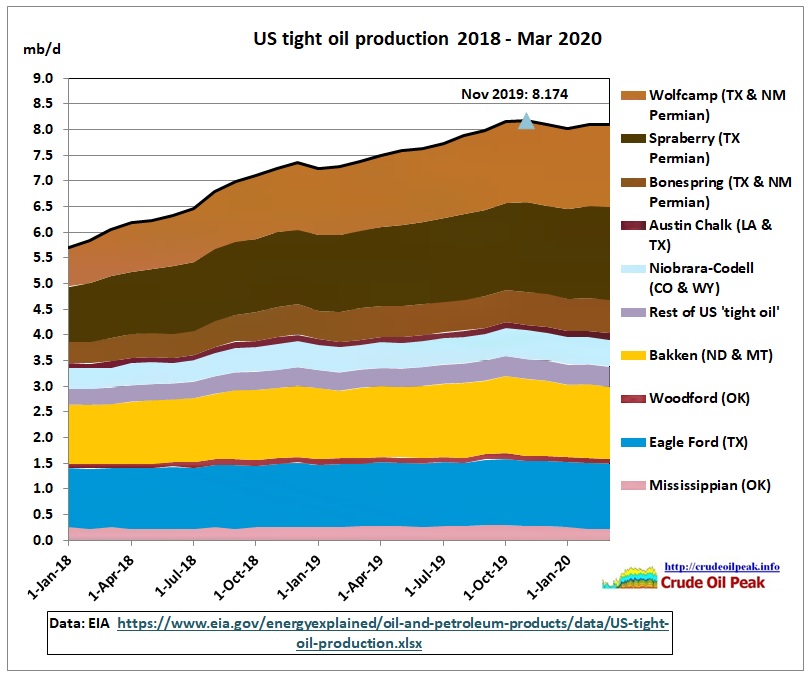 US tight oil production
 China peak oil
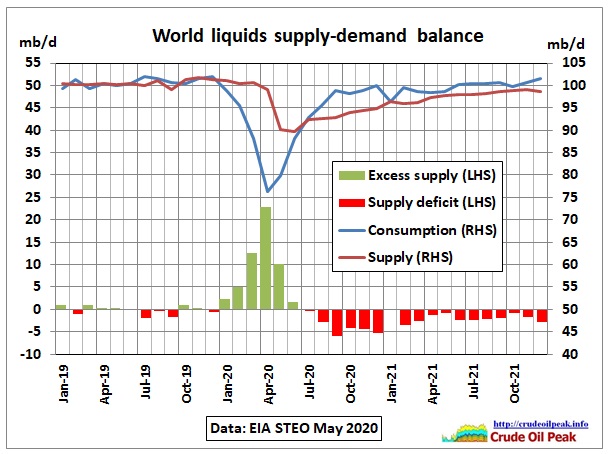 World liquids supply – demand balance
 Tankers arriving and departing in Sydney
 Australian oil and fuel imports
-
Alaska Archive
-
![The International Energy Agency’s Medium Term Oil Market Report 2015 included an interesting graph showing changes in US and Russian oil production for the next 5 years: IEA MTOMR February […]](https://crudeoilpeak.info/wp-content/uploads/2015/03/US_crude_and_NGL_production_2009_2020_IEA_MTOMR_2015-115x115.jpg "IEA report: US shale oil growth practically zero in 2017")
IEA report: US shale oil growth practically zero in 2017
Posted on March 3, 2015 | No CommentsThe International Energy Agency’s Medium Term Oil Market Report 2015 included an interesting graph showing changes in US and Russian oil production for the next 5 years: IEA MTOMR February […]