In October 2025 AEMO (Australian Energy Market Operator) issued 72 lack of reserve notices and 8 market intervention instructions:
- 46 LOR 1 forecast lack of reserve notices on 23 days
- 5 LOR 1 actual lack of reserve notices on 5 days
- 21 LOR 2 forecast lack of reserve notices on 8 days
- 0 LOR 2 actual lack of reserve notices
- 3 Foreseeable intervention warnings on 3 days
- 8 intervention instructions to hydro power plants to synchronize on 5 days
LOR1: “This condition exists when reserve levels are lower than the amount required to cover the loss of the largest generation contingency and to maintain adequate reserves to respond to losing the second-largest generator”
LOR 2: “Signals a tightening of electricity supply reserves. This condition exists when reserve levels are lower than the amount required to cover the loss of the largest generation contingency. At this level a contingency over the evening peak may result in automatic under frequency load shedding.”
In the September 2025 power supply report
there was a table with lack of reserve notices. But in October 2025 there were so many warnings that a table would be too hard to read and therefore a chart was designed to keep an overview.
 Fig 1: AEMO lack of reserve notices and intervention instructions
Data are from here: https://www.aemo.com.au/market-notices
How to read this chart: on the horizontal axis we have the calendar days of the month, on the vertical axis (another dimension of time) we have the days for which warnings were issued. The lengths of the bars indicate for how long the notices were in effect and the colour shows the type of notice (LOR2 overriding LOR1). We can see that there were 2 clusters, one in the middle and one at the end of the month, mostly ending in intervention instructions.
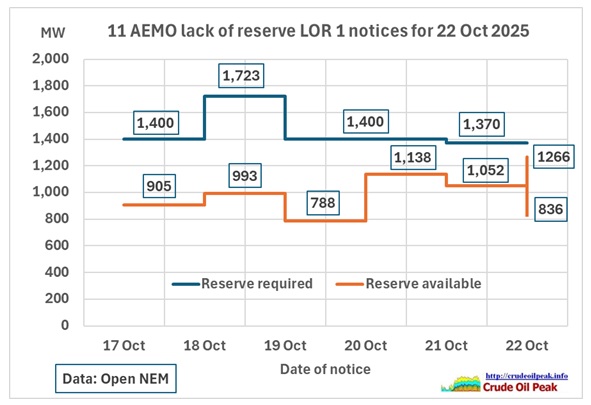 Fig 2: AEMO lack of reserve notices for 22 Oct 2025
This chart shows the details how just the LOR1 notices for the 22nd evolved (there were also LOR2 notices as shown in Fig 1).
These were hot days (see Fig 5)
One of the main reasons for the many LOR notices was the availability (or lack thereof) of coal fired power plants:
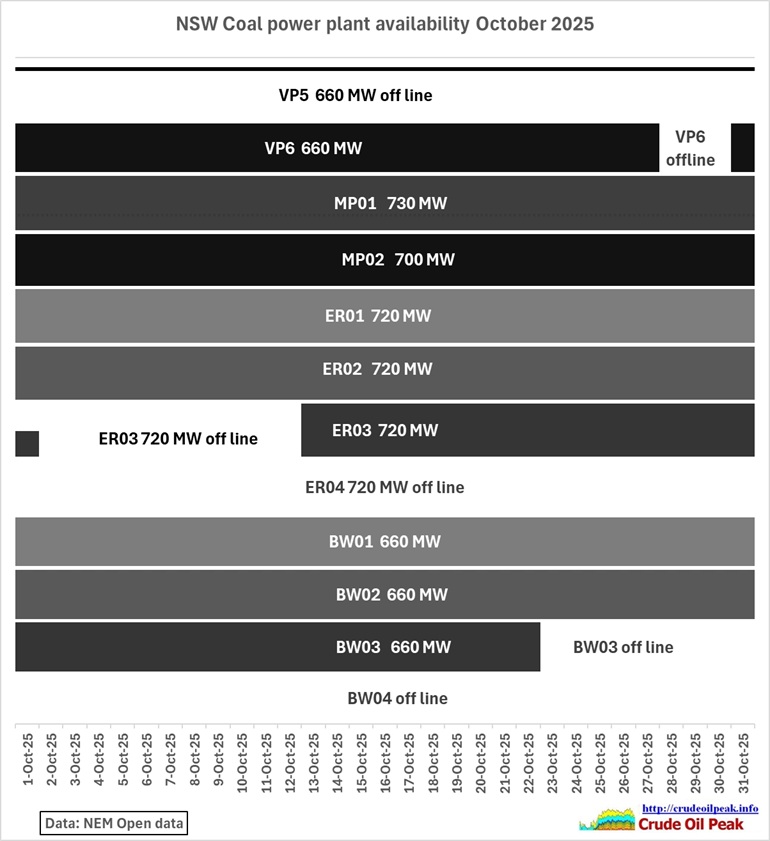 Fig 3: NSW coal plant availability
Out of 12 units, 3 were continuously offline, 2 were offline for extended periods and 1 was offline for 3 days when there were just 7 units working, only 1 more than the minimum required for system strength (see yellow dotted line in chart below). It was also when there were very cool nights for that period of the year.
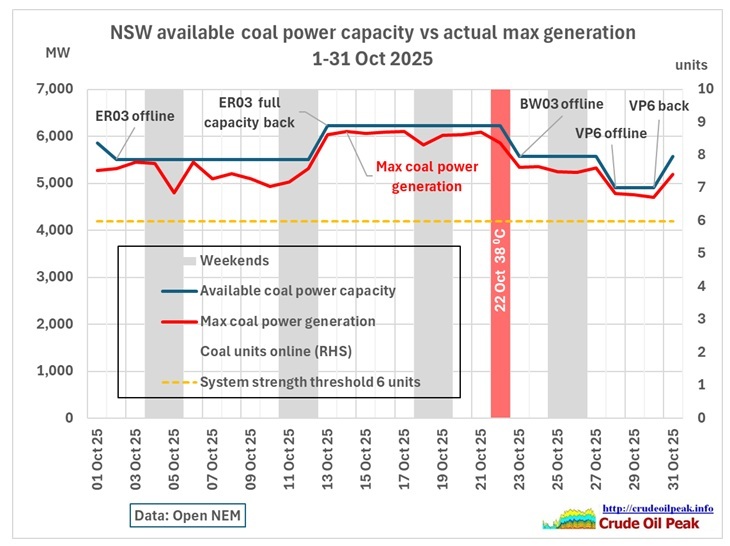 Fig 4: Utilization of NSW available coal plants
We can see that when coal plants were available they were utilized to the maximum, between 87% and 99% with an average of 95%.
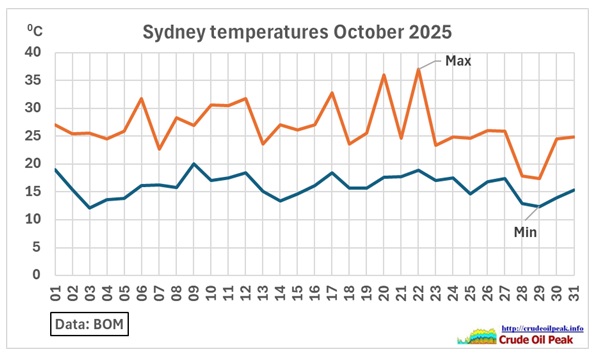 Fig 5: Temperatures in October 2025
It’s spring and there were already 7 days above 30 °C.
To be continued