Weather
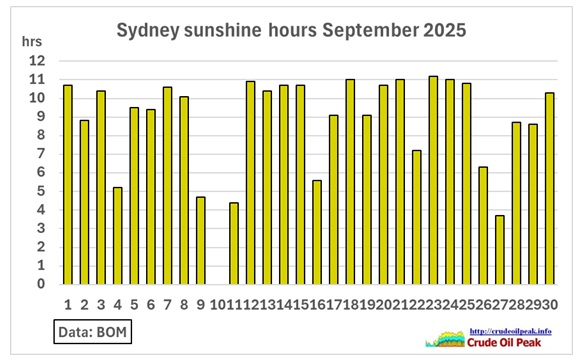 Fig 1: Sydney sunshine hours
Solar power storage needs to be designed for 1 day without sun and 7 days with only 50% output
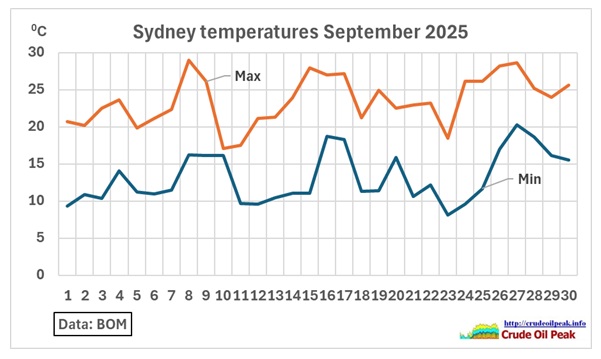 Fig 2: Temperatures in September 2025
Power generation is dependent on temperatures, in spring still mainly at night. There were 10 cold nights with temps near 10 degrees.
Coal plants availability
 Fig 3: Availability of coal plant units
https://explore.openelectricity.org.au/facility/au/NEM/ERARING/?range=30d&interval=1d
ER = Eraring, VP = Vales Point, MP = Mount Piper, BW = Bayswater
2 units (ER04 + VP5) were off-line during the whole month. 3 units (BW04, ER04, MP02) were partially offline.
We can calculate full availability as unit-days (12 units * 30 days = 360 unit-days). In September 2025 there were 271 unit-days online. Availability was therefore 271/360 =75%
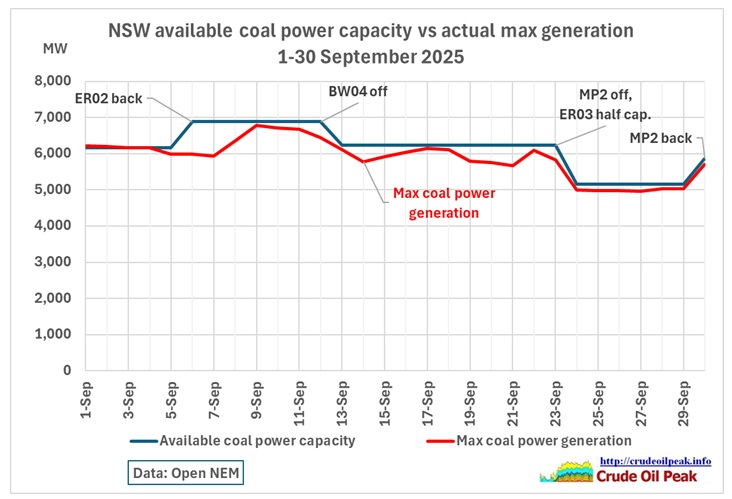 Fig 4: Max. generation of available coal plants
We can see that whatever coal power capacity was available, it was utilized very close to that capacity, at 96% on average, usually between 6 pm and 11 pm. BW04 went offline 12 Sep. 21:30.
Large coal units necessary to maintain system strength
New South Wales Synchronous Generation
From:
https://www.aemo.com.au/energy-systems/electricity/national-electricity-market-nem/system-operations/congestion-information-resource/limits-advice
Updated advice for System Normal Requirement – Hunter GT Revision
26/09/2025
“A minimum level of synchronous generation must be in service to ensure the stable operation and protection of the New South Wales transmission network. Transgrid and AEMO have jointly agreed that this requirement is met when the equivalent of six large synchronous generators are in service. Under these conditions, the network is considered to be in a satisfactory state. To be considered secure, the network must still have the equivalent of six large synchronous units in service after any credible contingency— typically the loss of the generator with the highest contribution”
https://www.aemo.com.au/-/media/files/electricity/nem/security_and_reliability/congestion-information/2024/transfer-limit-advice—system-strength-nsw.pdf
The contributions of power plants are given in table 2
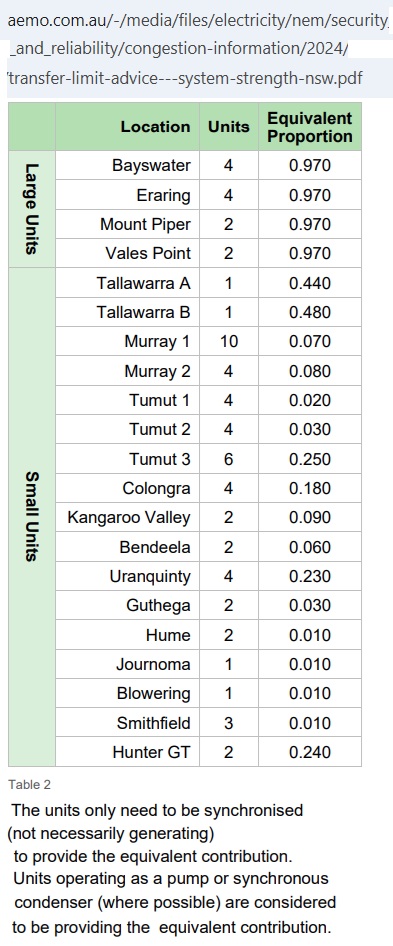 Fig 5: Table 2 of the above AEMO paper
“Since the largest credible contingency typically results in the loss of a contribution of 0.970, a total value of 6.970 or higher will generally indicate that the network is secure”
AEMO gives following examples:
7 coal powered units ……… 7*0.97=6.79
2 gas fired Colongra units….. 2*0.18=0.36
Total …………. 7.15 > 6.97 network is secure as per diagram 1 (Fig 6)
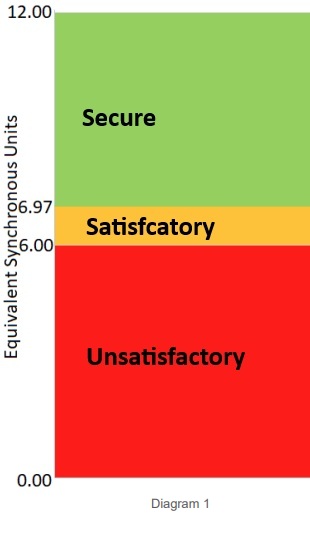 Fig 6: Network states
If now 1 unit (out of these 7 units) were to trip the calculation would look as follows:
6 * 0.970 + 2 * 0.180 = 6.180 >6 satisfactory, but not secure
AEMO must restore the network to a secure state as soon as practicable and within 30 minutes. The shortfall of 0.79 would be covered by, e.g.
3 × Tumut3 units at 0.250 each, and 1 × Kangaroo Valley unit at 0.090 = 0.84, making the total contributions to
6 × 0.970 + 2 × 0.180 + 3 × 0.250 + 0.090 = 7.020 > 6.97 secure network
As Fig 3 shows there were 5 days (24 Sep – 29 Sep) with only 8 large units operating. The equivalent contribution was 8*0.97 = 7.76 (secure state).
On 24 Sep ER02 started to generate only half (360 MW) with a chance that it would also become offline.
Then 7 units * 0.97 = 6.79 <7 satisfactory, but not secure.
AEMO Lack of reserve notices
These notices have the primary purpose to invite market participants to provide generation capacity to fill emerging gaps.
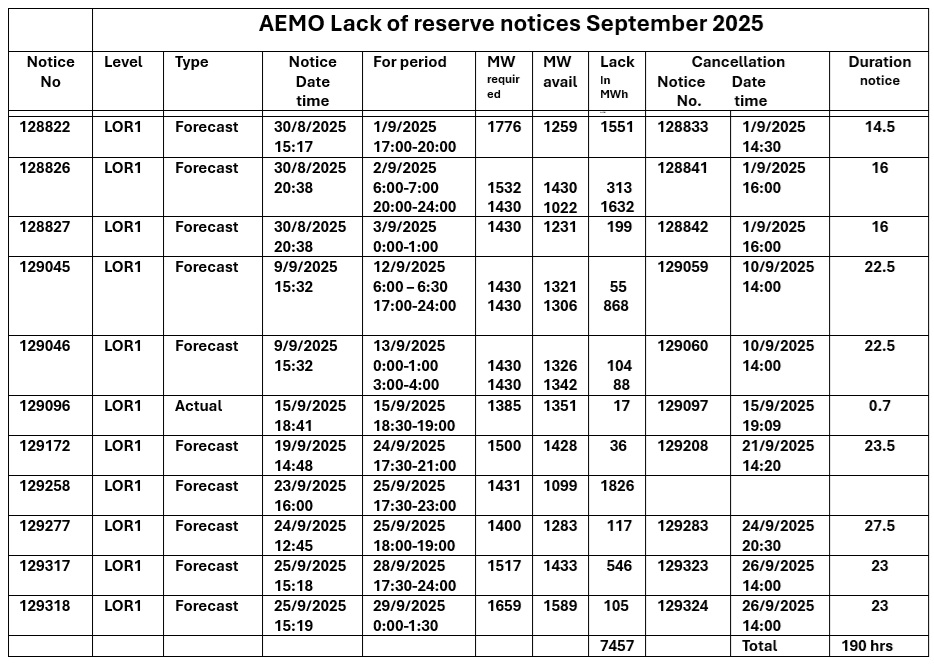 Fig 7: Lack of reserve notices
There were 11 notices on forecast LOR1 conditions for periods in September, active for a total of 190 hrs (26% of the time). No LOR2 notices. Actual LOR1 lasted only half hour.
Electricity prices
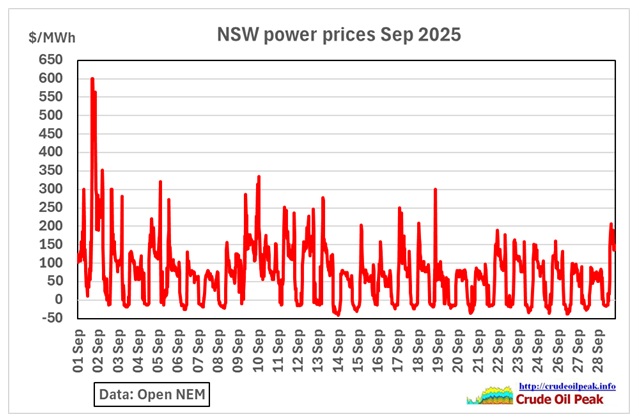 Fig 8: NSW daily power prices in September 2025
There were no big price spikes (> $10,000/MWh) like in June. The highest price was on Sep 1st with $600/MWh:
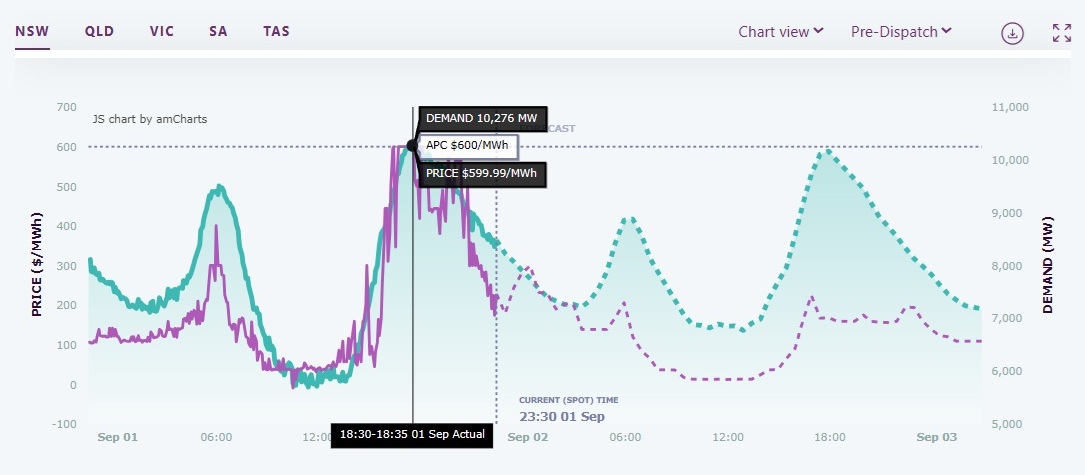 Fig 9: NSW power prices on Sep 1st
APC= Administered Price Cap = $600/MWh from 1 July 2025 – 30 June 2028
https://www.aemo.com.au/-/media/files/electricity/nem/security_and_reliability/dispatch/policy_and_process/guide-to-administered-pricing.pdf
AEMO intervention notices
3 notices were issued, the first one on 23 Sep 2025, coinciding with the period in which 4 coal fired power plants were offline (see Fig 3)
129259 MARKET INTERVENTION 23/09/2025 03:30:33 PM
Foreseeable AEMO intervention under clause 4.8.5A (a) of the NER in NSW region
AEMO ELECTRICITY MARKET NOTICE
Foreseeable AEMO intervention under clause 4.8.5A (a) of the NER in NSW region
AEMO has identified a foreseeable circumstance that may require an AEMO intervention event in the NSW region from 0000 hrs 25/09/2025.
The foreseeable circumstance requiring the need for intervention is System Strength.
Manager NEM Real Time Operations
https://www.aemo.com.au/market-notices
The warnings were cancelled on the same day they were issued, very likely because small units offered their generation.
Here is a summary:
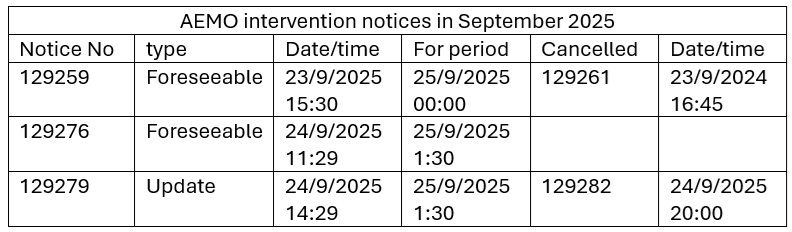 Fig 10: Table intervention notices September 2025
AEMO Non-conformance notices
Non conformance notices were issued for the Waratah battery and 4 solar farms
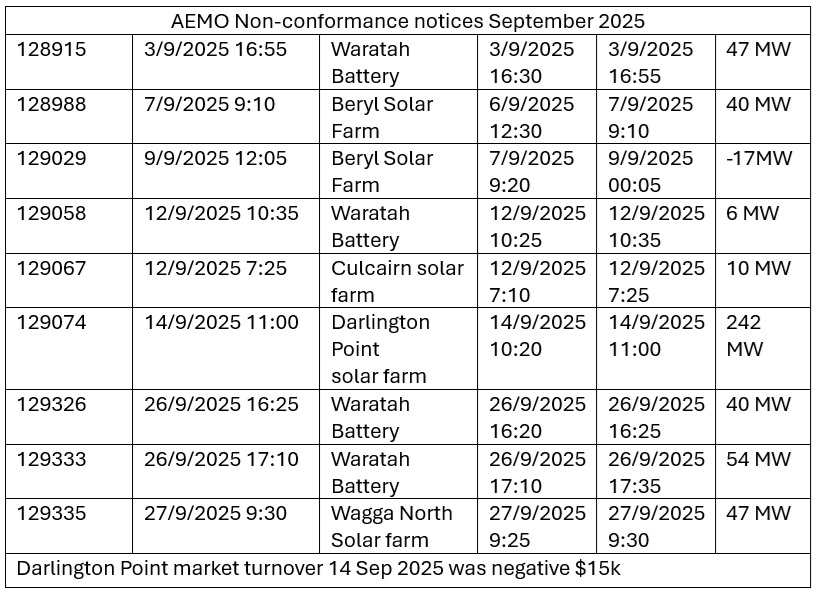 Fig 11: Non-conformance notices September 2025
The Waratah Super battery (850 MW/ 1,680 MWh capacity, guaranteed usable 1,400 MWh)
https://www.energyco.nsw.gov.au/our-projects/waratah-super-battery-project
started partial operation and testing in August 2025 and was registered on 3 Sep for 1,100 MW
https://www.energyco.nsw.gov.au/latest-updates/waratah-super-battery-market-registration
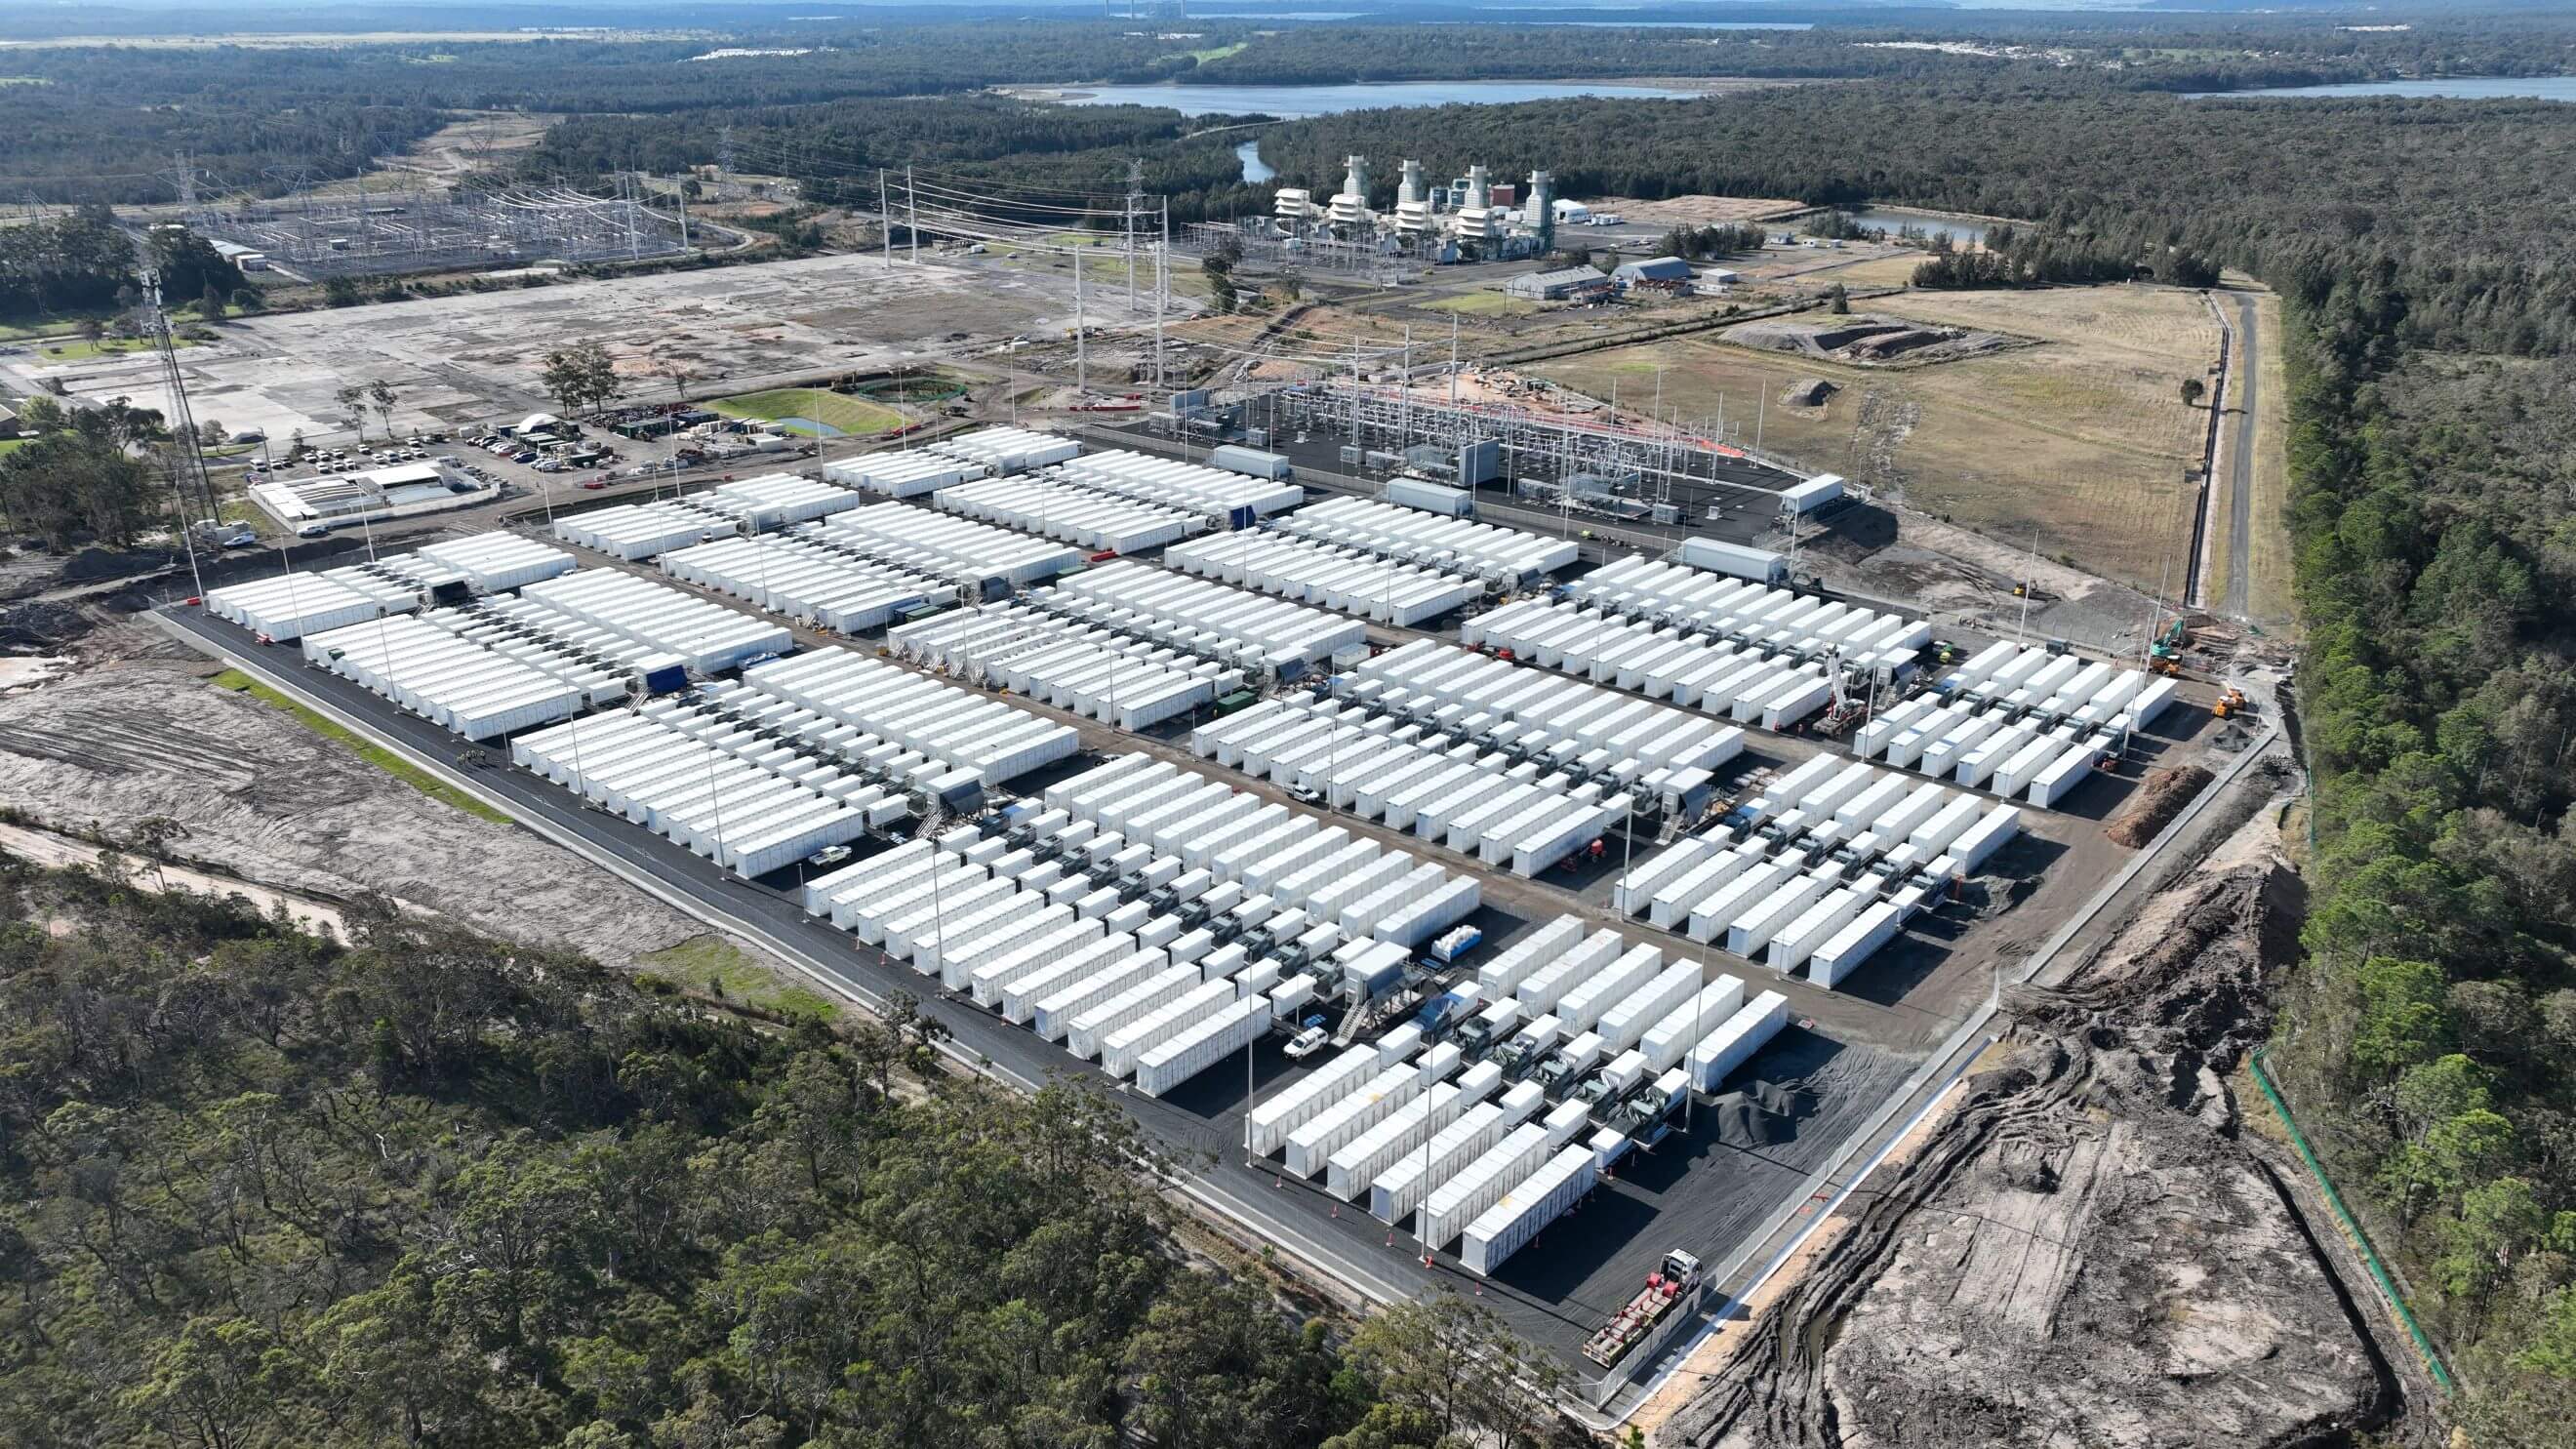 Fig 12: Waratah battery. In the background the Colongra gas peaking plant
The site was previously used as the coal stockpile area of the Munmorah power plant (600 MW) decommissioned in 2012 and with demolition completed in 2018. There are 2600 containerized lithium-ion batteries on an area of 16.5 ha including the switchyard.
The transformation between 2013 and 2025 is shown in this gif file:
https://www.instagram.com/reel/DNRd6K-PygU/
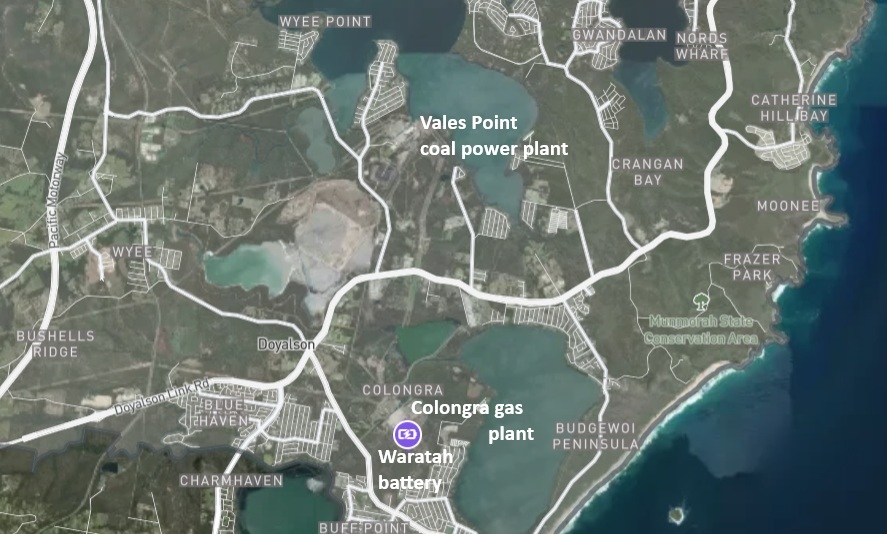 Fig 13: Location of Waratah battery, Colongra gas plant (4×180 MW) and Vales Point (2×660 MW)
Batteries
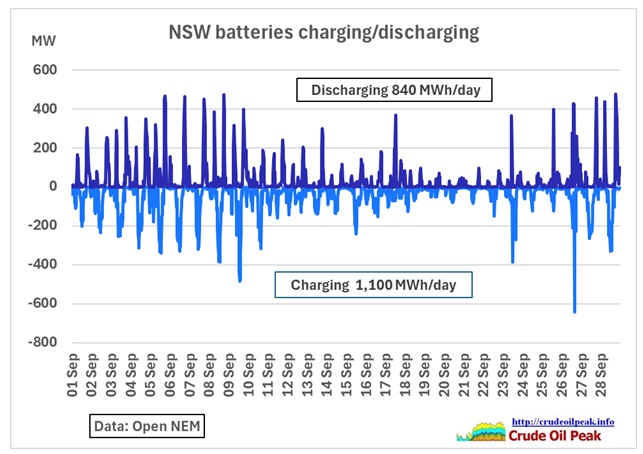 Fig 14: NSW batteries charging and discharging
Assuming that storage levels at the beginning and end of September were the same, the efficiency of charging/discharging cycles was 76%.
To be continued in part 2