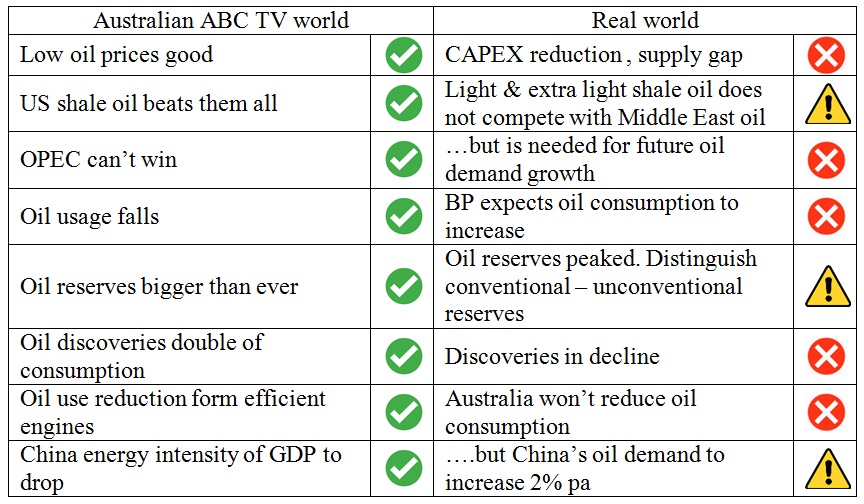
On the 7 pm news of Friday, 26/5/2017, with 610K viewers, ABC TV quoted from BP’s Energy Outlook 2017 by cherry-picking parts of graphs, giving viewers the impression that there are no future oil and fuel supply problems. The public broadcaster is therefore responsible for contributing to shape an ill-informed societal mindset which enables State and Federal governments to build additional oil dependent infrastructure.
First, we do the transcript (funding cuts!) from the news item “Oil prices slide despite extension of production cut agreement”
PHIL LASKER: Well, the good news is that petrol costs are coming down. The roller coaster ride you see in the Brent crude price since February represents the hopes and dreams of all oil traders. They pushed prices up on the back of OPEC and Russian production cuts only to realise that every time they do so US shale oil producers ramp up production so OPEC just can’t win.
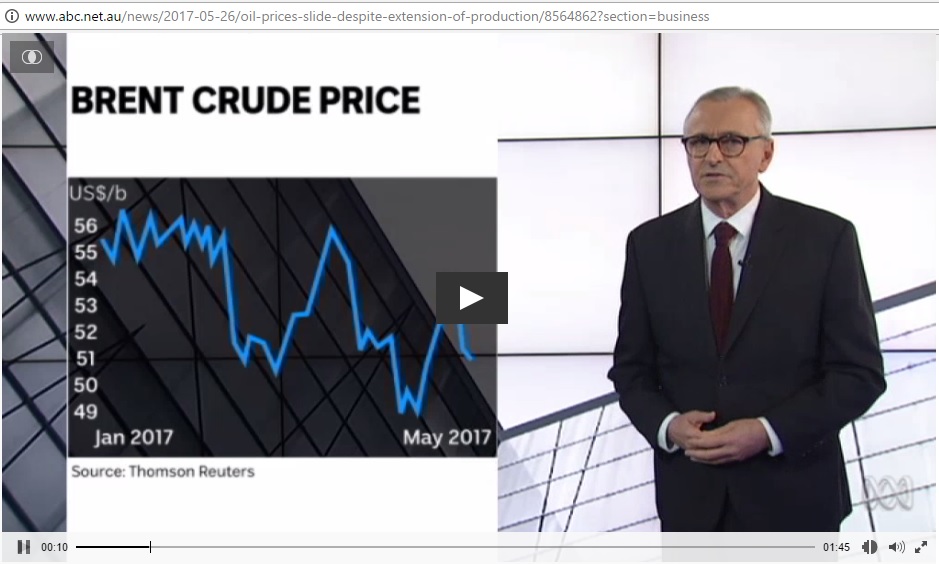
Fig 1: Finance presenter Phil Lasker reading from script prepared by whom?
The Cartel has agreed to extend its cuts for 9 months but traders were expecting deeper reductions. So crude prices took another hit along with iron ore.
The bad news is that the Australian share market followed suit. Energy stocks fared worst….
OPEC is grappling with this: the expected decline in oil’s share in energy markets over the next 20 years
The world’s proven oil reserves are actually getting bigger while oil usage falls. BP reckons that for every barrel of oil consumed more than 2 new barrels have been discovered.
You might think it’s all about electric vehicles but the big reductions in oil use will come from more fuel efficient engines because even though the number of electric vehicles is forecast to grow from 1 million to 100 million it’s still only a small part of the global car pool of nearly 2 billion vehicles.
Here is another major change. China’s transition from a country with a huge industrial base where energy intensity was high to a services and consumer oriented economy with a much lower energy requirement
http://www.abc.net.au/news/2017-05-26/oil-prices-slide-despite-extension-of-production/8564862?section=business
Let’s go through these statements one by one.
(1) Low oil prices good news
But only for a while. Lower oil prices have reduced the oil industry’s financial capacity to invest in new oil projects.
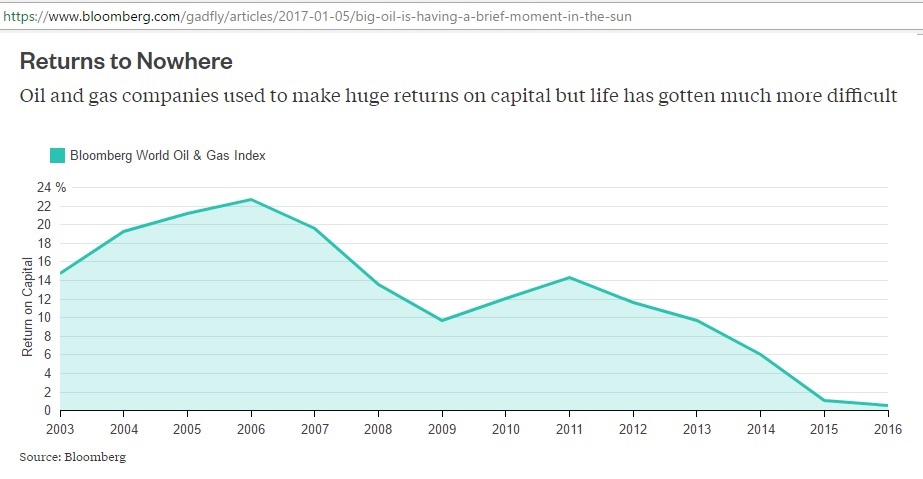 Fig 2: Return on capital in oil and gas industry
https://www.bloomberg.com/gadfly/articles/2017-01-05/big-oil-is-having-a-brief-moment-in-the-sun
Oil’s return on capital peaked – you guessed it – when conventional oil production started to peak (under Howard’s watch).
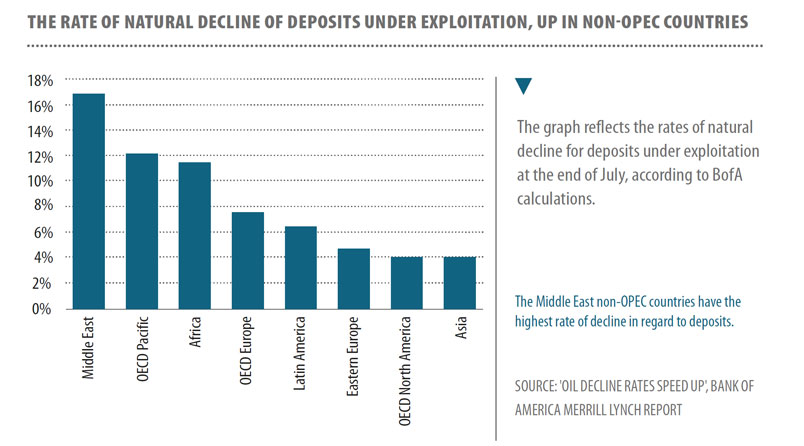
Fig 3: Oil decline rates in various countries
http://petroleumreview.eu/pros-and-cons-revival-time-for-oil-and-gas-industry/
Natural oil decline rates require continuing investments just to maintain oil production at current levels. That’s why the IEA warned in March:
6/3/2017
HOUSTON – Global oil supply could struggle to keep pace with demand after 2020, risking a sharp increase in prices, unless new projects are approved soon, according to the latest five-year oil market forecast from the International Energy Agency.
https://www.iea.org/newsroom/news/2017/march/global-oil-supply-to-lag-demand-after-2020-unless-new-investments-are-approved-so.html
(2) Every time OPEC and Russia cut production US shale oil producers ramp up
In Fig 1, oil prices went down 3 times over a period of 5 months. Was shale oil production ramped up 3 times in such a short period? That never happened.
First, let’s look for these OPEC production cuts.
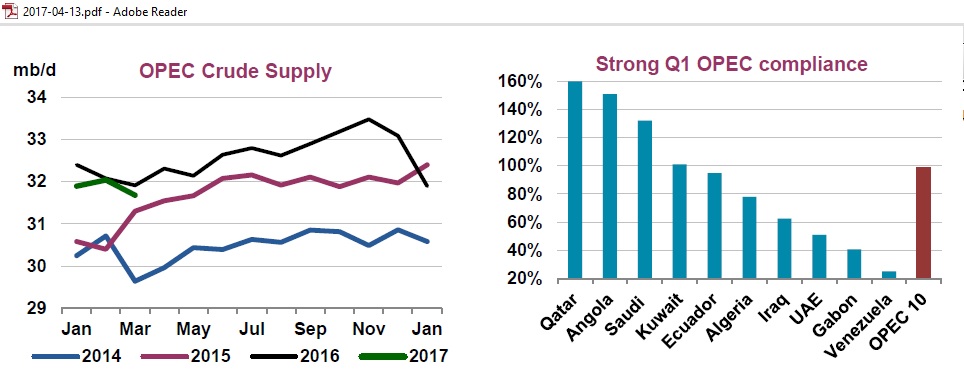 Fig 4: OPEC year-on-year crude supply and production cut compliance
We can assume that OPEC increased production ahead of the meeting in November to get the best possible starting point for the reference month of October. Production is now back to levels seen a year ago. These are the numbers by OPEC member:
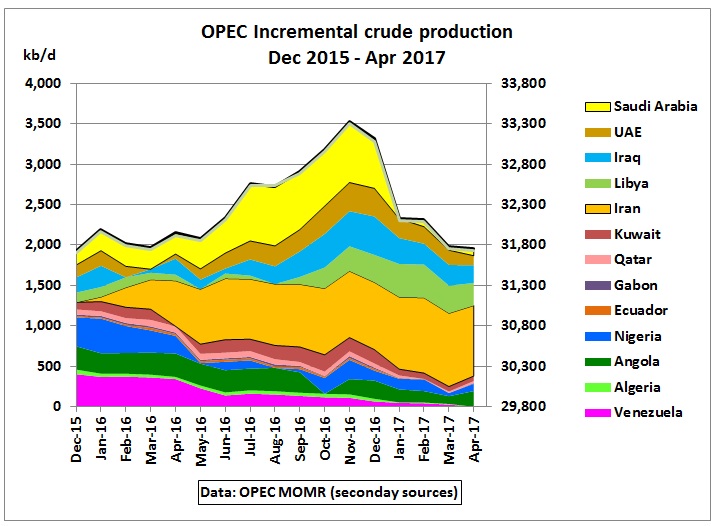 Fig 5: OPEC’s Incremental crude production
http://www.opec.org/opec_web/en/publications/338.htm
Incremental production is the production above the minimum for the period considered. We see that there are countries in decline anyway like Venezuela, Angola and Nigeria (although not included in the announced cuts, together with Libya). Reductions from Algeria, Qatar, Ecuador and Gabon are symbolic. Iran increased production after sanctions were lifted. The only country which did a big cut was Saudi Arabia.
Let’s compare that with US crude production which is taken from here: US field production of crude oil https://www.eia.gov/dnav/pet/hist/LeafHandler.ashx?n=pet&s=mcrfpus2&f=m
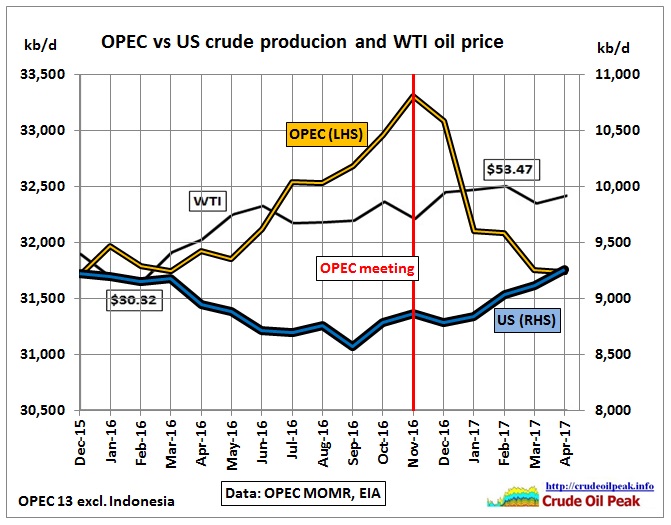 Fig 6: OPEC vs US crude production and WTI oil price
In April 2017 both OPEC and the US reached approximately the same production level they had in December 2015. Note the range on the graph for both OPEC (LHS) and the US (RHS) is 3,000 kb/d. The range for US production is shifted up in such a way that we have the same starting point in Dec 2015, one year before OPEC’s production cuts.
After its low point in September 2016, US production had increased in April 2017 by 690 kb/d, 44% of OPEC’s production cut. And oil prices stayed around the $50 level.
For US production (changes mainly from shale oil) there was a time lag of 7 months between an increase in oil prices and a turn-around in the decline after the 2015 peak. That is pretty good. But there is no evidence of short response times to monthly oil price changes as shown in Fig 1. The reader may also judge whether OPEC has “won” or not.
What’s worse in the ABC TV story: it doesn’t understand that US light and extra light shale oil including condensate (API>40) do not directly compete with much of OPEC’s crude oil which has different characteristics.
 Fig 7: Virtually all of US production increase is >40 API
https://www.eia.gov/todayinenergy/detail.php?id=21512
 Fig 8: Grades of crude oil
How about Russian production cuts?
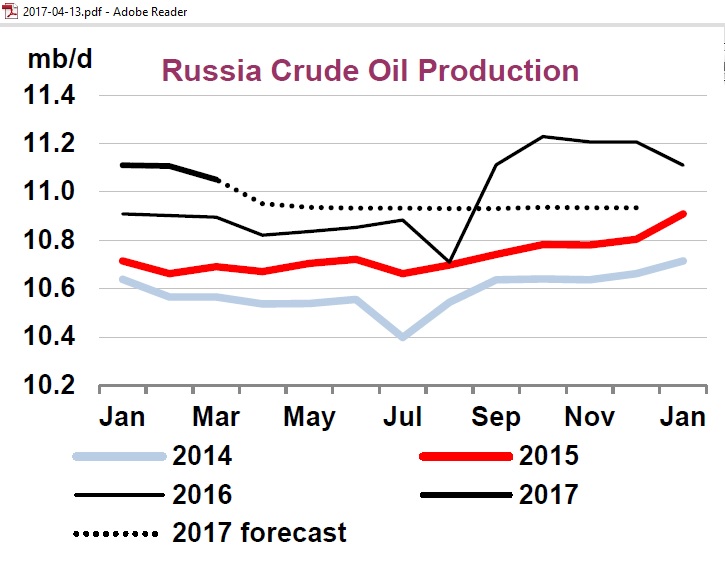 Fig 9: Russia’s crude production year-on-year
https://www.iea.org/oilmarketreport/omrpublic/
A comparison of year-on-year production includes seasonal fluctuations. We see there is a summer low (maintenance in preparation for the harsh winter). In 2015 the increase after summer was around 200 kb/d, but in 2016 it was 500 kb/d. So we can guess that Russian production was also lifted before the baseline month of October 2016 in expectation of joining OPEC’s production cut. The dotted line for 2017 indicates that production would soon be back to 2016 levels in the same season.
(3) OPEC grappling with decline of oil’s share in energy mix
Phil showed this graph:
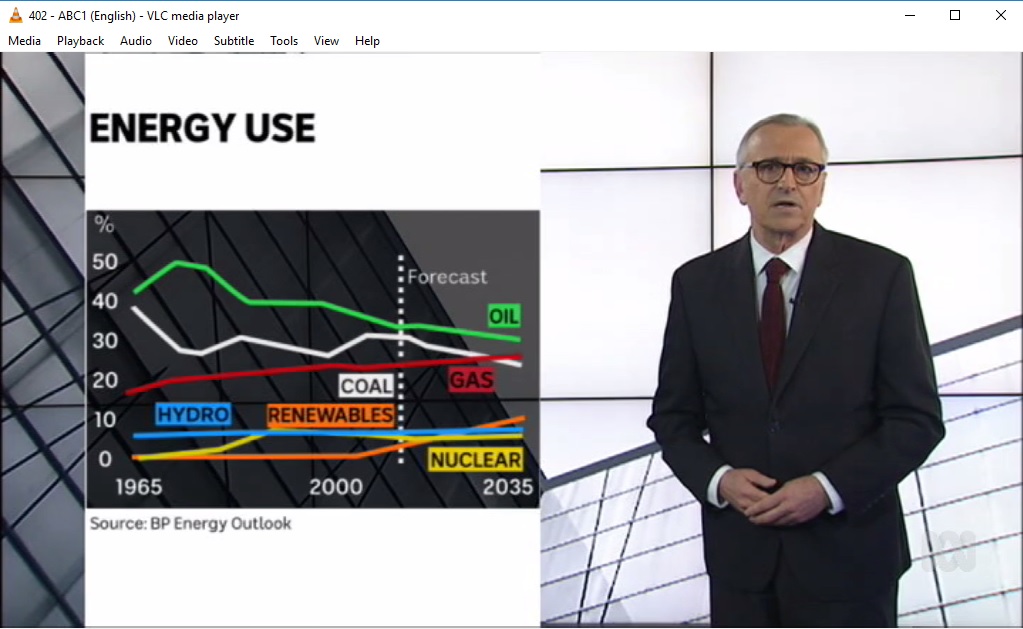 Fig 10: Oil’s share of energy use declining since the 1970s oil crises
The graph has been picked from BP’s Energy Outlook 2017, slide 14, right panel:
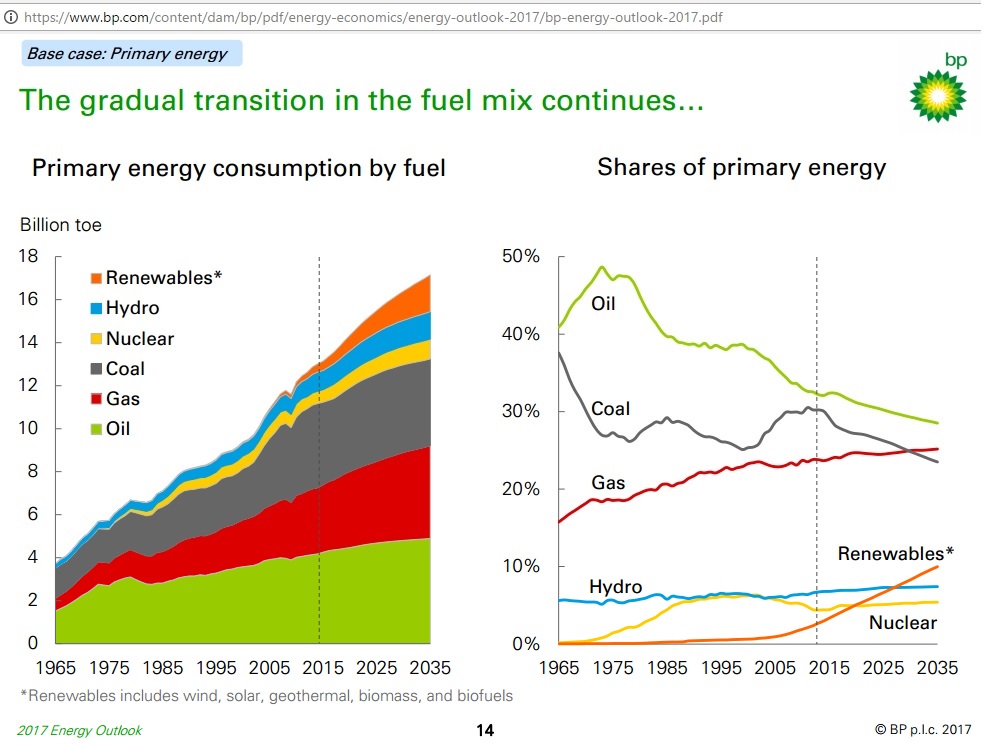 Fig 11 : BP’s idea of primary energy consumption and share by fuel
https://www.bp.com/content/dam/bp/pdf/energy-economics/energy-outlook-2017/bp-energy-outlook-2017.pdf
BP assumes oil consumption increases, despite oil’s share falling. Oops, Phil’s argument kicked an own goal.
(4) Oil reserves bigger while oil usage falls
Well, according to BP oil consumption does not fall, it increases (Fig 11).
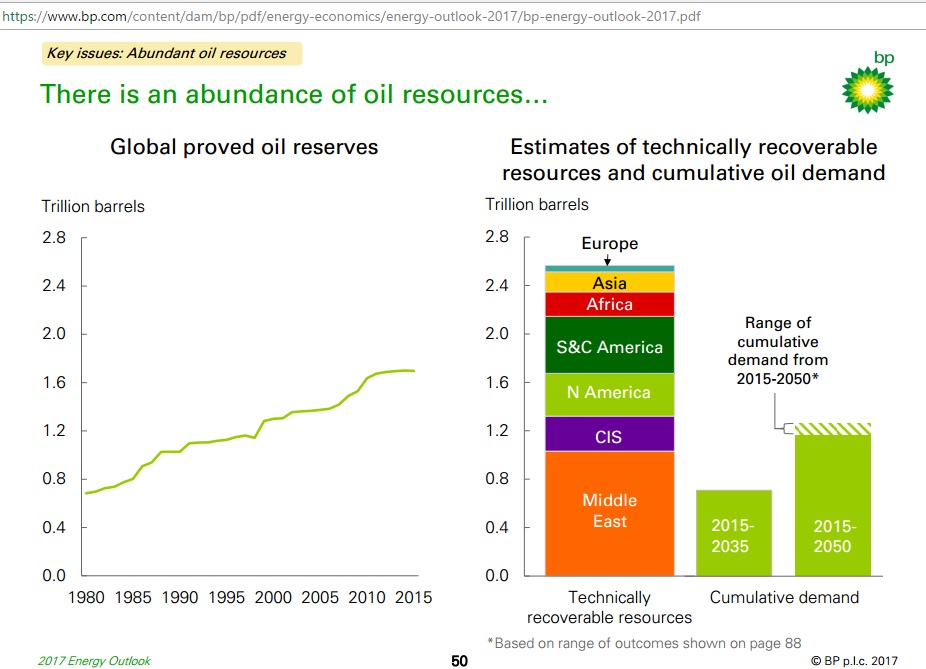
Fig 12: BP’s estimate of global oil reserves and resources
We can see on the left panel that “proved” reserves seem to peak at around 1,700 Gb, they are not getting bigger as claimed. And the right panel shows 38% of technically recoverable resources are from the Middle East. Not the end of OPEC.
It is also not clear at which prices these resources can be produced. We now know that $100/barrel is too high for the world economy. The following article calculated how much oil reserves we have depending on the oil price:
19/8/2016 Oil reserves and resources as function of oil price
http://crudeoilpeak.info/oil-reserves-and-resources-as-function-of-oil-price
(5) For every barrel of oil consumed more than 2 new barrels have been discovered
This statement is taken directly from slide 51 of BP’s report. BP calculated for the period 1980-2015 as follows:
(Reserve additions + cumulative production) / cumulative production =
(1,698 Gb – 683 Gb + 949 Gb) / 949 Gb = 2.07
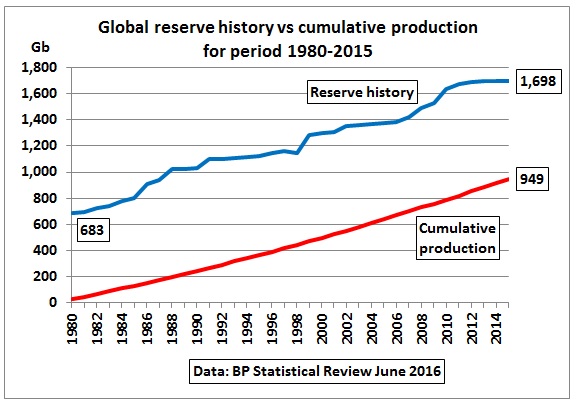 Fig 13: Global reserve history and cumulative production for last 35 years
The reserves include slow-to-produce tar sands in Canada and extra heavy oil from Venezuela. OPEC reserves contain 300 Gb of resources http://crudeoilpeak.info/opec-paper-barrels
There are huge regional variations. Let’s do the above exercise for Asia:
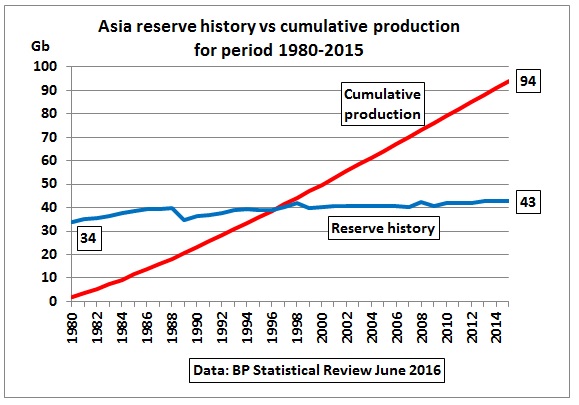 Fig 14 : Asia reserve history and cumulative production for last 35 years
(Reserve additions + cumulative production) / cumulative production =
(43 Gb – 34 Gb + 94 Gb) / 94 Gb = 1.1
That’s almost from hand to mouth. Reserves are equivalent to 3.6 years of annual consumption at 11.8 Gb.
We need to link production to reserves (research done in 2012 – to be updated with new data coming next month).
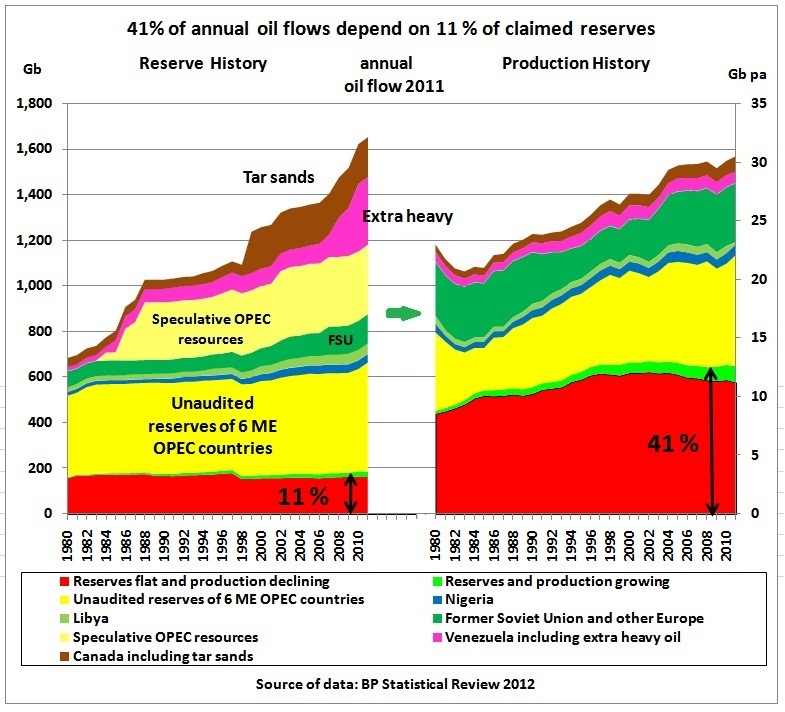 Fig 15: The disconnect between reserves and production
The real picture was given by Bloomberg in this August 2016 graph:
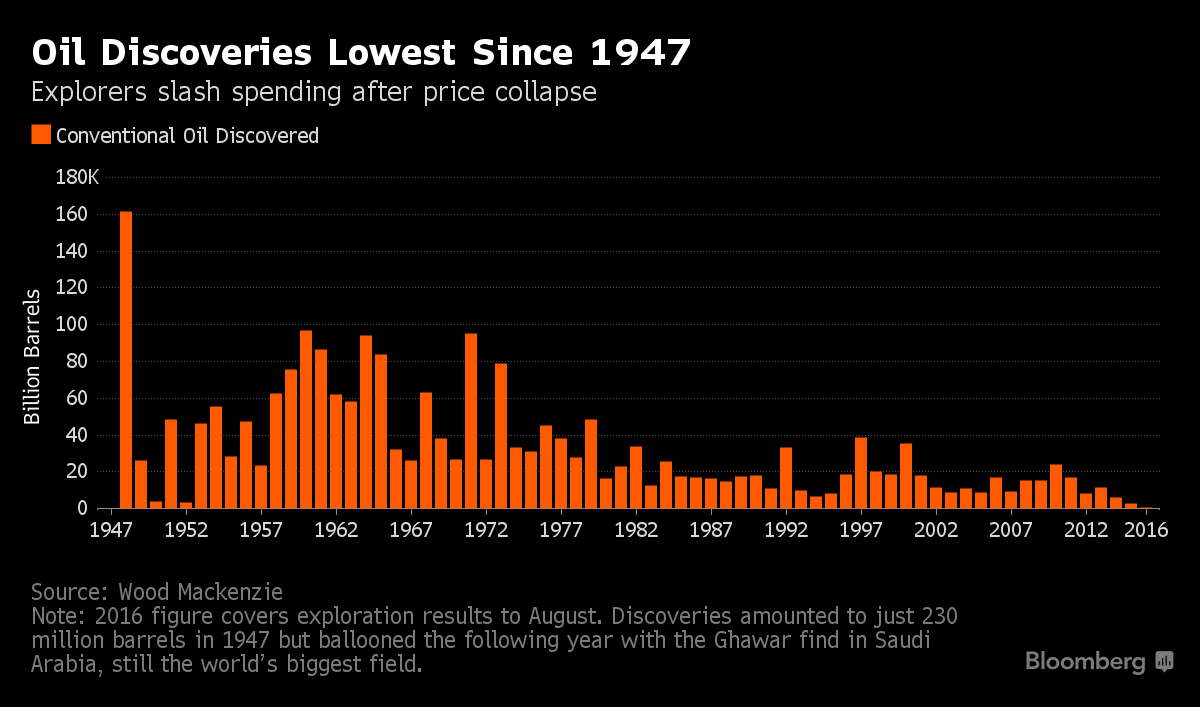 Fig 16: The real world of declining oil discoveries
https://www.bloomberg.com/news/articles/2016-08-29/oil-discoveries-at-a-70-year-low-signal-a-supply-shortfall-ahead
(6) Reduction in oil use from more fuel efficient engines
BP says electric vehicles won’t play a big role when it comes to saving fuel
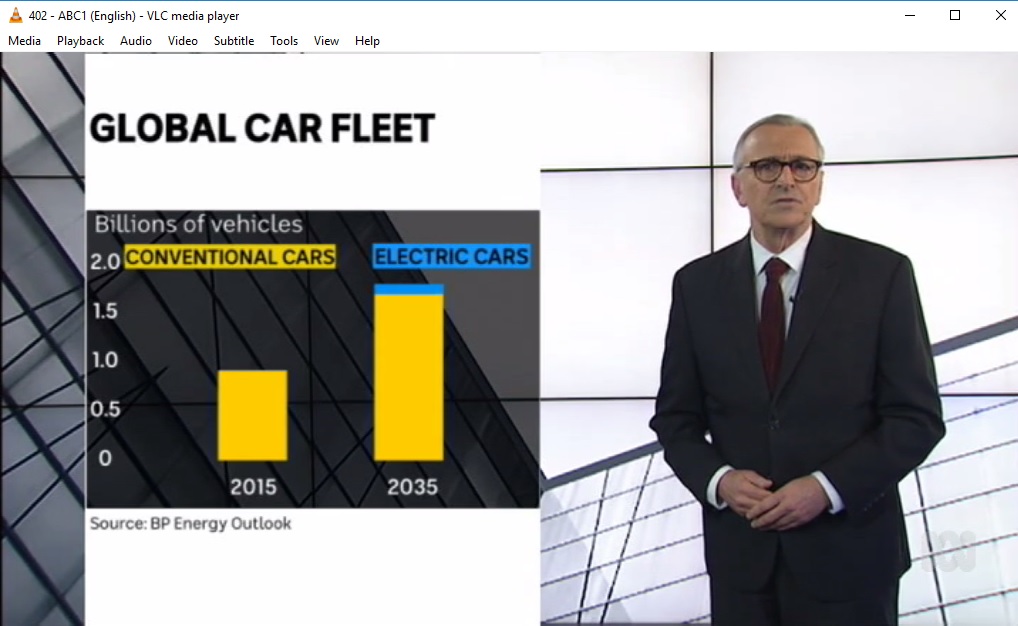 Fig 17: BP assumption: by 2035electric cars will make 6% of car fleet
Australia has definitely no intention to save any fuel voluntarily:
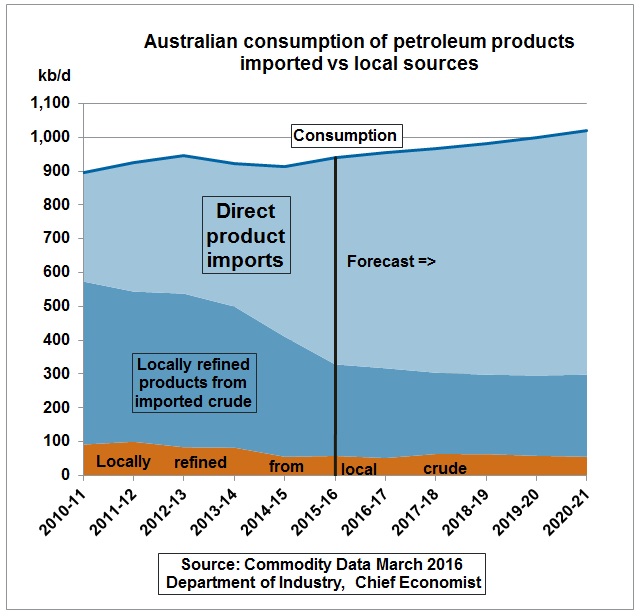 Fig 18: Forecast of Australian consumption of petroleum products
(7) China’s consumer society
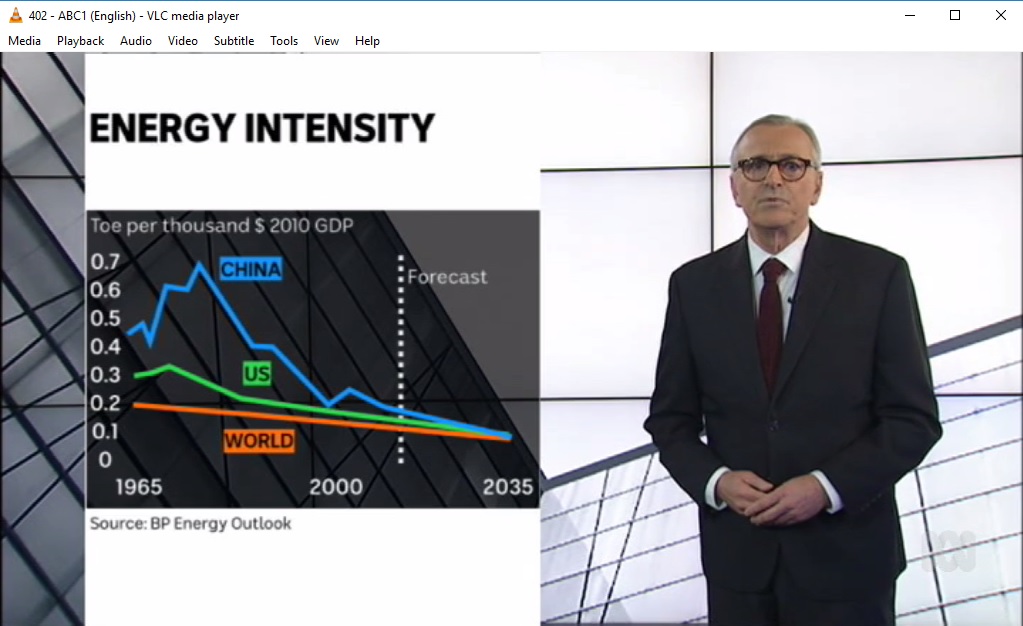 Fig 19: Trends in energy intensity
We can see that most of the reduction in energy intensity of China’s GDP has already been done. Future improvements are assumed at 3% pa. More importantly, BP estimates that China’s total primary energy demand will still grow at around 2% pa, assuming a 5% GDP growth. And slide 24 tells us where the oil will come from: OECD savings!
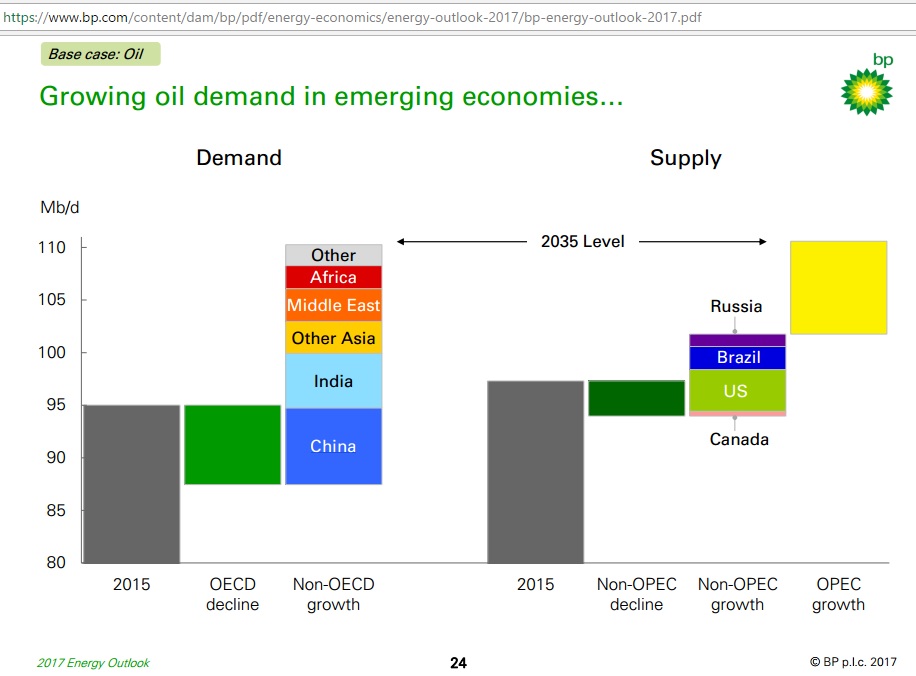 Fig 20: China’s growing oil demand needs OECD savings
Did ABC TV tell its viewers they have to save for China? And that OPEC is assumed to do the heavy lifting? What if OPEC can’t win?
Summary
Conclusion
BP must show perpetual growth for their shareholders. But ABC TV’s shareholders, the Australian taxpayers, are entitled to get a proper analysis of facts.
Related posts:
27/9/2016
ABC TV a true believer in US shale oil supremacy
http://crudeoilpeak.info/australian-public-broadcaster-a-true-believer-in-us-shale-oil-supremacy
30/4/2016
Australian Public Broadcaster ABC unable to look at oil statistics
http://crudeoilpeak.info/australian-public-broadcaster-abc-unable-to-look-at-oil-statistics
There must have been other ABC staff working on this one:
18/9/2012
ABC TV Interview with Richard Heinberg on peak oil and the end of growth
http://crudeoilpeak.info/abc-tv-interview-with-richard-heinberg-on-peak-oil-and-the-end-of-growth
7/4/2012
Australian ABC TV falls into oil and climate trap of unconventional oil
http://crudeoilpeak.info/australian-abc-tv-falls-into-oil-and-climate-trap-of-unconventional-oil
5/4/2012
Proudly powered by oil shale
http://crudeoilpeak.info/proudly-powered-by-oil-shale
7/3/2012
No number crunching in Alan Kohler’s opinion piece on a premature peak oil death
http://crudeoilpeak.info/no-number-crunching-in-alan-kohler-opinion-piece-on-premature-peak-oil-death