In part 1 we found that Treasury did not really explain why global growth is slower than expected given the oil price drop. We looked at some parameters like employment, incomes, investments, capital formation and exploration expenditure.
While doing this research one comes across work done by the Reserve Bank of Australia (RBA) in its series statements on monetary policy entitled “The effects of the fall in oil prices” published in Feb 2015 – when oil prices were approximately at the same level as now. The analysis sums up:
- Petrol prices have fallen by 30% (oil accounts for 50% of final price)
- Positive effect on overall economic growth
- Improvement of terms of trade as net importer of oil but this will be offset by increasing LNG exports (at lower prices)
- Lower cost in transportation and some parts of manufacturing
- Increase in real household disposable income
- Reduction of oil and gas exploration
- Fuel excise not effected much as it is based on volume, not price
- Reduction of headline CPI (automotive fuels have 3.5% share) by ¾%
- Indirect reduction of CPI as oil accounts for 2-3% of non-fuel items
- Oil price movements partly absorbed in margins
- Boost in income tends to increase aggregate demand and put upward pressure on prices
http://www.rba.gov.au/publications/smp/2015/feb/box-c.html
All of the above parameters have different time lags and may work in different directions. The RBA therefore notes that econometric estimates on the impact of oil prices on the CPI have been found to be imprecise.
In the same February 2015 issue of the RBA’s monetary policy series there is an interesting graph on oil imports as percentage of GDP – compared to coal and gas exports.
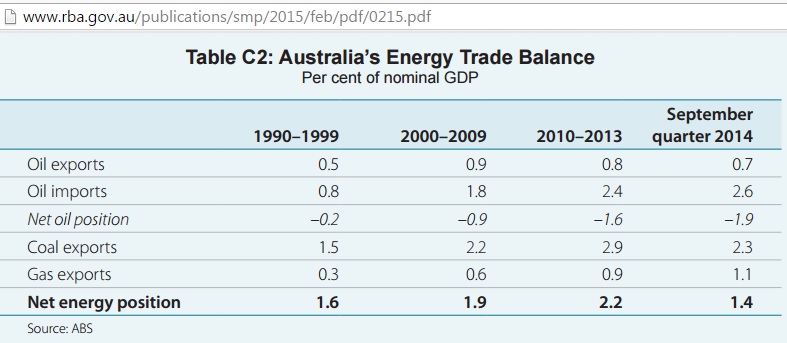
Fig 16: Australia’s energy trade as percentage of GDP
http://www.rba.gov.au/publications/smp/2015/feb/pdf/0215.pdf
We can see that Australia’s coal exports don’t even pay for its oil imports (in 2014).
Oil exports will of course depend on oil production which is in long term decline after its peak in 2000, as shown in the following graph
Going, going, gone…..
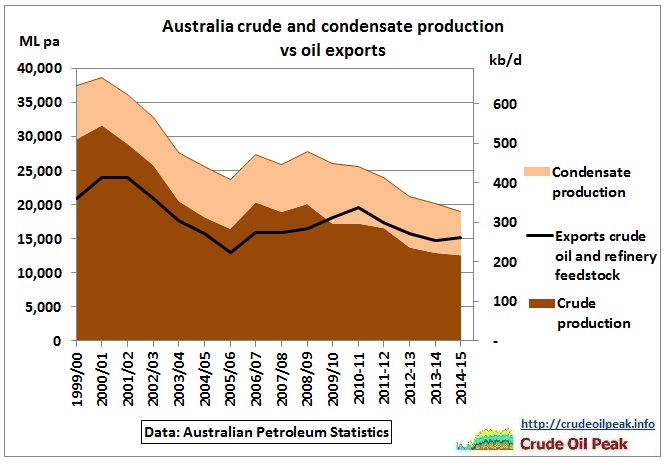
Fig 17: Australian C&C production and exports
Australia has always exported much of its crude oil and practically all of its condensate because Australian refineries are not designed to process all of this light oil. After the closure of 3 refineries the ratio exports to production now stands at 80%.
And that brings us to the next statement in the budget paper 1 :
| Box 5, BP1, p 2-29
Australia is currently a net importer of oil and petroleum products, and Australian households and many businesses are benefiting from the fall in oil prices, primarily through lower prices for automotive fuel which fell around 25 per cent over the past two years (Chart A). |
Comment: This is of course correct but Treasury does not analyse the impact of Australia’s increasing physical dependency on oil/fuel imports. Let’s have a look at how far down the net-importer slope Australia has come:
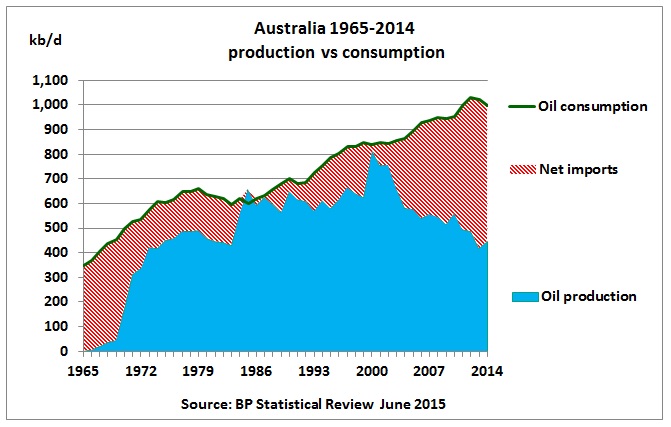
Fig 18: Australia’s long-term trends as net oil importer
The Department of Industry expects oil consumption to grow between 1.5% and 1.9% pa until 2021 after a dip in 2014, although Australian Petroleum Statistics for the first three quarters of 2015/16 show only a y-o-y growth of 0.6%.
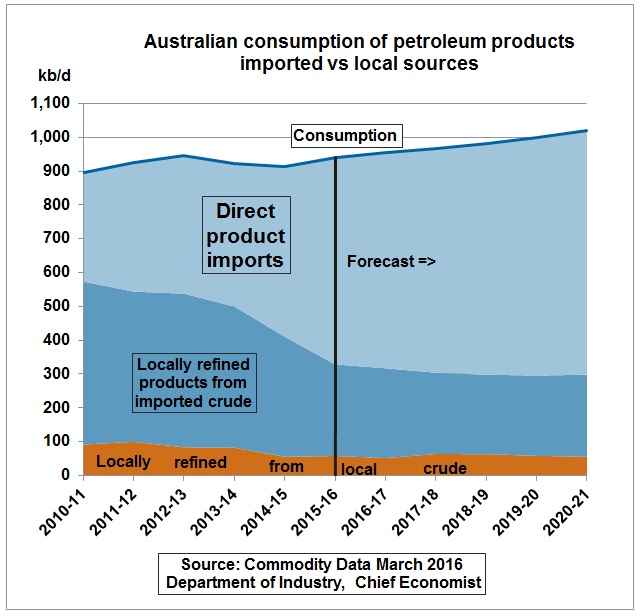
Fig 19: Australian fuel consumption by source
We can see that locally refined fuels from imported crude oil have sharply dropped as 3 refineries have closed:
Sep 2012 Clyde in Sydney (Shell, 85 kb/d)
Oct 2014 Kurnell in Sydney (Chevron, 125 kb/d)
May 2015 Bulwer in Brisbane (BP, 102 kb/d)
This has increased Australia’s oil vulnerability because crude oil imports come from at least 10 different countries while fuel imports are mainly from Singapore, South Korea and Japan, countries which themselves are not crude oil producers and import their crude mainly from the Middle East.
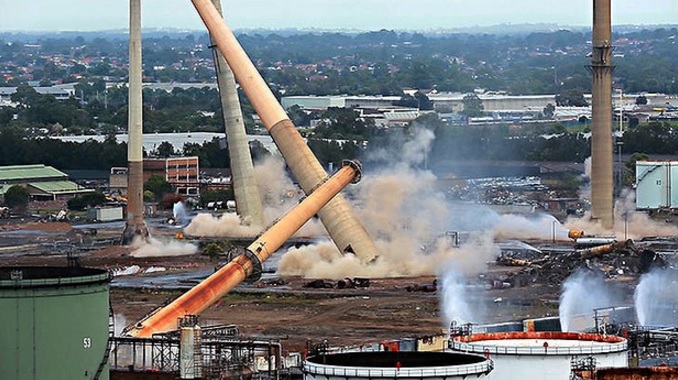
Fig 20: Chimneys of Shell refinery in Clyde/Sydney detonated Feb 2016
There could be no better symbol for oil decline than the detonation of the Clyde refinery chimneys while the budget 2016 was prepared.
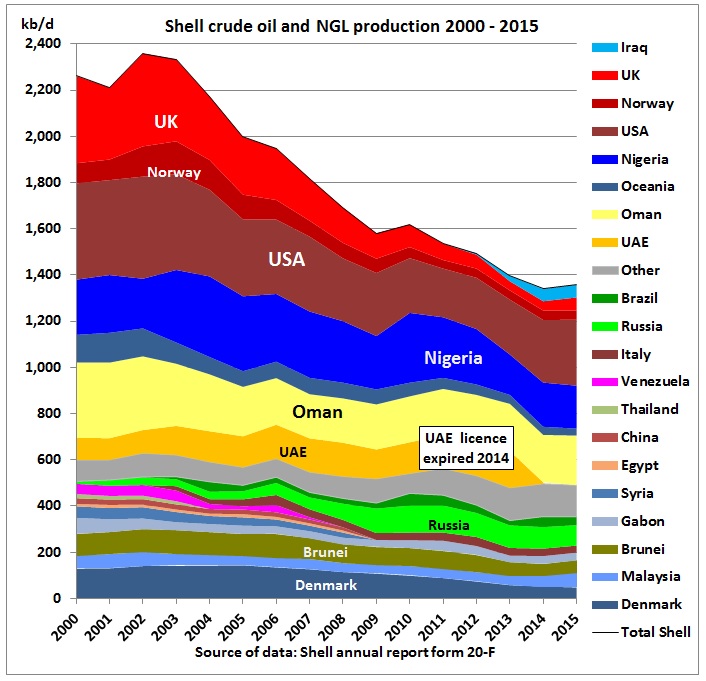
Fig 21: Shell peak oil
The public is told that Australian refineries are closing because larger, modern Asian refineries work more efficiently and have an advantage of economies of scale. But that Shell’s oil production has peaked is ignored. BP and Chevron have also peaked.
Instead of analysing the increasing gap between oil imports and production (and taking appropriate infrastructure decisions) the Budget paper is concerned about lower LNG export prices.
| Statement 2 Economic Outlook in Budget Paper BP1 (p 2-4)
“A sustained drop in oil prices, however, would affect the price of LNG exports going forward as they are linked to oil prices through long-term contracts” (p 2-22) “Additionally, as LNG projects are very capital intensive, the sector is expected to have deductions (such as depreciation) that reduce their tax liabilities in the short to medium term. This, and the high level of foreign ownership in the sector, will reduce the impact that any profits would have on Australia’s national income.” |
The budget paper then shows a graph with actual and forecast LNG production
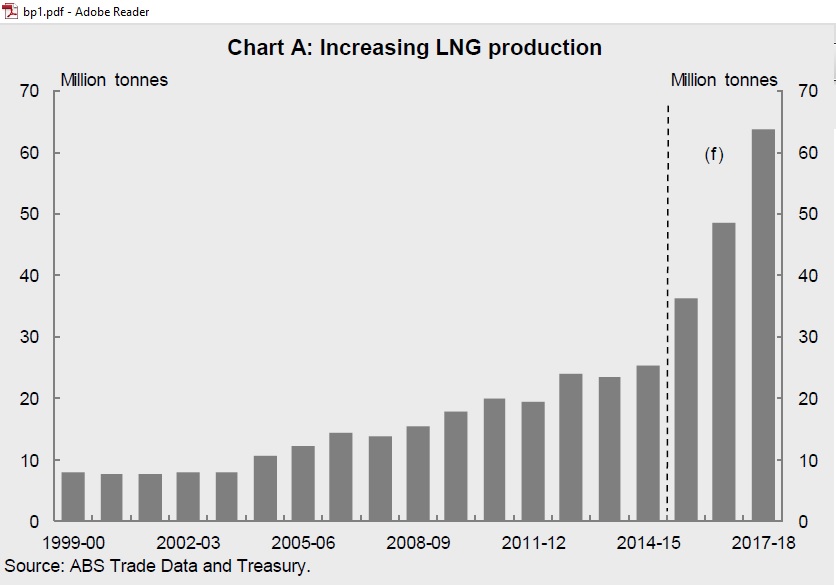
Fig 22 Australia’s LNG production (in Budget paper 2016, BP , p 2-22)
Comment: The Federal Reserve Bank mentioned the above problems already in a March 2015 report entitled:
Australia and the Global LNG Market
“The ramp-up in LNG production will boost Australian output and incomes over the next few years; however, the effect on Australia’s living standards will be lessened to some extent by the high level of foreign ownership and the relatively low labour intensity of LNG production.”
http://www.rba.gov.au/publications/bulletin/2015/mar/pdf/bu-0315-4.pdf
This RBA report also contains this more detailed graph showing the different projects:
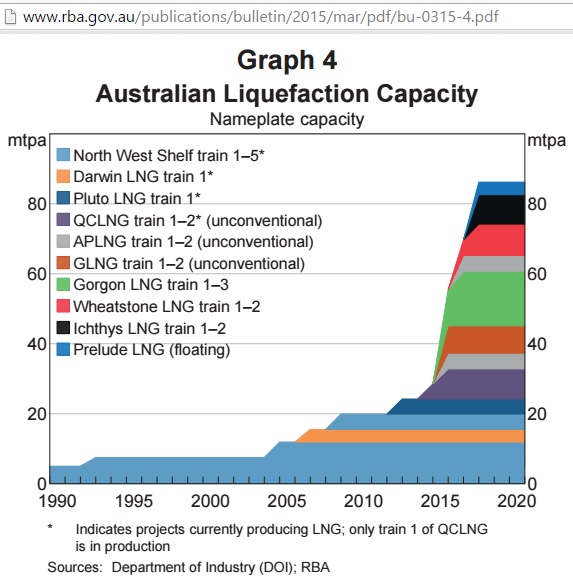
Fig 23: Australian liquefaction capacity (currently producing and under construction)
http://www.rba.gov.au/publications/bulletin/2015/mar/4.html
In future, a quarter is coming from coal seam gas. The report sums up:
“Channels through which LNG Production Affects the Australian Economy
- LNG investment contributed an estimated ¼ percentage point on average to Australian annual GDP growth between 2008 and 2013, once the high share of imported inputs used to construct these projects is taken into consideration.
- As the projects begin to ramp up production, the Bank currently estimates that LNG exports will contribute around ¾ percentage point to GDP growth in 2016/17.
- As production of LNG gradually stabilises at a higher level, the boost to GDP growth will dissipate although GDP will remain at a higher level.
- This means that LNG will have an increasingly important bearing on Australia’s terms of trade over the next few years
- While changes in the terms of trade do not directly affect real GDP, they will affect the purchasing power of domestic income
- Real net national disposable income (real NNDI) attempts to adjust real GDI for these effects. While it is difficult to gauge the share of foreign ownership of the LNG industry, it is estimated to be substantial. This suggests that a sizeable portion of profits will flow to foreign investors.
- The effect of changes to domestic gas prices resulting from increased LNG production for export markets will offset some of these factors on real household incomes
- Federal government revenue will increase via corporate tax income and the petroleum resource rent tax”
http://www.rba.gov.au/publications/bulletin/2015/mar/pdf/bu-0315-4.pdf
2 months later, the RBA in its May 2015 Statement on Monetary Policy calculated that in the coming years the value of LNG exports will exceed the cost of oil imports 2-fold (Fig 24).
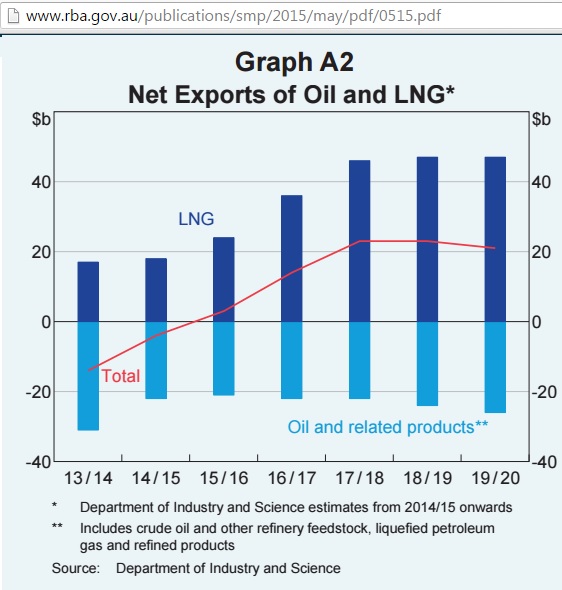
Fig 24: RBA’s estimate of oil imports vs LNG exports
The RBA made following price assumptions:
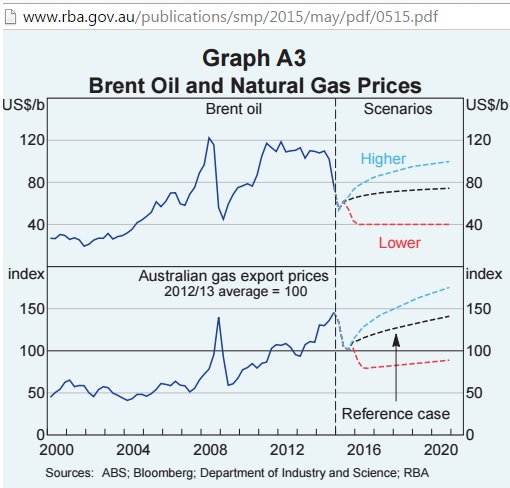
Fig 25: RBA’s (May 2015) oil price assumptions
http://www.rba.gov.au/publications/smp/2015/may/pdf/0515.pdf
But then in September 2015 we read:
IEA says profits are a pipe dream for $200b worth of Australian LNG projects
“Six liquefied natural gas projects under construction at a cost of $200 billion will struggle to break even because of the oil price slump, the International Energy Agency said, and there is little prospect of three in the planning stage going ahead.
The agency said even if oil prices recovered and averaged $US60 a barrel for the next few years, Australia’s LNG industry – one of the world’s biggest – will struggle to be profitable.
Singapore-based energy forecaster Fereidun Fesharaki said the economics of the planned LNG projects in Australia are a “tragedy” due in part to over-optimistic expectations that Asian buyers would continue to pay historically high prices.
‘I am looking at oil to average a maximum of $US75 a barrel over the next decade, and even then they just won’t get a rate of return to justify the investment,’ said Dr Fesharaki, a former energy adviser to the prime minister of Iran who has close links with Asian LNG buyers.”
http://www.afr.com/business/energy/oil/lng-projects-face-breakeven-battle-20150905-gjg0r7
LNG prices depend on contracts but these are designed around so called S-curves. Each section in the figure below follows along the simple formula
Price(LNG)= alpha x Price(crude) + constant Price
The parameter alpha is the slope. It varies between the kinks to ensure fair deals when oil prices are either too low or too high.
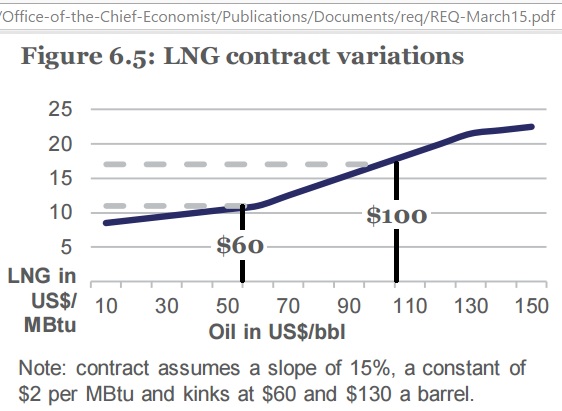
Fig 26: LNG pricing as function of crude oil prices
http://www.industry.gov.au/Office-of-the-Chief-Economist/Publications/Documents/req/REQ-March15.pdf
The Resource and Energy Quarterly March 2016 of the Chief Economist has LNG prices around the $7/GJ mark at the beginning of 2016.
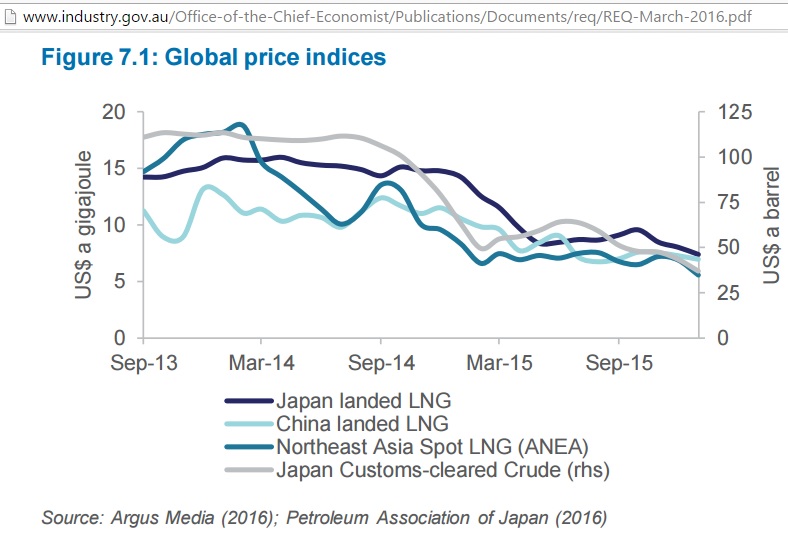
Fig 27: LNG prices (LHS) compared to Japanese crude import prices (RHS)
We see that LNG prices for Japan, China and the spot market which varied widely in 2013/14 have converged in 2015.
Let’s have a look at the latest gas supply projections in AEMO’s “2016 Gas Statement of Opportunities” for the Eastern gas market:
“A reduced drilling program for CSG wells for the LNG projects – assumed to be 85% of the production capacities used in the medium scenario – between 2018 and 2023.
The 2016 GSOO projects that 2P (proved and probable) developed gas reserves will satisfy forecast gas demand until 2019. From 2019, as developed 2P reserves decline, the delivery of new gas reserves from existing fields, and/or the development of fields that are not yet producing gas, will be critical to maintaining sufficient gas supply to meet forecast demand to 2035. A large portion (92%) of 2P undeveloped reserves is forecast to be produced for LNG export. Figure 4 shows, under the medium scenario:
- The volume of gas supply required to meet total domestic and export LNG demand.
- When newly-developed reserves and resources will be required to start production
- That production of 3,729 PJ of possible reserves and contingent and prospective resources will be required to meet gas demand to 2035”
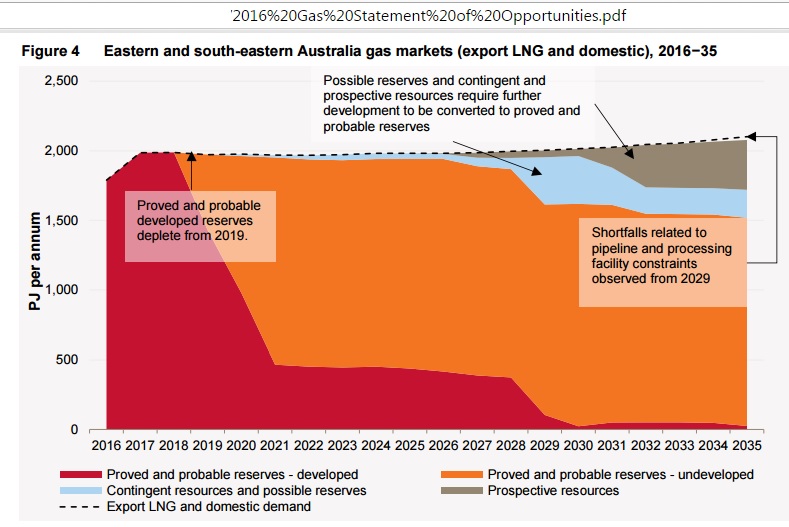
Fig 28: Gas reserves depletion for LNG and domestic demand (medium scenario)
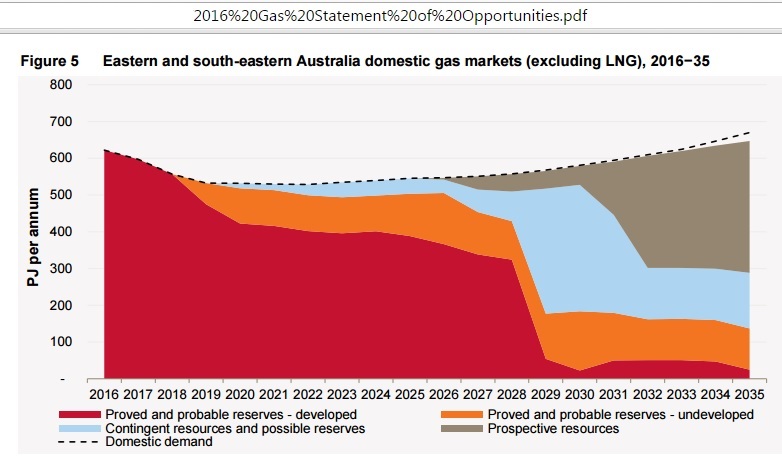
Fig 29: Gas reserves depletion for domestic demand only (medium scenario)
http://www.aemo.com.au/Gas/Planning/Gas-Statement-of-Opportunities
Note the scale of these 2 figures is quite different. So let us combine Fig 28 and Fig 29
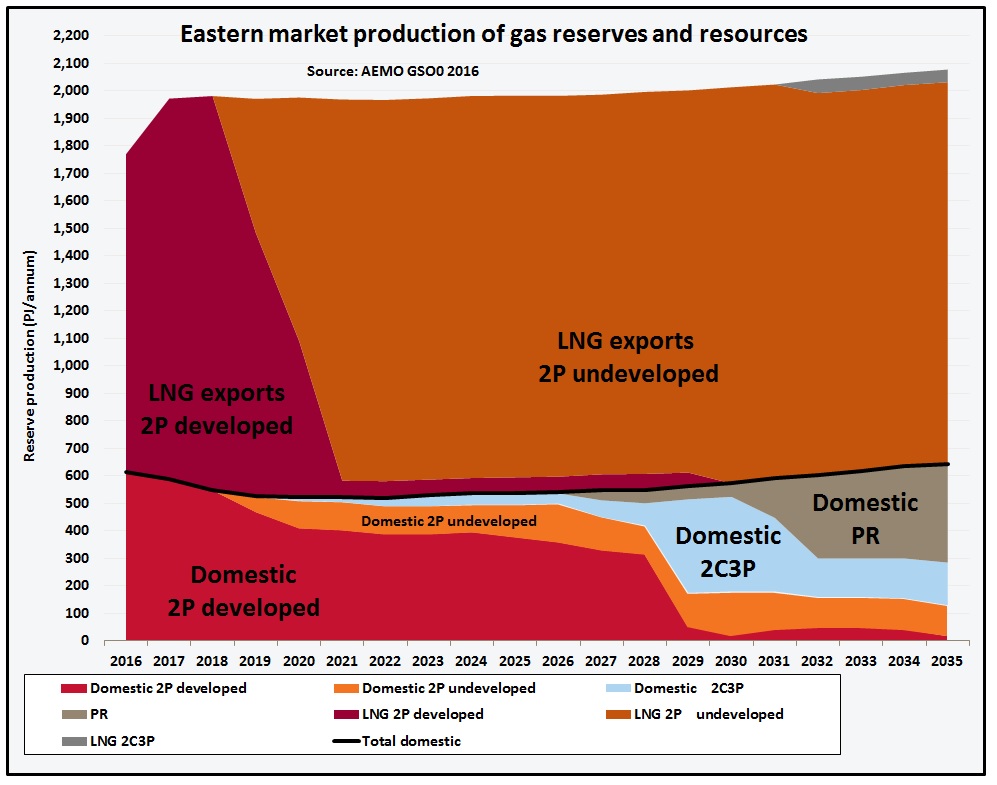
Fig 30: Gas reserves depletion re-stacked for domestic vs LNG comparison
Abbreviations:
2P=proved and probable reserves,
3P=possible reserves incremental to 2P,
2C=sub-commercial resources,
PR=prospective resources (undiscovered)
Graph 30 shows how the preference of LNG results in domestic gas supplies (black line) starting to depend on sub-commercial resources already in the next decade, while 2P reserves are still exported in huge quantities. Domestic gas for the 2030s has still to be discovered. That will negatively impact on the economy (example closure of the Gove refinery in the NT).
There is not one word in the budget on the environmental and therefore ultimately economic damage done by Queensland’s coal seam gas (CSG) industry.
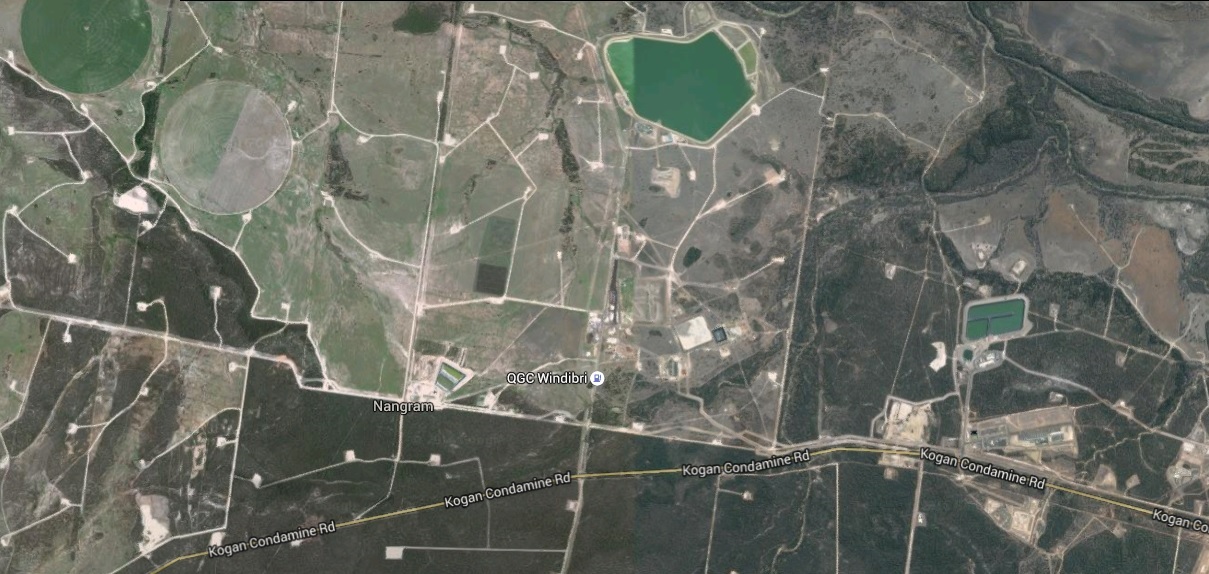
Fig 31: Scarred landscape near Condamine (Google map earth view)
The fast depletion of CSG wells requires the drilling of 40,000 wells in the next decades. Considering that food supply will be more important than LNG exports the future of this industry is even more in doubt
Conclusion: The RBA provided more quantitative analysis on LNG than the budget papers. Treasury is not worried about Australia becoming ever more dependent on oil imports. The focus is on the value of LNG exports cancelling out the negative contribution of oil imports to the trade balance and its macro-economic impact. But since the foreign owners of LNG export terminals use their cash as they must (debt repayments) or wish it is unlikely that much of that revenue will be used to pay for oil imports. When global oil markets disintegrate there is no way LNG can be traded against oil because the LNG destination countries themselves are oil importers. The emperor exports itself energy poor and will be without clothes. It could have been so much different, if gas had been used as alternative transport fuel. Former Prime Minister Howard should have started it. But he did not understand peak oil.