This is an analysis of late summer. Data are taken from Open NEM: http://opennem.org.au/#
The graphs in this post are a bit different from those on the above website
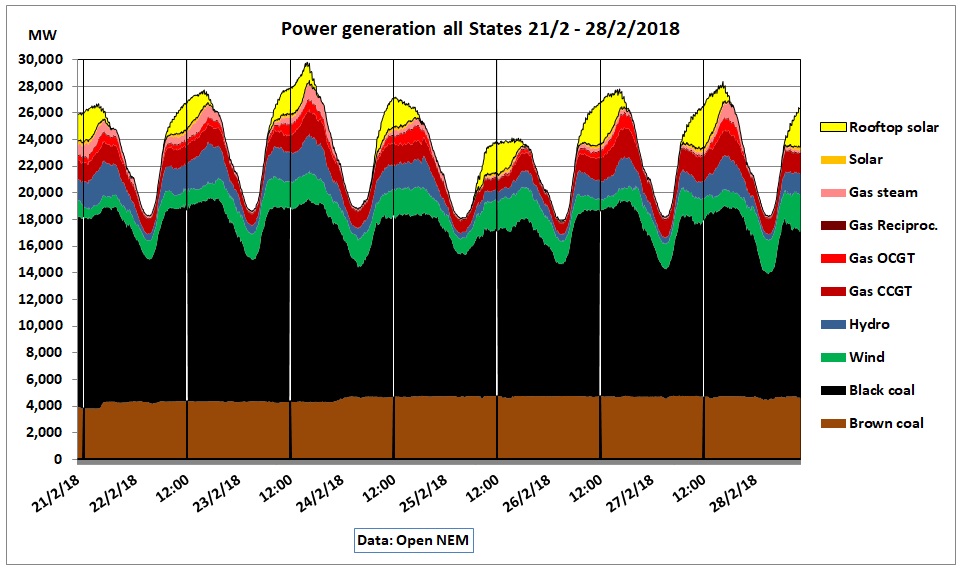
Fig 1: Generation by fuel: 55% black coal, 19% brown coal, 9% gas, 7% wind, 6% hydro, 4% solar
All times shown in NEM time. AEST is one hour later.
The vertical lines show 12:00 noon, the start of hot afternoons. Note that Feb 24th – 25th was a weekend with lower demand.
Coal
Victoria’s inflexible brown coal was running 24/7 at an average of around 4,500 MW, near to capacity of 4,630 MW. The minimum was 3,800 MW on 21/2/2018. There are problems with Loy Yang as reported by The Australia Institute: http://www.tai.org.au/gas-coal-watch
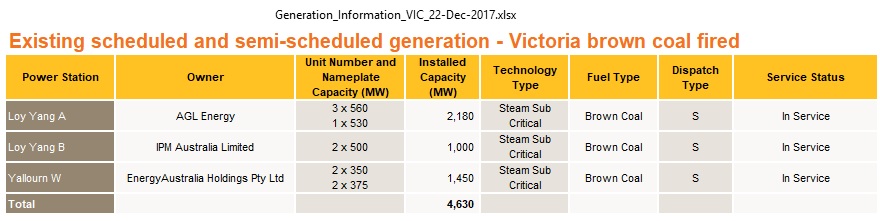 Fig 2: Nameplate capacities of Victoria’s brown coal
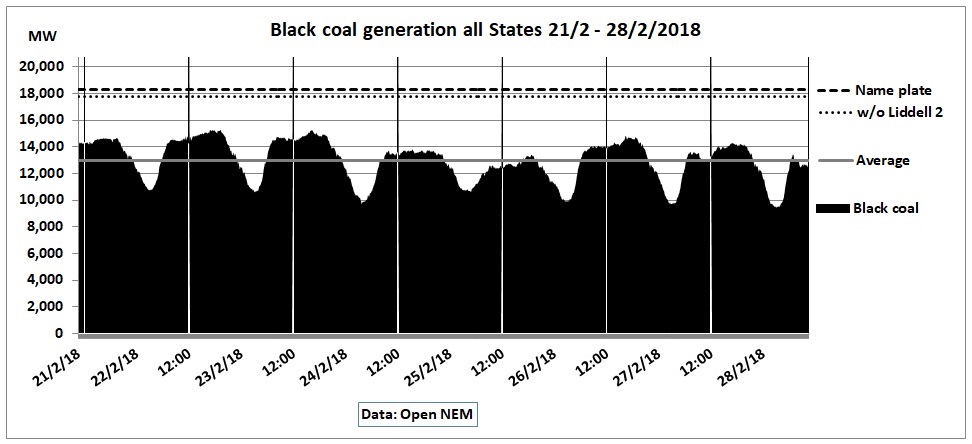 Fig 3: Black coal generation
Black coal had an average generation of 13,000 MW, variable between a minimum of 9,400 MW (at night around 3 am, -27% down from average) and 15,300 MW (afternoon, +18% above average)
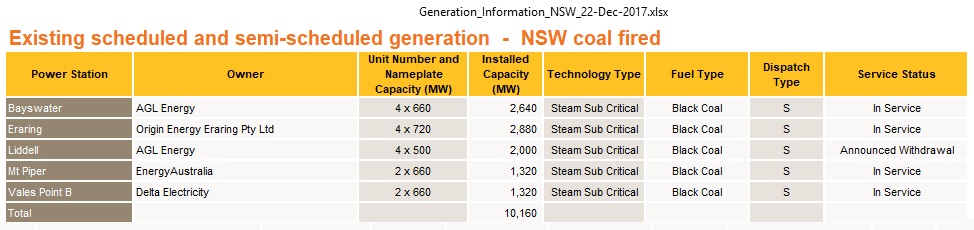 Fig 4: Nameplate capacities of NSW black coal
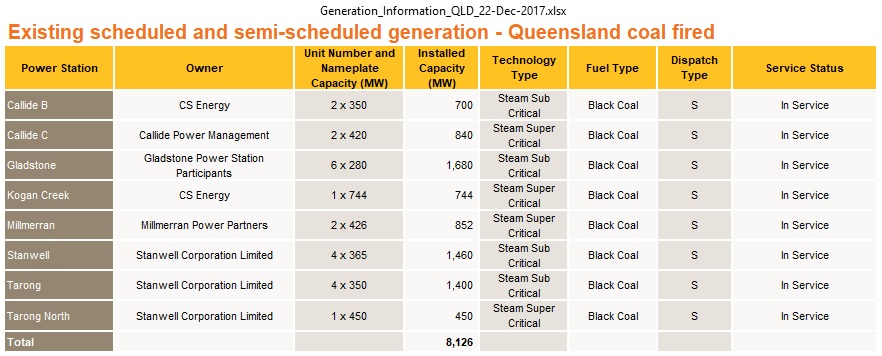
Fig 5: Nameplate capacities of Queensland black coal
During day time, black coal is less variable as shown in this graph:
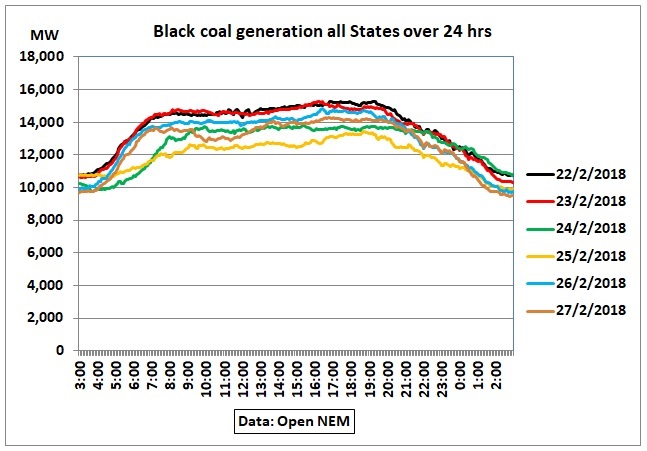 Fig 6: Black coal generation over 24 hrs/6 days
Compared to 7 am power generation at 7 pm was up to 800 MW (average 500 MW) higher or around 4%-6% which is not very peaky.
Wind
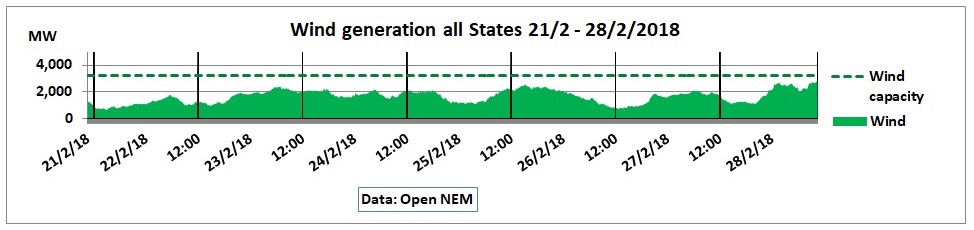 Fig 7: Wind generation
Installed wind generation capacity is 3,205 MW. Actual generation varies between 640 MW (20%) and 2,850 MW (89%) with an average of 1,650 MW
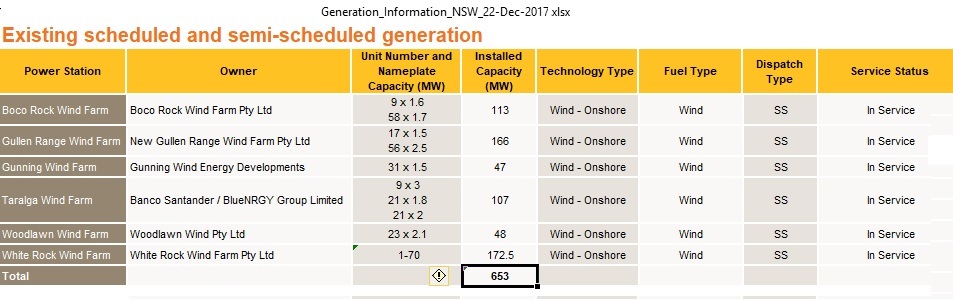 Fig 8: Wind generation capacities in NSW
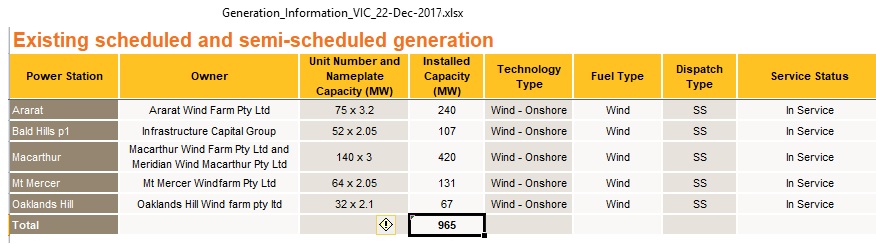
Fig 9: Wind capacities in Victoria
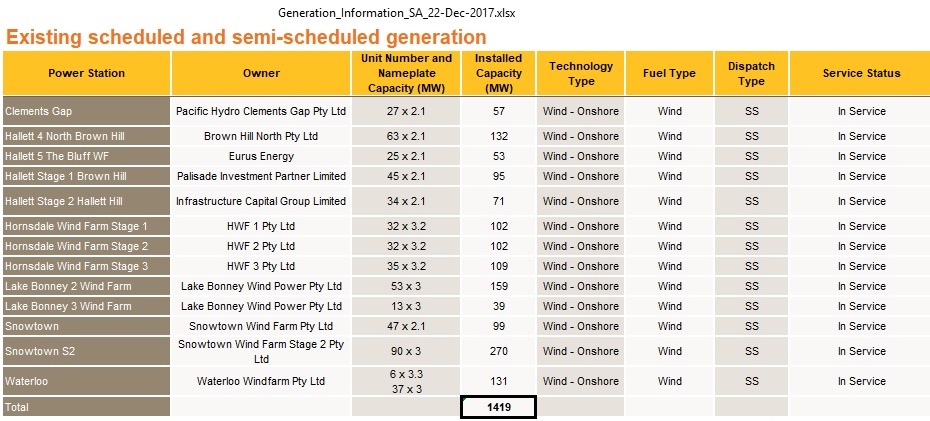 Fig 10: Wind capacities in South Australia
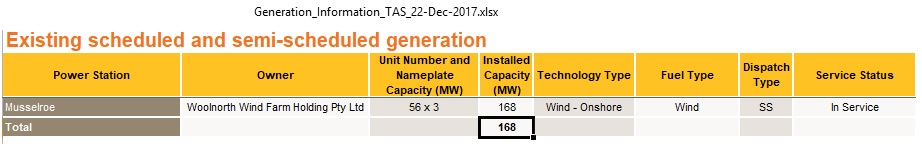 Fig 11: Wind generation capacities in Tasmania
Hydro
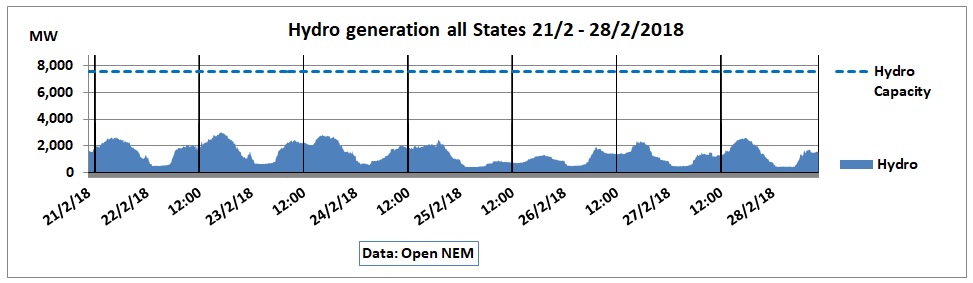 Fig 12: Hydro generation
These are peaking plants. They also serve as emergency back ups which can be quickly ramped up. That’s why actual generation (average 1,440 MW between a minimum of 400 MW and a maximum of 3,000 MW) is much lower than the hypothetical name plate capacity. As pumped storage is only 600 MW off peak the dams would empty quickly if generators were used more often. Output is therefore limited by rainfalls in the catchments.
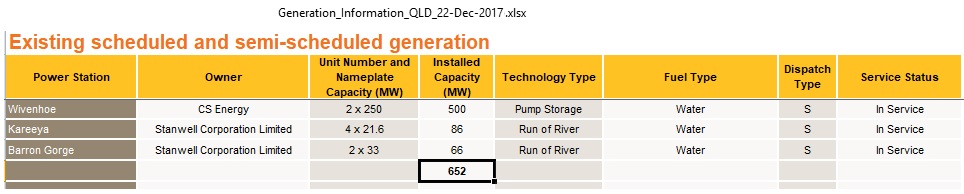 Fig 13: Queensland hydro power capacities
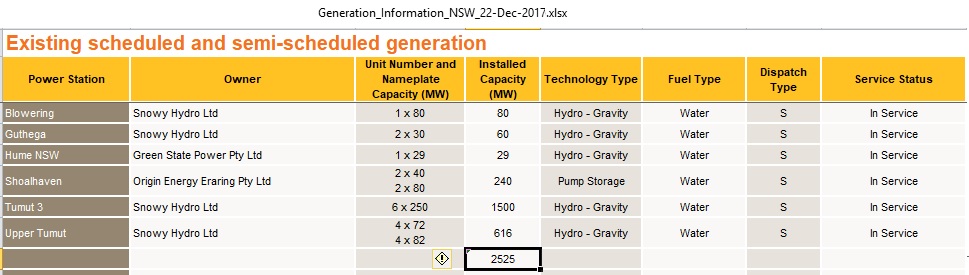 Fig 14: NSW hydro power capacities
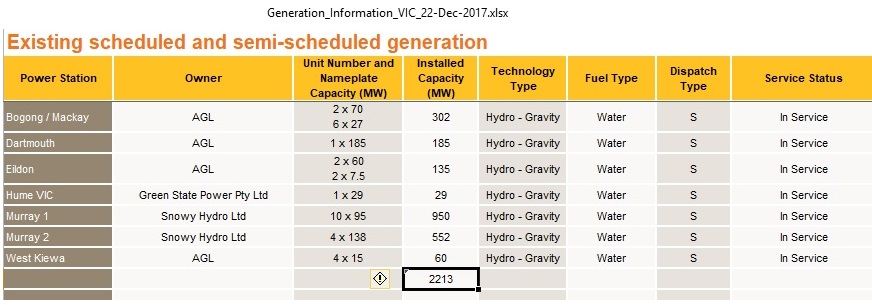
Fig 15: Victoria hydro generation capacities
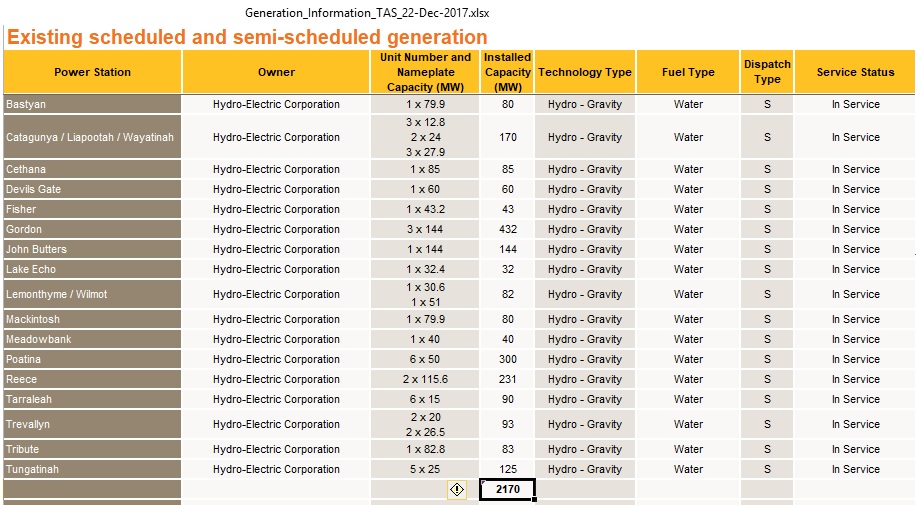 Fig 16: Tasmania hydro generation capacities
Gas
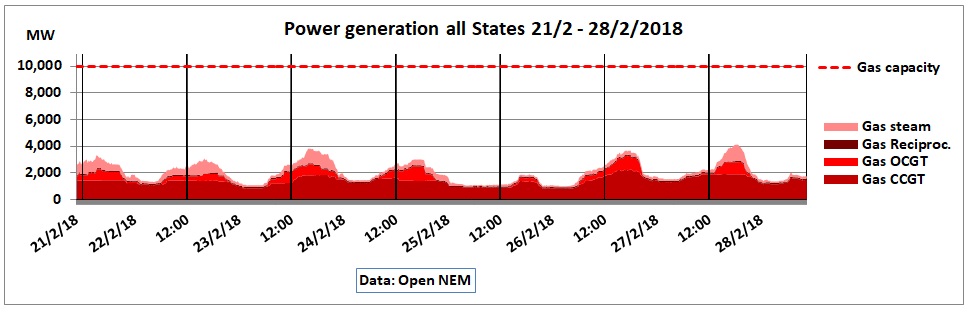 Fig 17: Gas generation (average 2,100 MW between 900 MW and 4,650 MW)
Obviously some gas plants are used for baseload. These are for example in Queensland: Swan E CBM 350 MW, Condamine CBM 75 MW, Moranbah CBM 60 MW, in South Australia: Pelican Point 400 MW, Osborn 140 MW and Tasmania: Tamar Valley 200 MW
But most gas plants are peaking plants, some only used once or twice a week. The gas generation capacity in Fig 17 is therefore hypothetical.
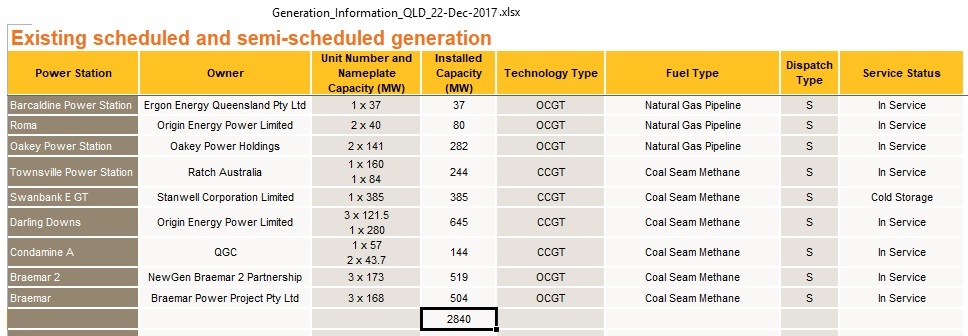
Fig 18: Queensland gas generation capacities
https://maps.dnrm.qld.gov.au/electricity-generation-map/#results
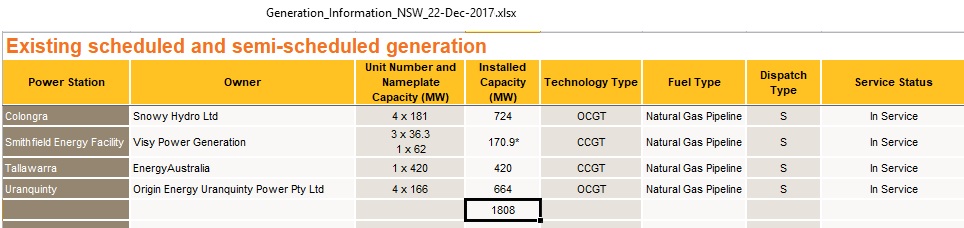 Fig 19: NSW gas generation capacities
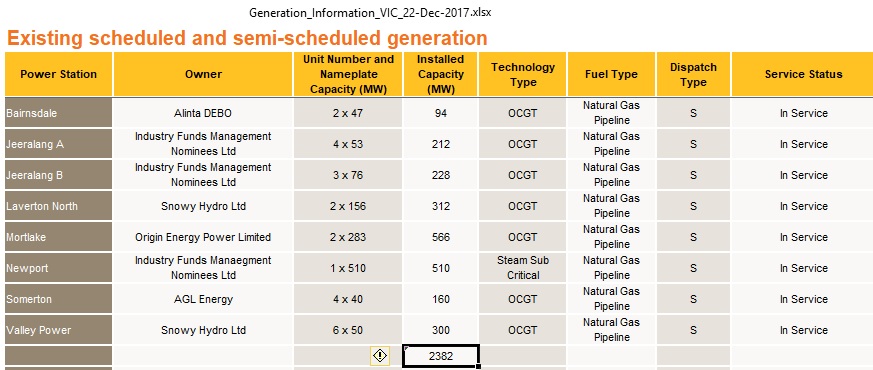 Fig 20: Victoria gas generation capacities
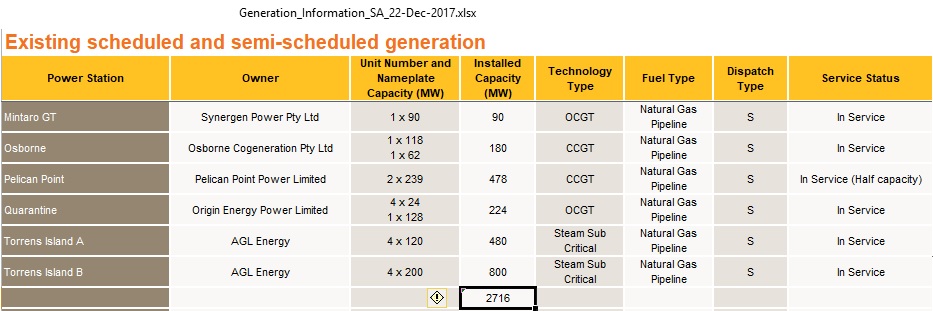 Fig 21: South Australia gas generation capacities
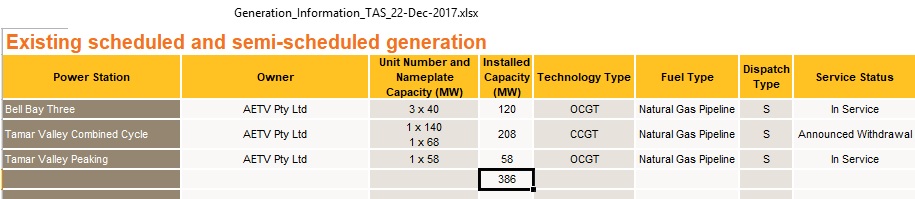 Fig 22: Tasmania gas generation capacities
Impact of solar incl. roof top
Now let’s look at those peak periods in Fig 1. We are interested to know which impact rooftop solar has on the other power plants. As the other solar farms make only a small contribution we add both together. We pick 2 days with the same average generation but with different solar shares.
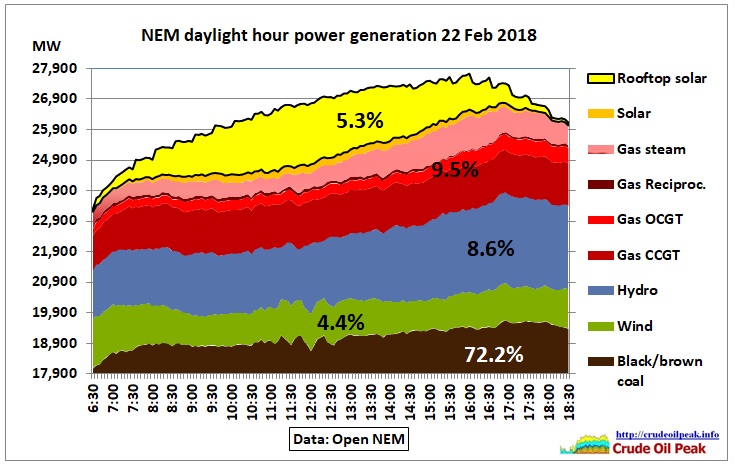 Fig 23: Generation by fuel during day light hours 22 Feb 2018
This is a zoom into the daylight part of the peak for 22 Feb 2018 (see Fig 1) which is approximately 1/5th of the total daily generation measured in MWh. Note that Fig 23 is not zero scaled. It starts at 17,900 MW (brown coal plus black coal at 6:30 am) so that generation increments can be more clearly shown. The largest contribution to build up the daytime peak over and above coal generation comes from gas (9.5%), followed by hydro (8.6%), roof-top solar & solar farms (5.3%) and wind (4.4%).
Hydro, gas and coal are concavely shaped while solar is convex. This suggests that solar has taken shares from hydro, gas and from coal. How much?
In a very simple generation model without solar, we assume that each type of fuel would follow the shape of the demand curve and that coal would still be at the same generation level in the late afternoon when there is not much sun anyway.
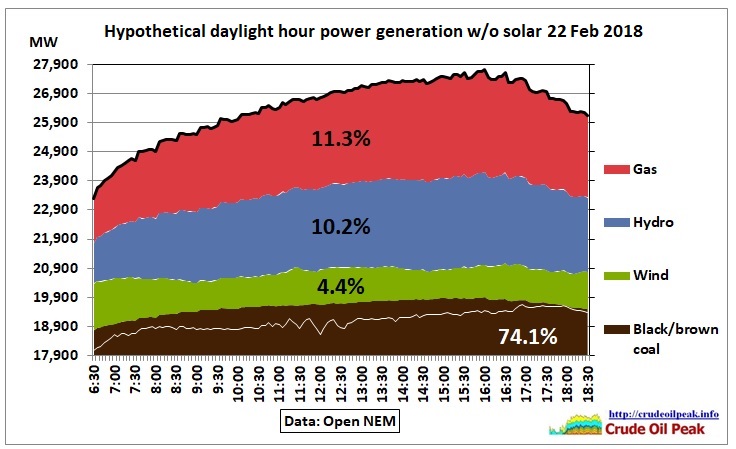 Fig 24: Hypothetical generation shares by fuel without solar 22/2/2018
The white line shows coal generation from Fig 23. Wind is a given so its share of 4.4% remains. All the other shares are higher without solar. The difference between Figs 23 and 24 shows by how much solar displaced other sources of fuel:
Coal: 1.9% (74.1%-72.2%), gas 1.8% (11.3%-9.5%) and hydro 1.6% (10.2% – 8.6%)
The 2nd day analyzed has more solar generation:
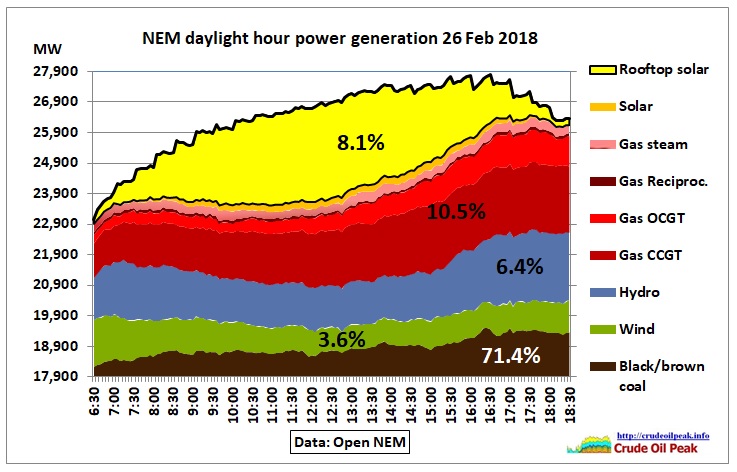 Fig 25: Generation by fuel during day light hours 26 Feb 2018
Compared to Fig 23 generation from coal is slightly lower, from gas slightly higher (surprisingly) but the real dent is in hydro.
This time, the model without solar looks like this:
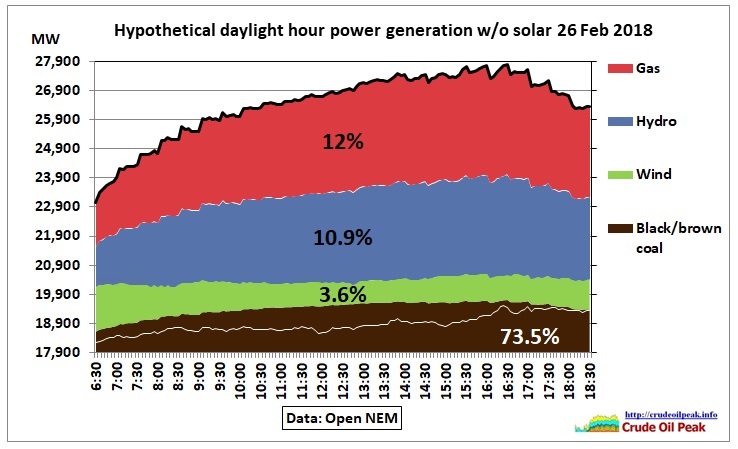 Fig 26: Hypothetical generation shares by fuel without solar 26/2/2018
Therefore, solar has taken following shares: 2.1% (coal), 4.5% (hydro) and 1.5% (gas)
Conclusion:
Solar generation takes away a tiny 2% of coal generation during daylight hours. More gas and hydro combined is replaced than coal. Given that Australia sits on vast areas with almost unlimited solar resources governments should be ashamed there are no policies in place to speed up a transition away from coal, commensurate with the urgency of the problem.