Categories
- Africa
- Algeria
- Angola
- Asia
- Australia
- Australia Budget
- Australia Transport
- Australian Mining
- Australian natural gas
- Australian rail
- Australian refineries
- Aviation
- BP
- BP Statistical Review
- Cars
- China
- Coal Seam Gas
- Crude oil analysis
- Debt
- Egypt
- Europe
- Feature1
- Global
- Hormuz
- India
- Iran
- Iraq
- Japan
- Korea
- Kuwait
- Latin America
- Libya
- Malaysia
- Middle East
- Motorways
- New South Wales
- North Sea
- OPEC
- Peaky Leaks
- Persian Gulf
- Power Supply
- Qatar
- Russia
- Saudi Arabia
- Shale gas
- Shell
- Shipping
- Singapore
- South East Asia
- Sudan
- Sydney
- Sydney Metros
- Syria
- Taiwan
- Tony Abbott Australian PM
- Ukraine
- United Arab Emirates
- United Kingdom
- United States
- Venezuela
- Vietnam
Sidebar menu
- Net oil importers
- Oil Exports
- Crude oil imports
- Downloads
- Latest Graphs
- Oil price analysis
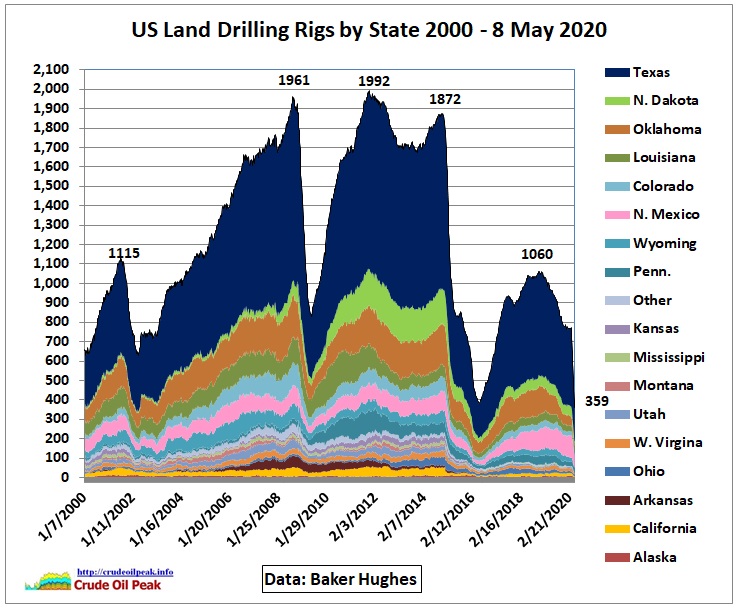 US drilling rig count
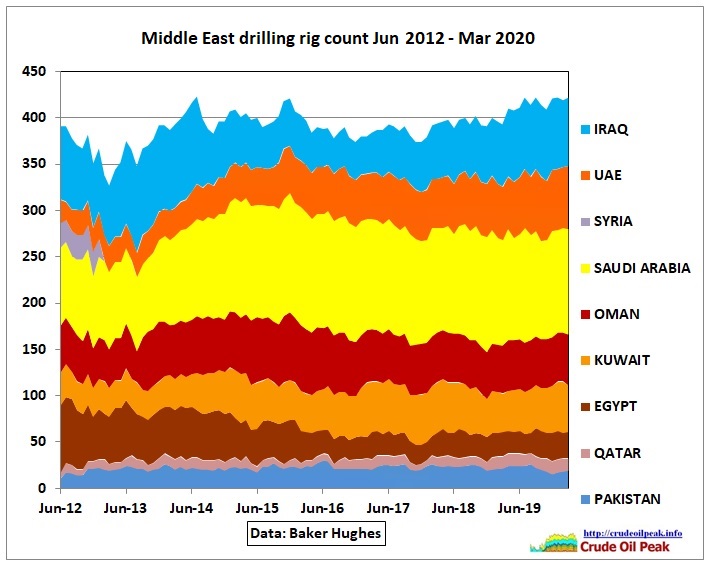 International drilling rig count
- Australian fuel prices
- Diary
- International oil companies
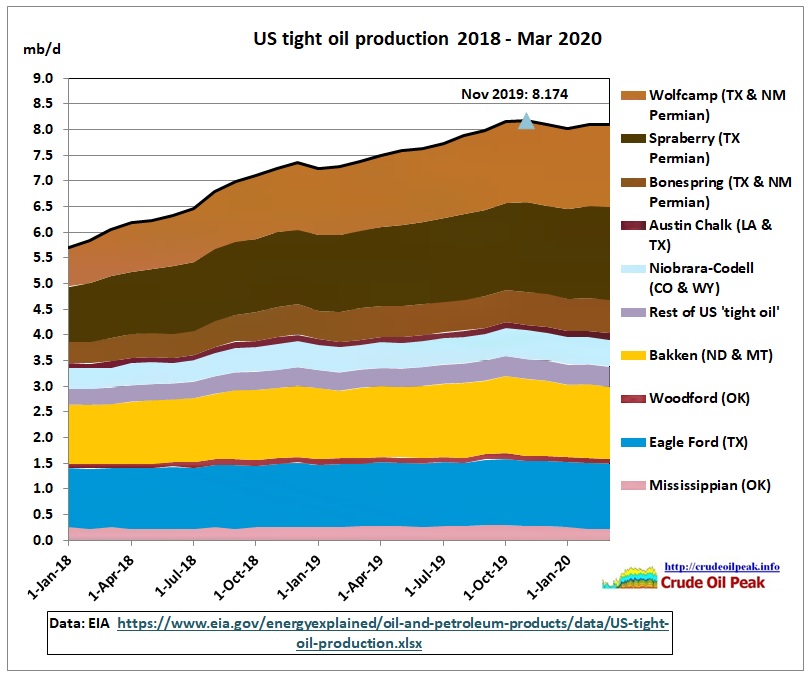 US tight oil production
 China peak oil
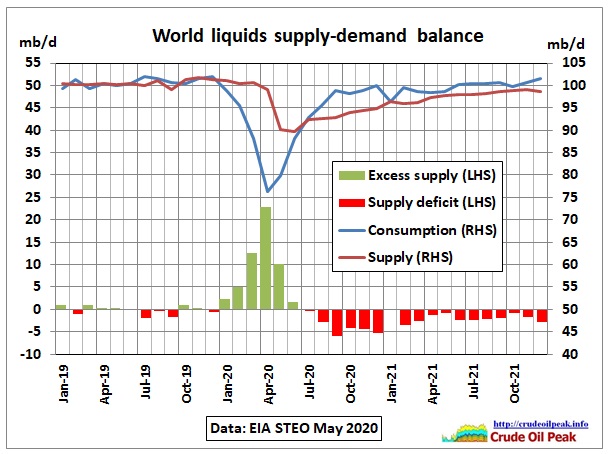 World liquids supply – demand balance
 Tankers arriving and departing in Sydney
 Australian oil and fuel imports
-
Crude oil analysis Archive
-
![In his latest research on shale oil French oil geologist Jean Laherrere from ASPO France http://aspofrance.viabloga.com/texts/documents estimates a Bakken shale oil peak in 2014 He uses a Hubbert linearization to […]](https://crudeoilpeak.info/wp-content/uploads/2014/01/North_Dakota_crude_oil_production_forecast_4-7_and_6-2Gb_Laherrere_Aug2014-115x115.png "Jean Laherrere uses Hubbert linearization to estimate Bakken shale oil peak in 2014")
Jean Laherrere uses Hubbert linearization to estimate Bakken shale oil peak in 2014
Posted on January 31, 2014 | No CommentsIn his latest research on shale oil French oil geologist Jean Laherrere from ASPO France http://aspofrance.viabloga.com/texts/documents estimates a Bakken shale oil peak in 2014 He uses a Hubbert linearization to […] -
![Recent US shale oil growth sits on top of a bumpy production plateau of the rest-of-the-world (ROW) Other Middle East (Syria, Yemen, Oman) was in long term decline until 2007. […]](https://crudeoilpeak.info/wp-content/uploads/2011/02/Incremental_crude_world_US_top_2001_May2013-115x115.jpg "US shale oil hides crude oil peak in rest of world")
US shale oil hides crude oil peak in rest of world
Posted on September 11, 2013 | No CommentsRecent US shale oil growth sits on top of a bumpy production plateau of the rest-of-the-world (ROW) Other Middle East (Syria, Yemen, Oman) was in long term decline until 2007. […] -
![Excluding the US, rest-of-world crude oil production in the 2nd half of 2012 was on the same level as in the 2nd half of 2005, despite 85% higher oil prices. […]](https://crudeoilpeak.info/wp-content/uploads/2013/04/Incremental_crude_World_showing_decline_2001_Dec2012-115x115.jpg "Excluding the US, rest-of-world crude production in 2H2012 was not higher than in 2005")
Excluding the US, rest-of-world crude production in 2H2012 was not higher than in 2005
Posted on April 29, 2013 | No CommentsExcluding the US, rest-of-world crude oil production in the 2nd half of 2012 was on the same level as in the 2nd half of 2005, despite 85% higher oil prices. […] -
![Oil production (crude and NGLs) of 5 international oil companies has been declining by a total of 15% over the period 2004-2011. Merci, Jean (Lahererre, ASPO France) pour m’avoir envoyé […]](https://crudeoilpeak.info/wp-content/uploads/2013/03/5_IOC_oil_production_underlying_decline_2000_2011-115x115.jpg "International oil companies’ oil production peaked in 2004 and declined by 2.1 % pa")
International oil companies’ oil production peaked in 2004 and declined by 2.1 % pa
Posted on March 11, 2013 | No CommentsOil production (crude and NGLs) of 5 international oil companies has been declining by a total of 15% over the period 2004-2011. Merci, Jean (Lahererre, ASPO France) pour m’avoir envoyé […] -
![The following graph shows the changes in global crude oil production since January 2001. The data source is the EIA International Energy Statistics downloaded in December 2012 http://www.eia.gov/cfapps/ipdbproject/iedindex3.cfm Countries have […]](https://crudeoilpeak.info/wp-content/uploads/2013/01/Incremental_crude_World_2001_Sep2012-115x115.jpg "75 pct of global crude production in 2012 was not higher than in 2005")
75 pct of global crude production in 2012 was not higher than in 2005
Posted on January 2, 2013 | No CommentsThe following graph shows the changes in global crude oil production since January 2001. The data source is the EIA International Energy Statistics downloaded in December 2012 http://www.eia.gov/cfapps/ipdbproject/iedindex3.cfm Countries have […] -
![The following graph shows the changes in global crude oil production since January 2001. This start year is being used to make the graph comparable to previous graphs which were […]](https://crudeoilpeak.info/wp-content/uploads/2012/05/Incremental_crude_World_2001_Jan2012-115x115.jpg "Incremental crude oil production update January 2012")
Incremental crude oil production update January 2012
Posted on May 17, 2012 | No CommentsThe following graph shows the changes in global crude oil production since January 2001. This start year is being used to make the graph comparable to previous graphs which were […] -
![In 2011, I wrote a total of 55 posts. The menu system was also expanded with readily available graphs and other information. These were the topics in 2011: (1) […]](https://crudeoilpeak.info/wp-content/uploads/2011/12/Libya_oil_production_at_standstill-115x115.jpg "Crudeoilpeak Summary 2011")
Crudeoilpeak Summary 2011
Posted on December 29, 2011 | No CommentsIn 2011, I wrote a total of 55 posts. The menu system was also expanded with readily available graphs and other information. These were the topics in 2011: (1) […] -
![(1) By continent (1.1) North America Growing Canadian production from tar sand syn crude could not offset Mexican decline. The US was able to increase production after the last hurricane […]](https://crudeoilpeak.info/wp-content/uploads/2011/12/Incremental_crude_World_2001_Aug2011-115x115.jpg "Incremental crude oil production August 2011")
Incremental crude oil production August 2011
Posted on December 26, 2011 | No Comments(1) By continent (1.1) North America Growing Canadian production from tar sand syn crude could not offset Mexican decline. The US was able to increase production after the last hurricane […] -
![5 years peak oil. What we have seen so far is the response of the economy and the financial system to oil production on a bumpy production plateau The above […]](https://crudeoilpeak.info/wp-content/uploads/2011/06/eia_crude_2010_vs_2005_march-115x115.jpg "Crude oil 2010 vs 2005 1st quarter")
Crude oil 2010 vs 2005 1st quarter
Posted on June 18, 2010 | No Comments5 years peak oil. What we have seen so far is the response of the economy and the financial system to oil production on a bumpy production plateau The above […]