The 2024 Statistical Review of World Energy has been published on 20 June 2024 by the Energy Institute (previously by BP) with data up to 2023.
https://www.energyinst.org/statistical-review
Oil production in 2023 has increased by 1 mb/d compared to 2019 due to an increase in natural gas liquids while crude production is 1 mb/d less than in 2018. A peak oil analysis has been complicated by the economic impact of the Wuhan virus in 2020 as highlighted in this article:
10 Mar 2020
Impact of Corona Virus similar to some earlier peak oil scenarios
http://crudeoilpeak.info/impact-of-corona-virus-similar-to-some-earlier-peak-oil-scenarios
We should not read too much into +- 1 mb/d because this could well be within the accuracy of data. But it is safe to say that the increase in crude production after 2011 – mainly driven by unconventional production in the US – had already come to an end in 2018/19. We’ll explore this in a future post.
The focus of this article are the natural gas liquids which are not as versatile as crude oil and are mainly used in the chemical and other industries, not so much in transportation.
 Fig 1: Crude oil vs oil (which includes NGLs)
The data are from this XLS file:
https://www.energyinst.org/__data/assets/excel_doc/0020/1540550/EI-Stats-Review-All-Data.xlsx
Definition of “oil” (from worksheet “Oil Production – barrels”, 1965-2023)
“Includes crude oil, shale oil, oil sands, condensates (lease condensate or gas condensates that require further refining) and NGLs (natural gas liquids – ethane, LPG and naphtha separated from the production of natural gas)”
“Excludes liquid fuels from other sources such as biofuels and synthetic derivatives of coal and natural gas. This also excludes liquid fuel adjustment factors such as refinery processing gain. Excludes oil shales/kerogen extracted in solid form.”
Definition of “crude oil” (from worksheet “Crude + cond. production – barrels”, 2000-2023)
“Includes crude oil, shale/tight oil, oil sands, lease condensate or gas condensates that require further refining. Excludes liquid fuels from other sources such as biomass and synthetic derivatives of coal and natural gas.”
It is quite important to make this distinction as the peaking behaviour is different.
So let’s see where the NGLs come from:
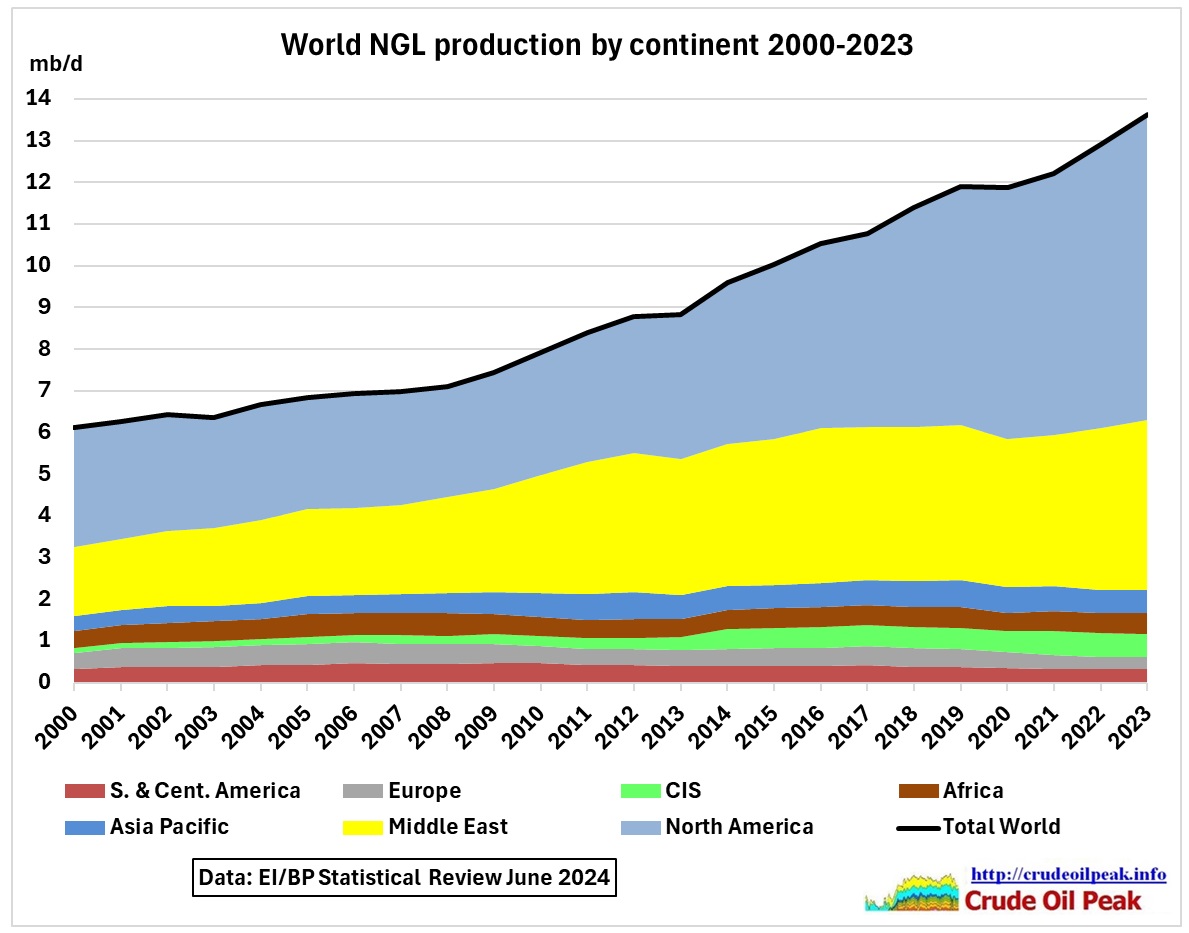 Fig 2: NGL production by continent/area
We see that the growth in NGL production mainly comes from North America (gas from fracking) and the Middle East.
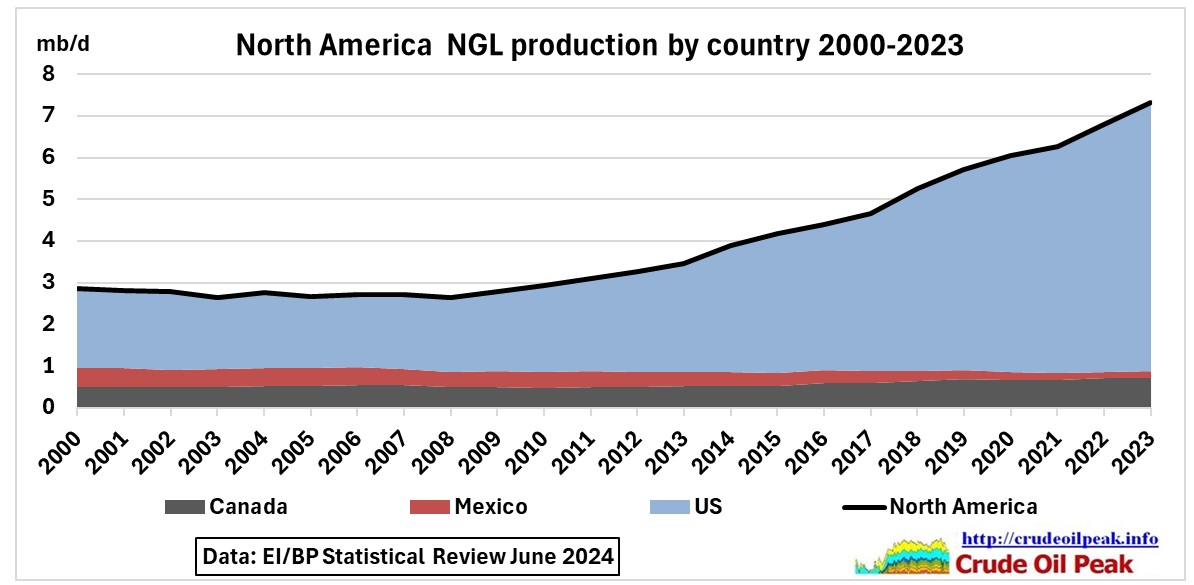 Fig 3: NGL production growth dominated by the US
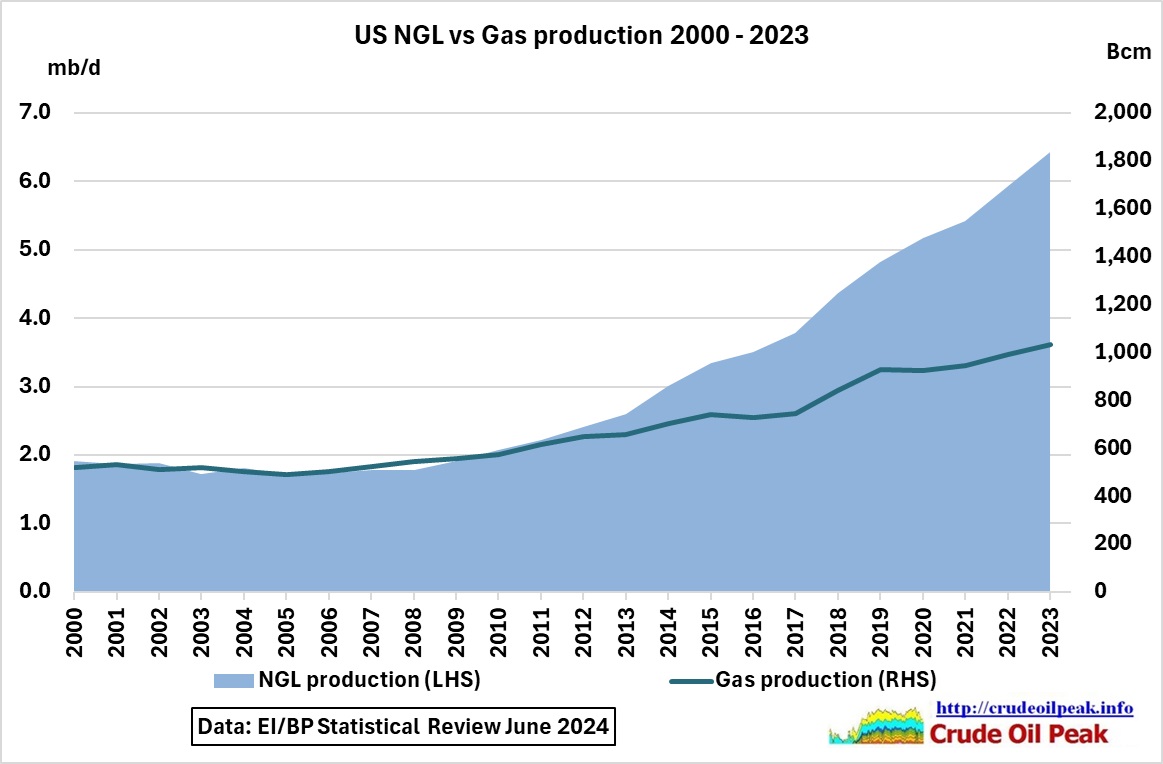 Fig 4: US production vs gas production
The data are exactly the same as from the EIA:
US NGL production by product is (2023):
ethane C2H6, 41%
propane C3H8, 31 %
normal butene and isobutene C4H10, 16%
natural gasoline C5H12), 12%
https://www.eia.gov/dnav/pet/pet_pnp_gp_dc_nus_mbblpd_a.htm
There are also natural gas plant liquids which come from refineries but these are not included here (see above definition of oil)
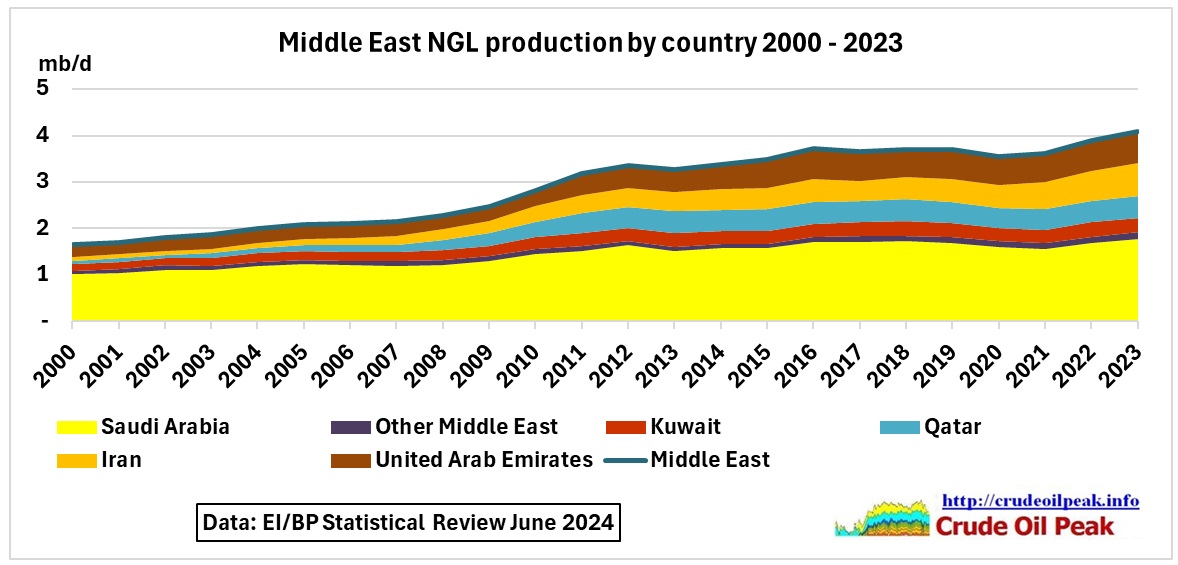 Fig 5: Although NGL production is dominated by Saudi Arabia other countries grew faster
NGLs mainly come from gas fields, so let’s compare NGL and gas production.
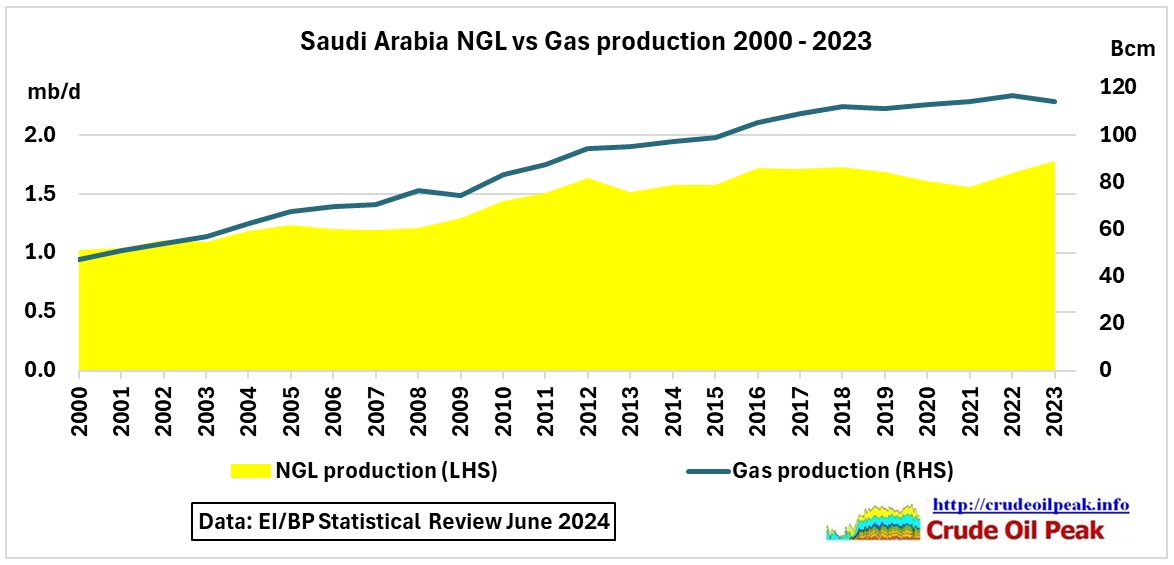 Fig 6: Saudi NGL production vs gas production
Apparently, the gas is yielding less liquids over time.
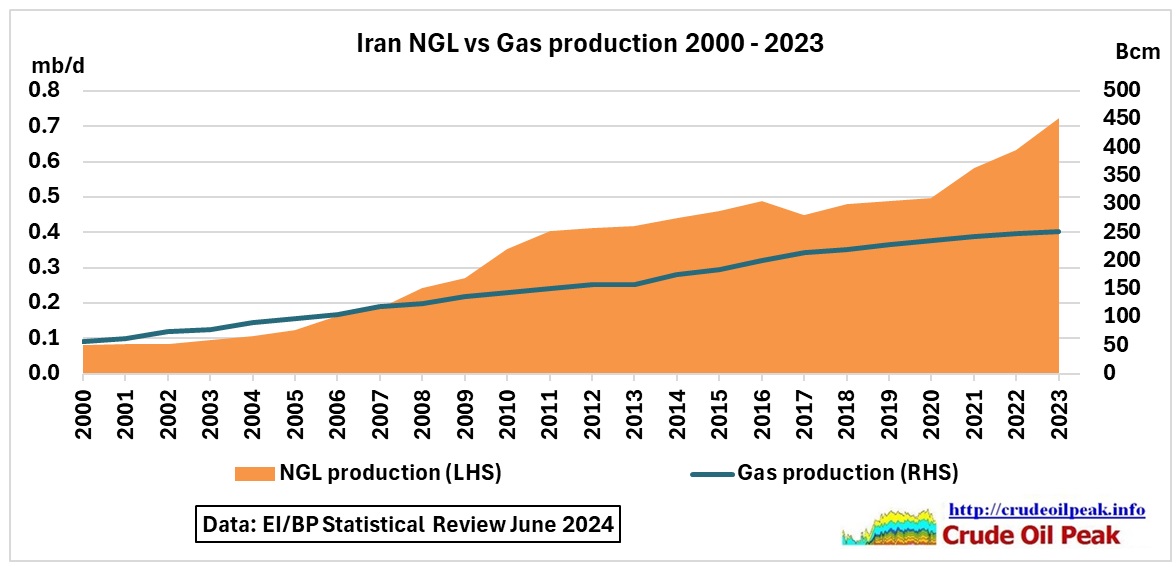 Fig 7: Iran NGL production vs gas production
South Pars is a huge gas field. As an example, the following graph shows the production profile of phases 6-8
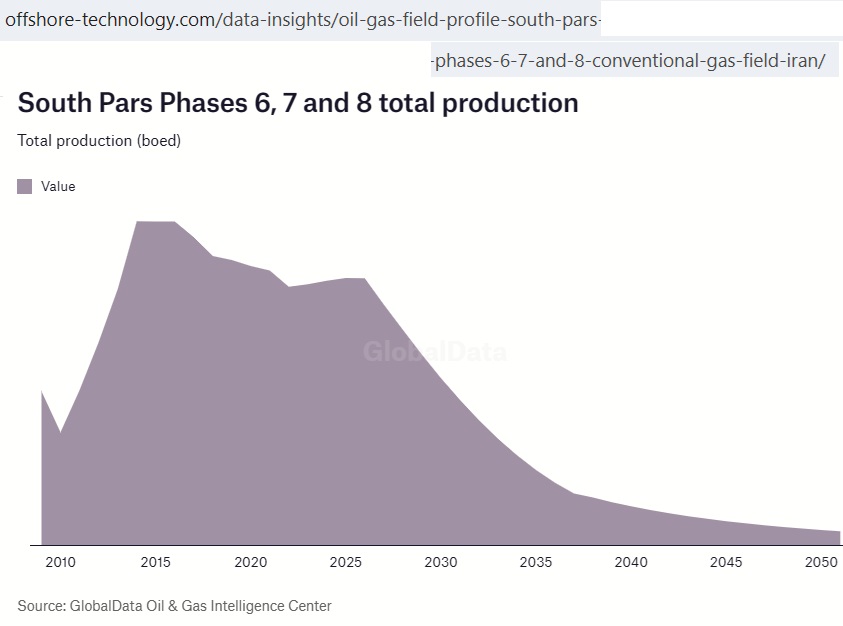 Fig 8: South Pars gas field, phases 6-8 boosted production in 2010
https://www.offshore-technology.com/data-insights/oil-gas-field-profile-south-pars-phases-6-7-and-8-conventional-gas-field-iran/
In the meantime, there are 24 phases. This is a topic for another post.
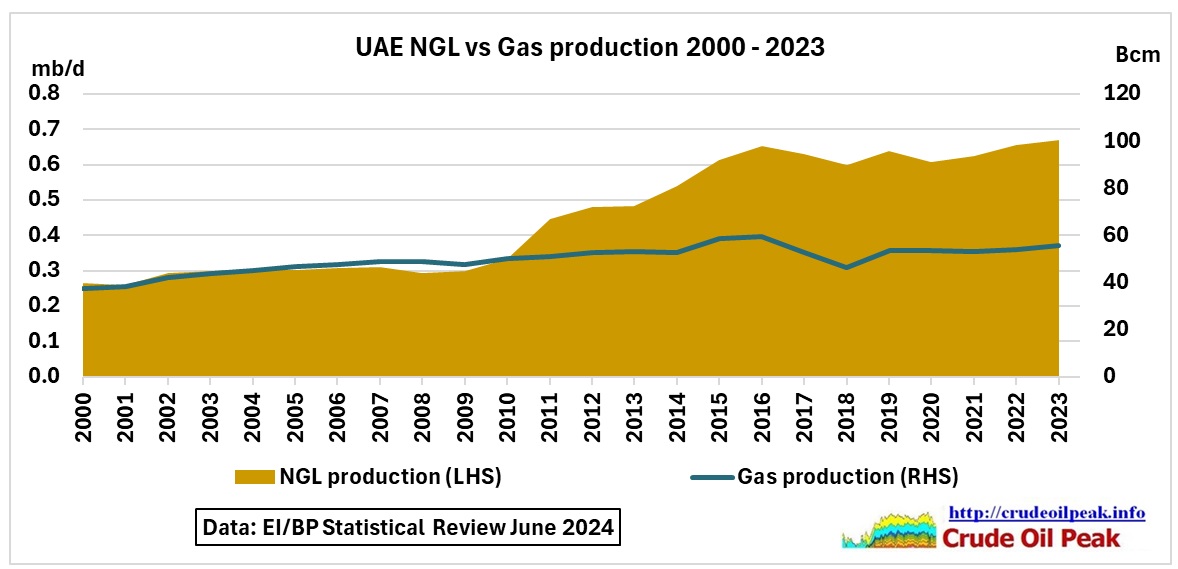 Fig 9: UAE NGL production vs gas production
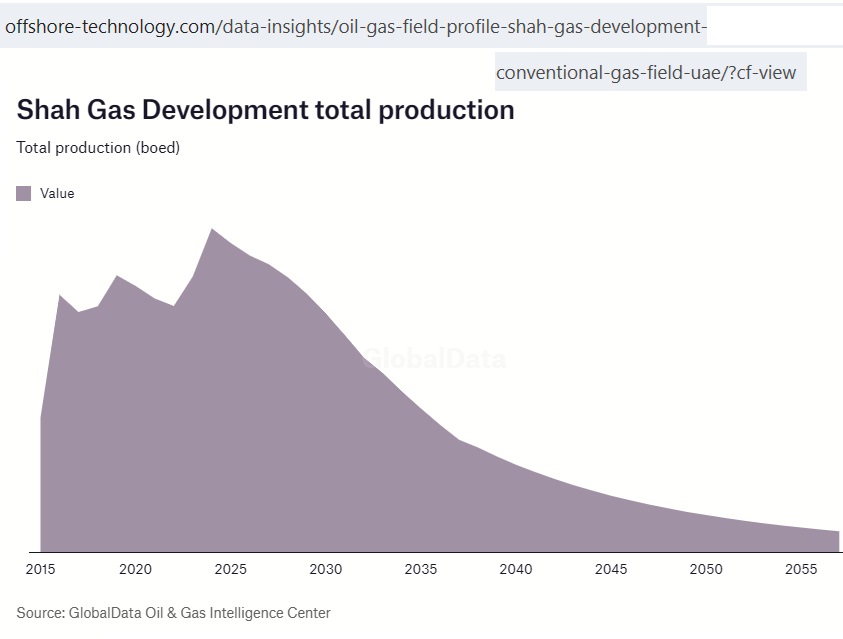 Fig 10: UAE’s Shah gas field production profile
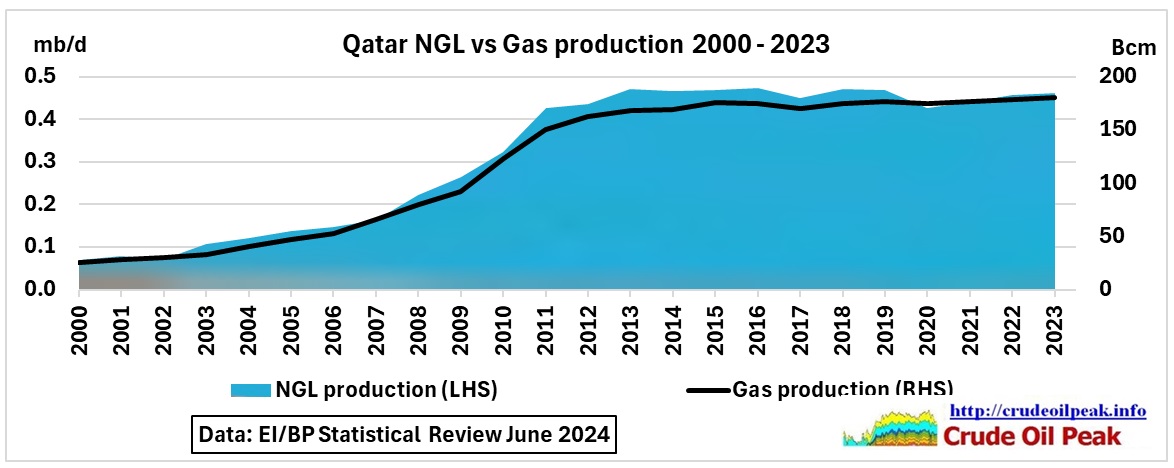 Fig 11: Qatar NGL production vs gas production
Qatar’s NGL production is proportional to gas production.
Conclusion: Any growth in future NGL production mainly depends on how long the fracking boom in the US will last.
We need to be mindful that gas has only a 3% share in the use of energy for transportation In the US
![]() https://www.eia.gov/energyexplained/use-of-energy/transportation.php
https://www.eia.gov/energyexplained/use-of-energy/transportation.php
In the next post we’ll look at incremental crude production 2000-2023