The moment of the truth has arrived. The media is still beating around the bush, avoiding to mention the “P” word.
The symptoms of peaking:
• Conventional gas production maxed out so it can’t handle demand surges
• Gas Infrastructure not built for increasing production and supply as future reserves dwindle
• Gas market not functioning (AEMO intervention necessary)
• Plans afoot for gas import terminal (Viva at its Geelong refinery)
• Proper offshore production statistics kept secret by Federal government
The focus of this post is the intervention of the Australian Energy Market Operator (AEMO) in the gas market on 19th July 2022. The gas supply shortfall trigger was invoked:
100402 GENERAL NOTICE 20/07/2022 6:12PM
AEMO Gas Supply Shortfall Outcome Notification – 19 July 2022
AEMO has determined that this gas supply shortfall trigger event applies from 19 July 2022 to 30 September 2022, unless the event is resolved earlier. AEMO will continue to monitor gas supply throughout this period for NEM gas powered generators in south eastern Australia.
NSW gas generation (year to date) in 2022 is 15 PJ versus 5 PJ in 2021; and
VIC gas generation (year to date) in 2022 is 14 PJ versus 7 PJ in 2021.
Increased gas generation demand is depleting Iona storage inventory at an unsustainable rate. Iona storage is critical to maintaining gas supplies on peak gas demand days in south-east Australia. Iona withdrawals must be reduced to a sustainable rate to last the winter period.
– NEM gas powered generators have advised AEMO they cannot obtain sufficient gas supply to meet gas-powered generation demand and are needing to generate using diesel to fuel their gas generation.
– An average of an additional (approx.) 100 TJ/d of gas flows to the southern states during the period (essentially seeking to maximising flows from Wallumbilla on the SWQP pipeline to the southern states).
– LNG producers have indicated that gas can be purchased from them either via bilateral contract or from the Wallumbilla Gas Supply Hub
http://nemweb.com.au/Reports/Current/Gas_Supply_Guarantee/Gas%20Supply%20Guarantee%20-%20Outcome%20Notice%20-%2019%20Juy%202022.pdf
The Wallumbilla Gas Supply Hub is a coal seam gas centre in Queensland near Roma.
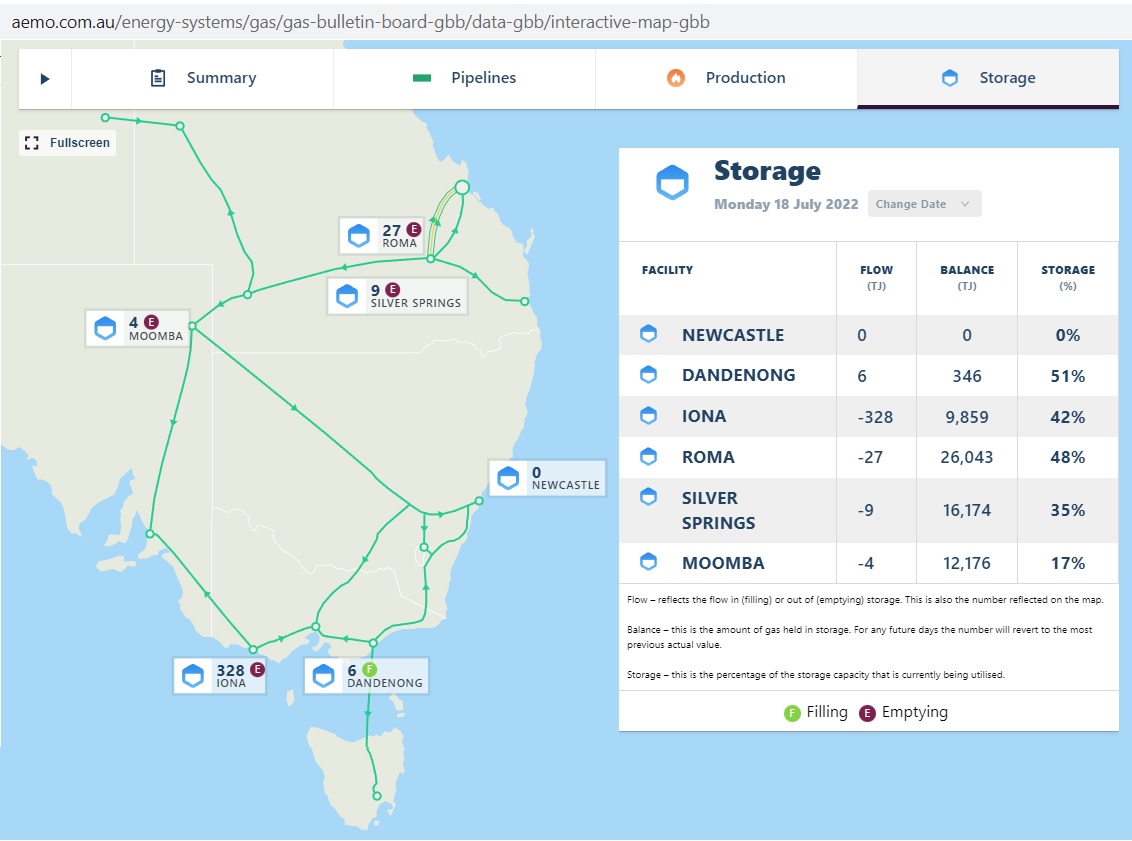 Fig 1: East coast gas pipelines and storage facilities. Data 18 Jul 22
https://aemo.com.au/energy-systems/gas/gas-bulletin-board-gbb/data-gbb/interactive-map-gbb
On 18th July 21 Iona underground storage was emptying at 328 PJ/day.
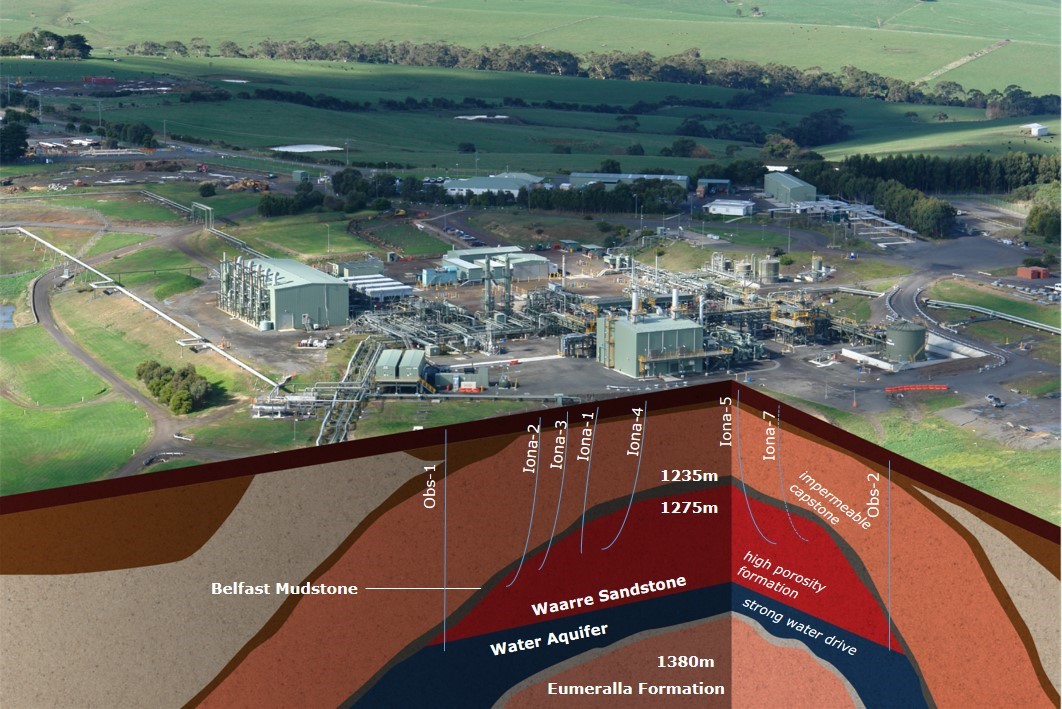 Fig 2: Iona underground gas storage facility
https://aemo.com.au/newsroom/energy-live/keeping-you-warm-the-importance-of-gas-storage-explained
Let’s have a look at Iona’s storage levels over the last 4 years until 19th July 2021
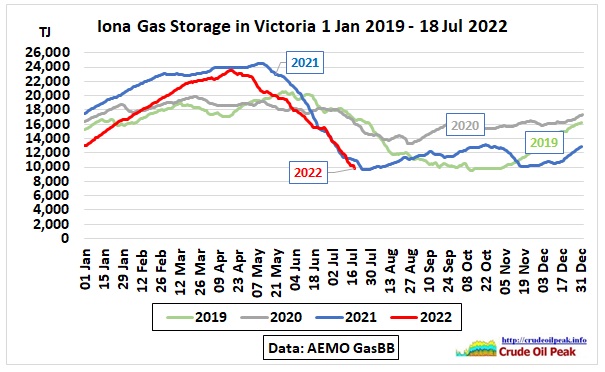 Fig 3: Iona gas storage 2022 compared to previous 3 years
https://aemo.com.au/energy-systems/gas/gas-bulletin-board-gbb/data-gbb/data-dashboard
Gas storage levels follow a seasonal pattern year by year, with a maximum normally building up in April/May, followed by withdrawals during winter. In 2022 storage levels showed a decline in June/July similar to 2021 but then no trend change was observed like during the previous year.
AEMO forecasted on 19/7/22 that at the rate of decline of 200 TJ/d, Iona storage inventory would be reduced to 6,000 TJ on 6 August 2022, threatening the capacity to deliver gas from the facility.
https://aemo.com.au/newsroom/media-release/notice-of-a-threat-to-system-security
So was AEMO’s intervention successful? Yes, in terms of Iona storage recovery but a question mark rests over Queensland’s expected contribution. The following graph shows how actual storage (blue curve) increased from a minimum of 9,421 TJ to 9,978 TJ on 29 July.
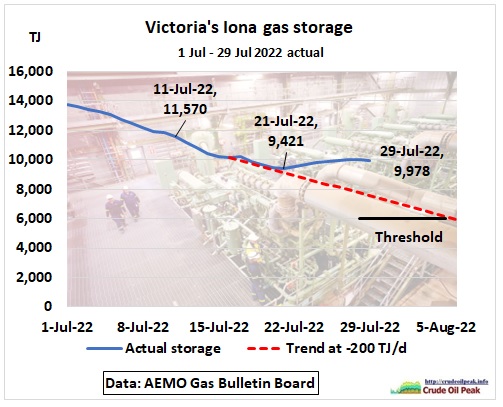 Fig 4: AEMO’s intervention showed a change in the storage trend
https://aemo.com.au/energy-systems/gas/gas-bulletin-board-gbb/data-gbb/interactive-map-gbb
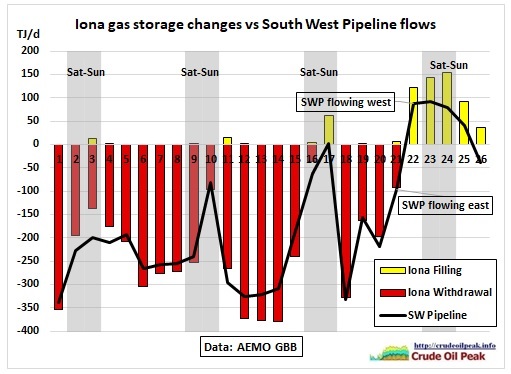
Fig 5: Iona gas storage changes and South West Pipeline (SWP) flows
We see that AEMO’s warning of July 19 took 2 days for the gas industry to respond to. Re-filling started 3 days later but had somehow slowed down by 26th July. When gas in the SWP flows east, Iona storage is emptying, when it flows west, Iona is filling. We see Iona storage changes are largely proportionate with SWP flows but cannot be fully explained by them (details in Fig 8).
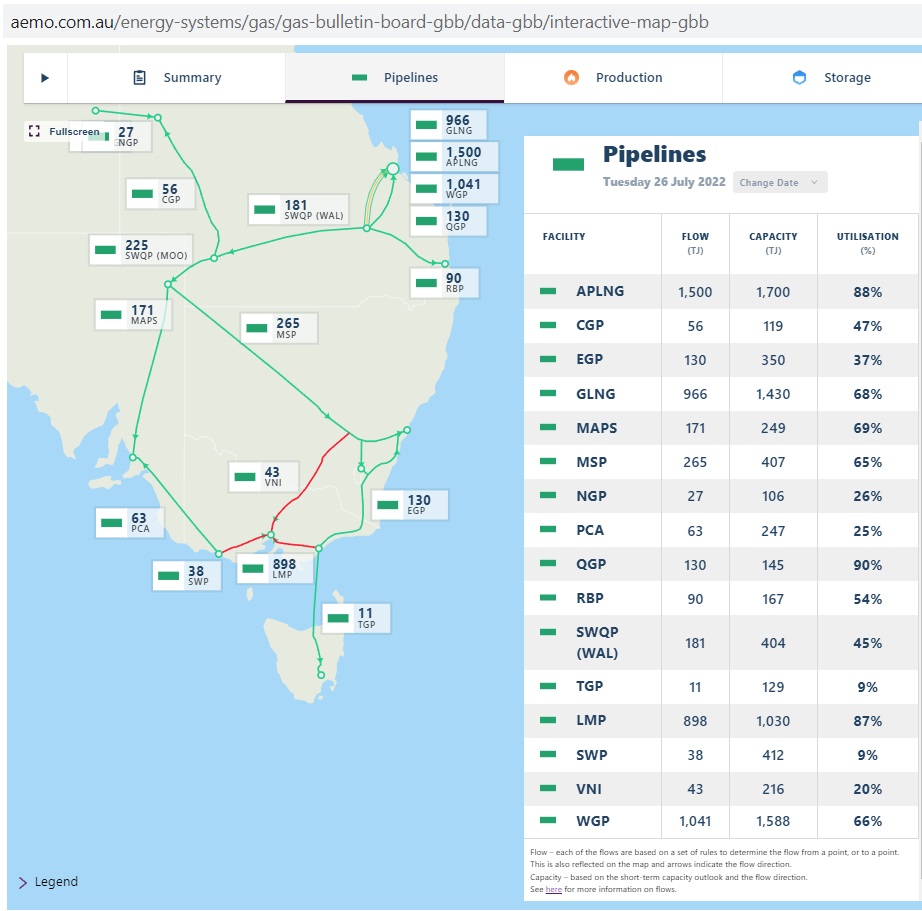 Fig 6: East coast gas flows on 26th July 2022
Huge quantities (GLNG, APLNG, WGP) with a total capacity of 4,700 TJ/d are exported from Curtis Island in Gladstone.
The Iona gas storage is directly connected to PCA and SWP pipelines and of course indirectly to the rest of the gas supply system.
PCA is the Port Campbell to Adelaide pipeline. Note the small arrows are indicating the direction of gas flows. In the GasBB statistics north/south and east/west flows are defined in the following file:
Gas Bulletin Board Pipeline Flow Directions
https://aemo.com.au/-/media/files/gas/natural_gas_services_bulletin_board/site-content/gbb-documents/guides-and-procedures/bb-pipeline-flow-and-capacity-business-rules.pdf
This is a map with pipeline connections around Iona:
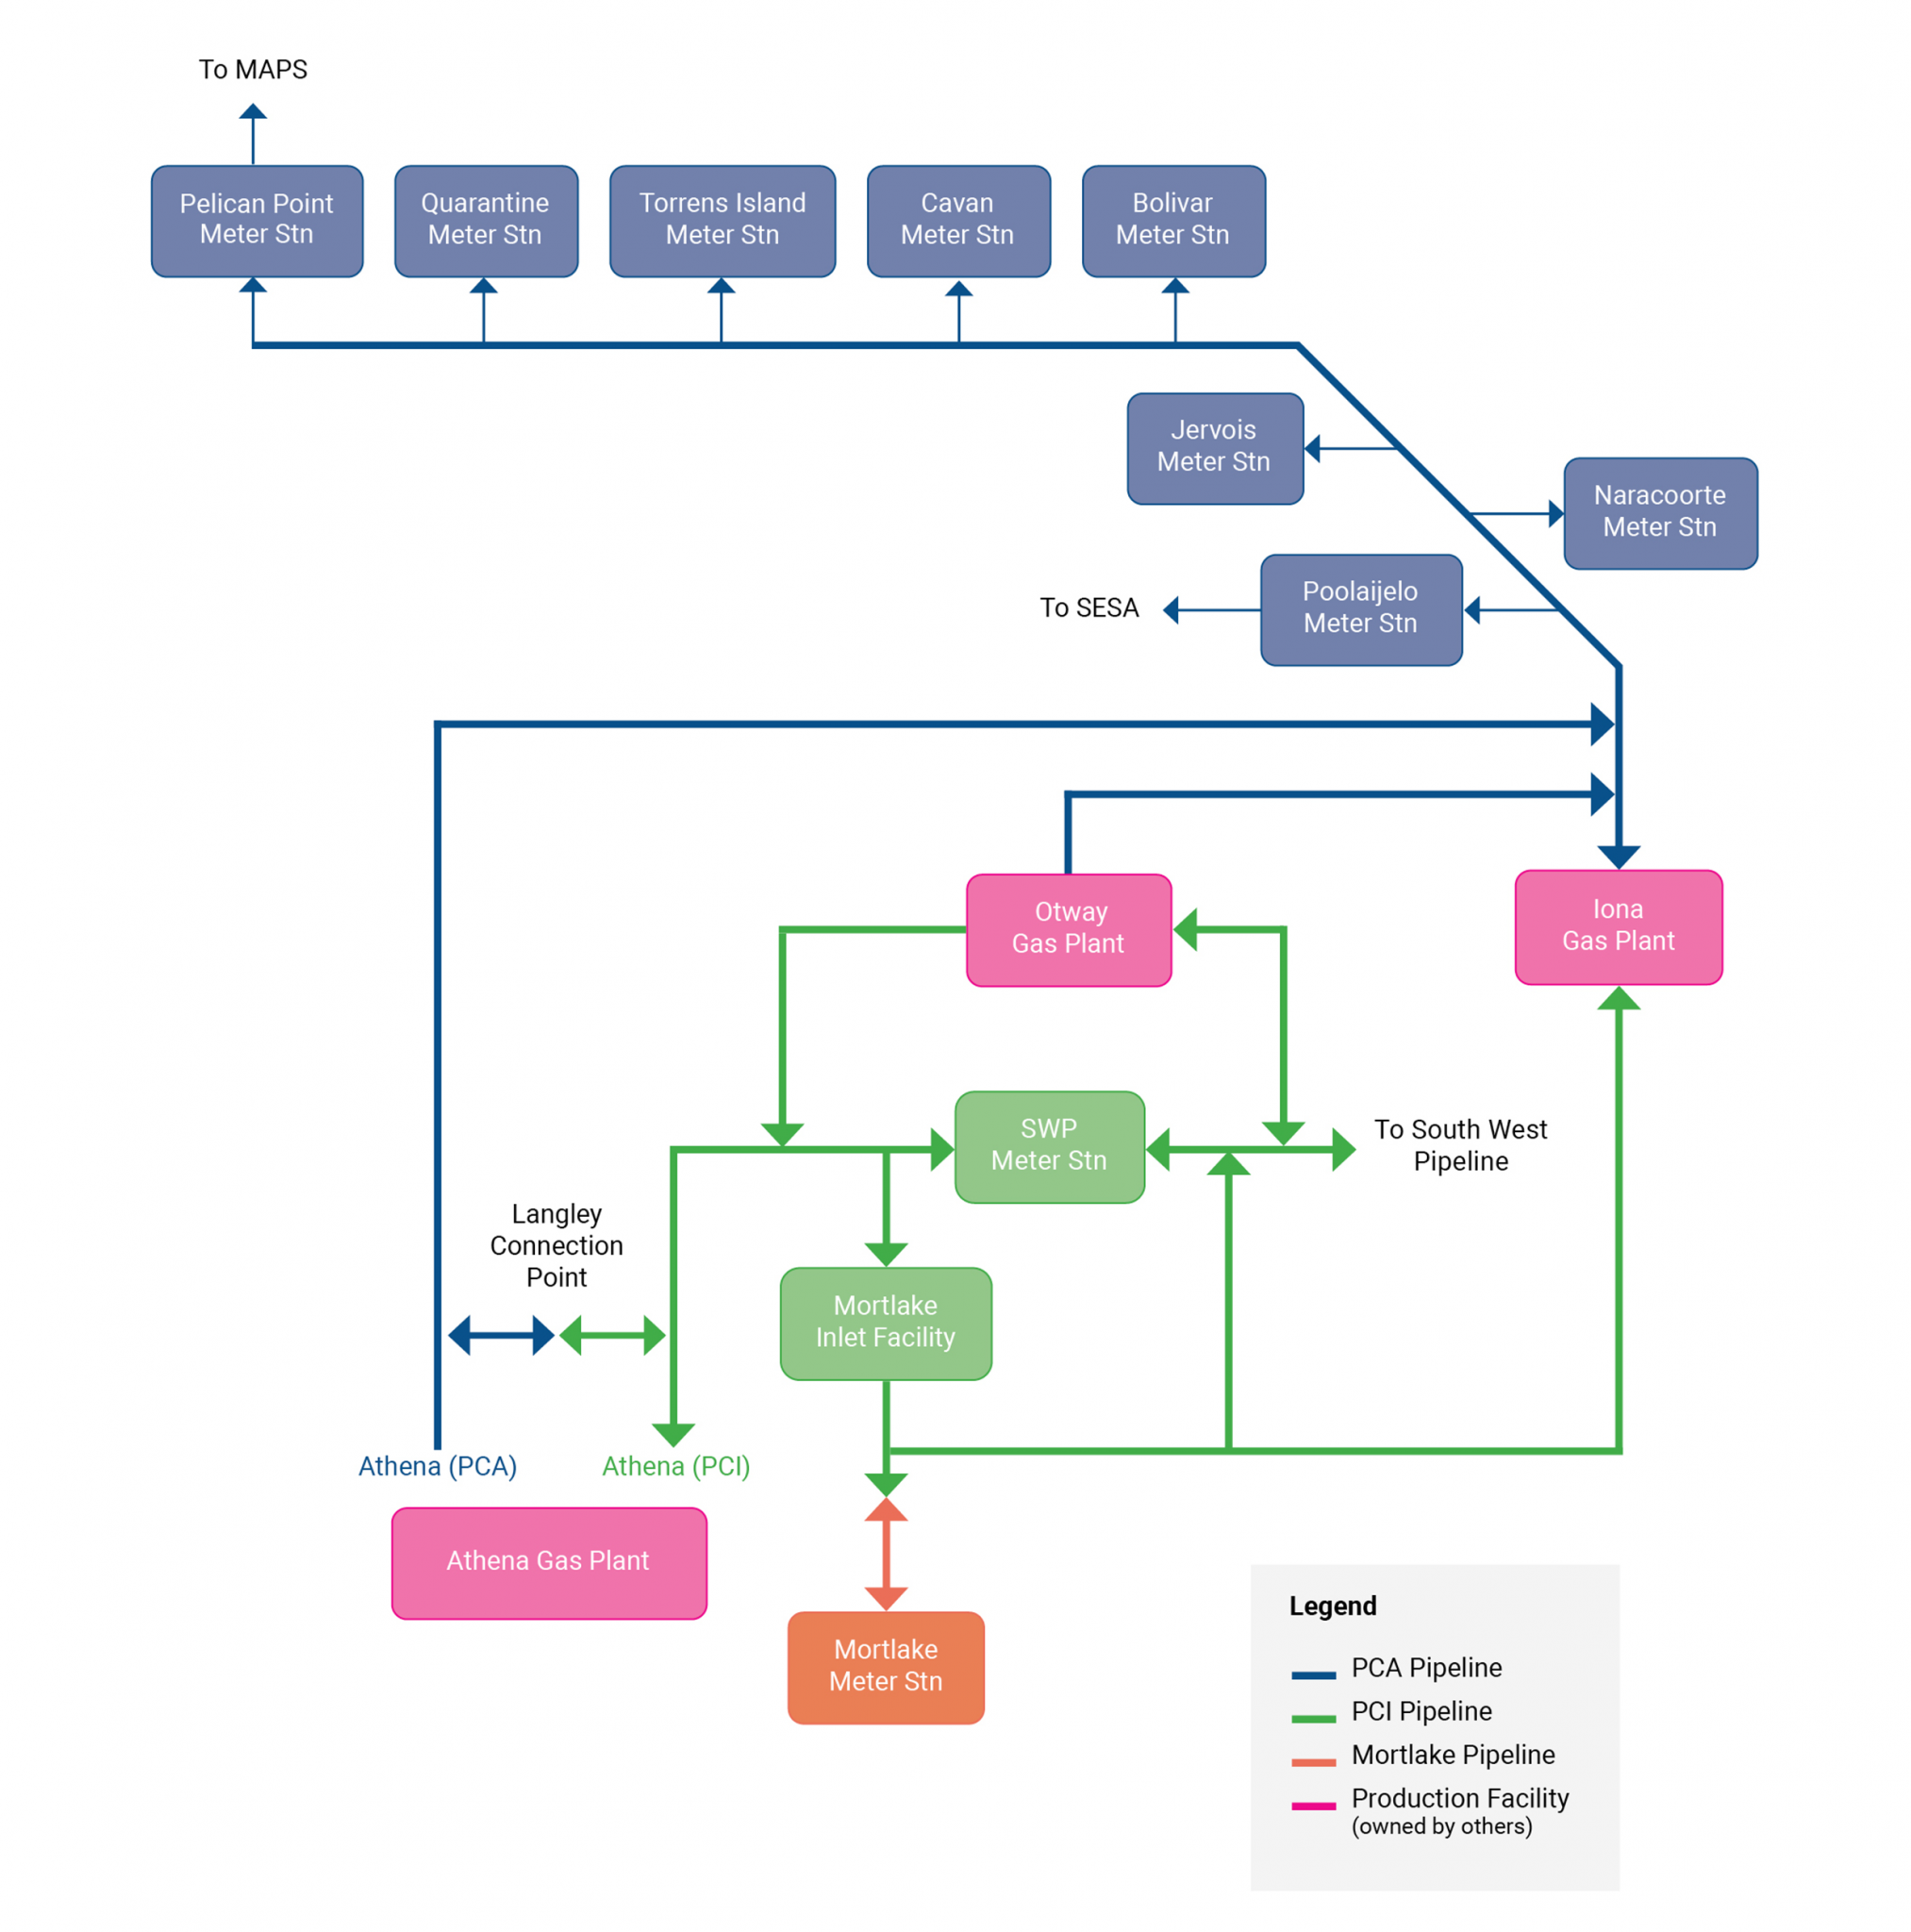 Fig 7: Pipeline system around Iona gas plant
https://seagas.com.au/about-us/the-pipeline/
The following graph shows the gas supply and demand balance at the Iona gas hub:
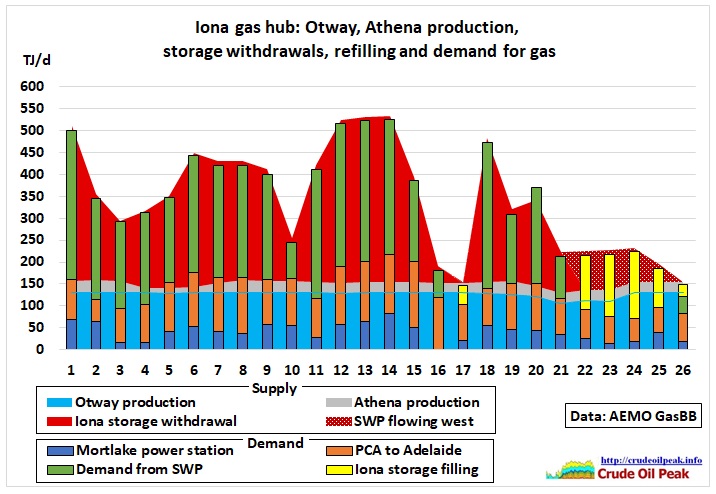 Fig 8: Iona hub gas supply and demand balance
The stacked areas represent gas supplies: Otway production, Athena production, Iona storage withdrawal and SWP flowing west.
The stacked columns represent gas demand: Mortlake power station, PCA to Adelaide, demand from SWP and Iona storage filling
• Demand from Mortlake and Adelaide are basically covered by production from Otway and Athena.
• Iona storage withdrawals were shortly reduced (15th – 17th) already before the AEMO intervention.
• After July 20th demand from Mortlake and Adelaide (more wind) was less.
• Half of the refilling came from neighbouring Otway and Athena gas fields.
So what were the other changes in gas flows? They can come only from higher production, other storage and/or lower demand
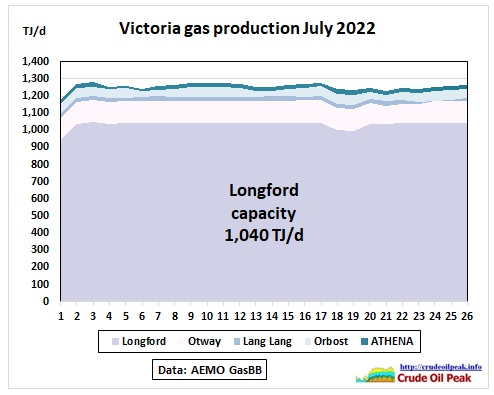 Fig 9: Victoria gas production in July 2022
Victoria’s gas production is at capacity. There was even a 40 TJ/d dip in Longford just as AEMO issued its warning. How about Queensland?
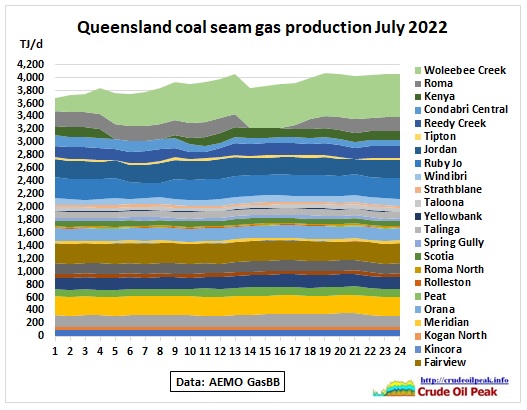 Fig 10: Queensland’s CSG production July 2022
In the period under consideration CSG production had its own problems. Woleebee Creek had just come back from 200 TJ/d on July 1st (planned shutdown in June) to its capacity of 666 TJ/d and Roma had recovered from a production outage by the time of the AEMO warning. Whatever happened in Queensland (production and supply to LNG liquefaction plants on Curtis Island in Gladstone for export), any leftovers should turn up at Moomba.
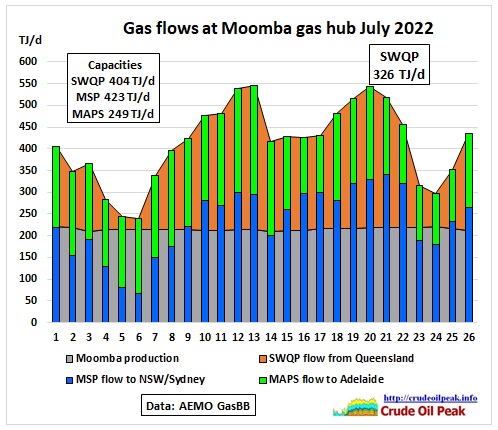 Fig 11: North-South gas flows at Moomba gas hub
Stacked areas represent supplies: Moomba production (practically flat between 210 and 220 TJ/d) and very variable coal seam gas flows from Queensland which indeed started to increase on the 18th by around 100 TJ/d but already peaked 2 days later and had decreased by 50 TJ/d in the following week after the weekend 23/24th.
Columns represent demand from states south of Queensland: 60-70% went to NSW. Some of it ended up in the Victoria Northern Interconnect.
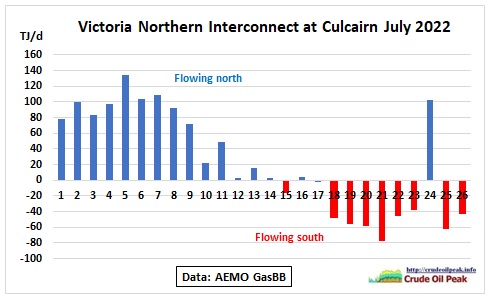 Fig 12: VNI flows changed direction except for a Sunday
A maximum of 80 TJ/d went south.
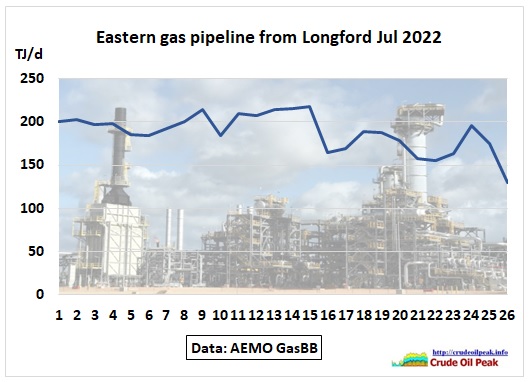 Fig 13: Eastern gas pipeline (EGP) flows
EGP flows are usually north, supplying gas from the Longford gas processing plant to Sydney and other parts of NSW. These were slightly reduced by up to 60 TJ/d. The gas peaking plant Tallawarra (which gets its gas from the EGP) needs 70 TJ/d when running at 400 MW capacity. So let’s have a look what happened with this plant because if there were gas shortages this would be bad news for power generation in NSW:
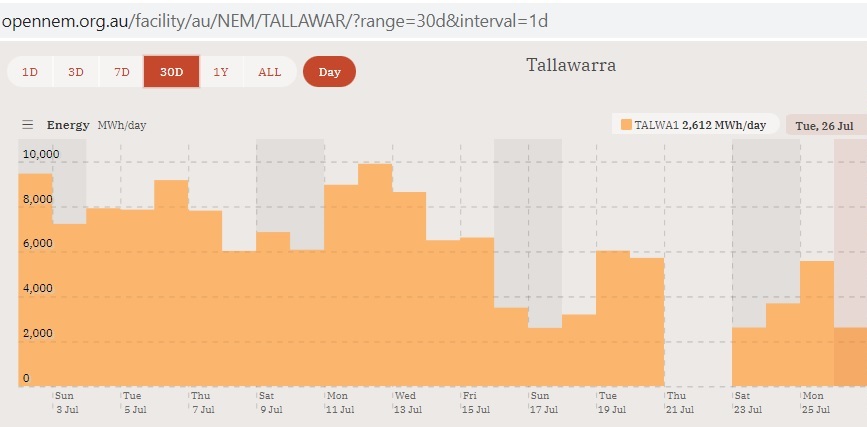 Fig 14: Tallawarra gas peaking plant (400 MW or a maximum of 9,600 MWh over 24 h)
https://opennem.org.au/facility/au/NEM/TALLAWAR/?range=30d&interval=1d
Tallawarra was operating at around 20 hrs/day (not really used as a peaking plant!) up to 15th July, requiring 58 TJ/d. After AEMO’s intervention the maximum was reduced to 44 TJ/d. On 26th July gas consumption was down to 19 TJ/d due to more wind power available.
Summary
Iona gas storage levels were successfully stabilised. This was achieved by a reduction of gas flows going north in a multitude of contributions including weather related windfall gains but NOT by a continuously increasing CSG supply from Queensland. This means there will be a permanent fight of south eastern States for gas from the north especially as conventional gas in Victoria is peaking.