Hors-d’oeuvre
On the streets of Paris: 24 Nov 2018
 Fuel price protests on the Champs Elysees
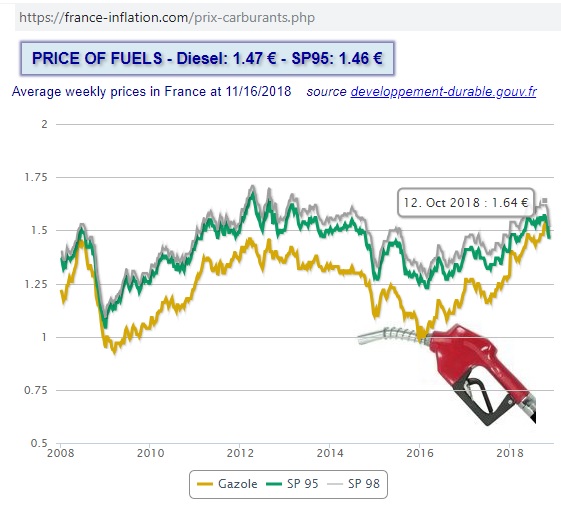 https://france-inflation.com/prix-carburants.php
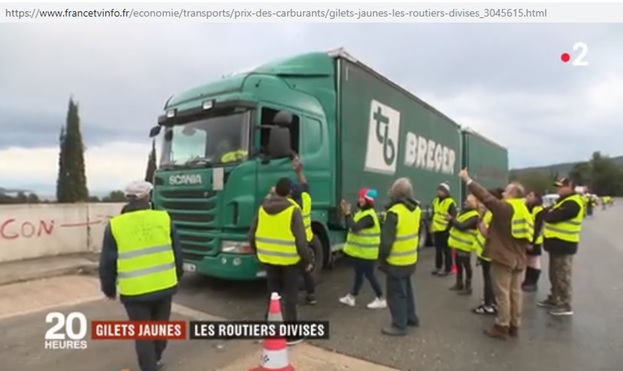
20 Nov 2018: The “gilets jaunes” have a hard time to convince truck drivers to join their movement
https://www.francetvinfo.fr/economie/transports/prix-des-carburants/gilets-jaunes-les-routiers-divises_3045615.html
They were more successful on the French island of Réunion in the Indian Ocean, where blocked roads and petrol rationing resulted in empty supermarket shelves, highlighting how vulnerable our just-in-time society is.
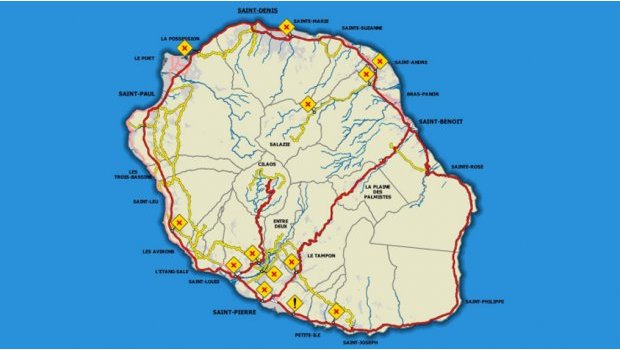 25/11/2018 Road blocks in Réunion
https://www.linfo.re/la-reunion/societe/barrages-le-point-sur-le-reseau-routier
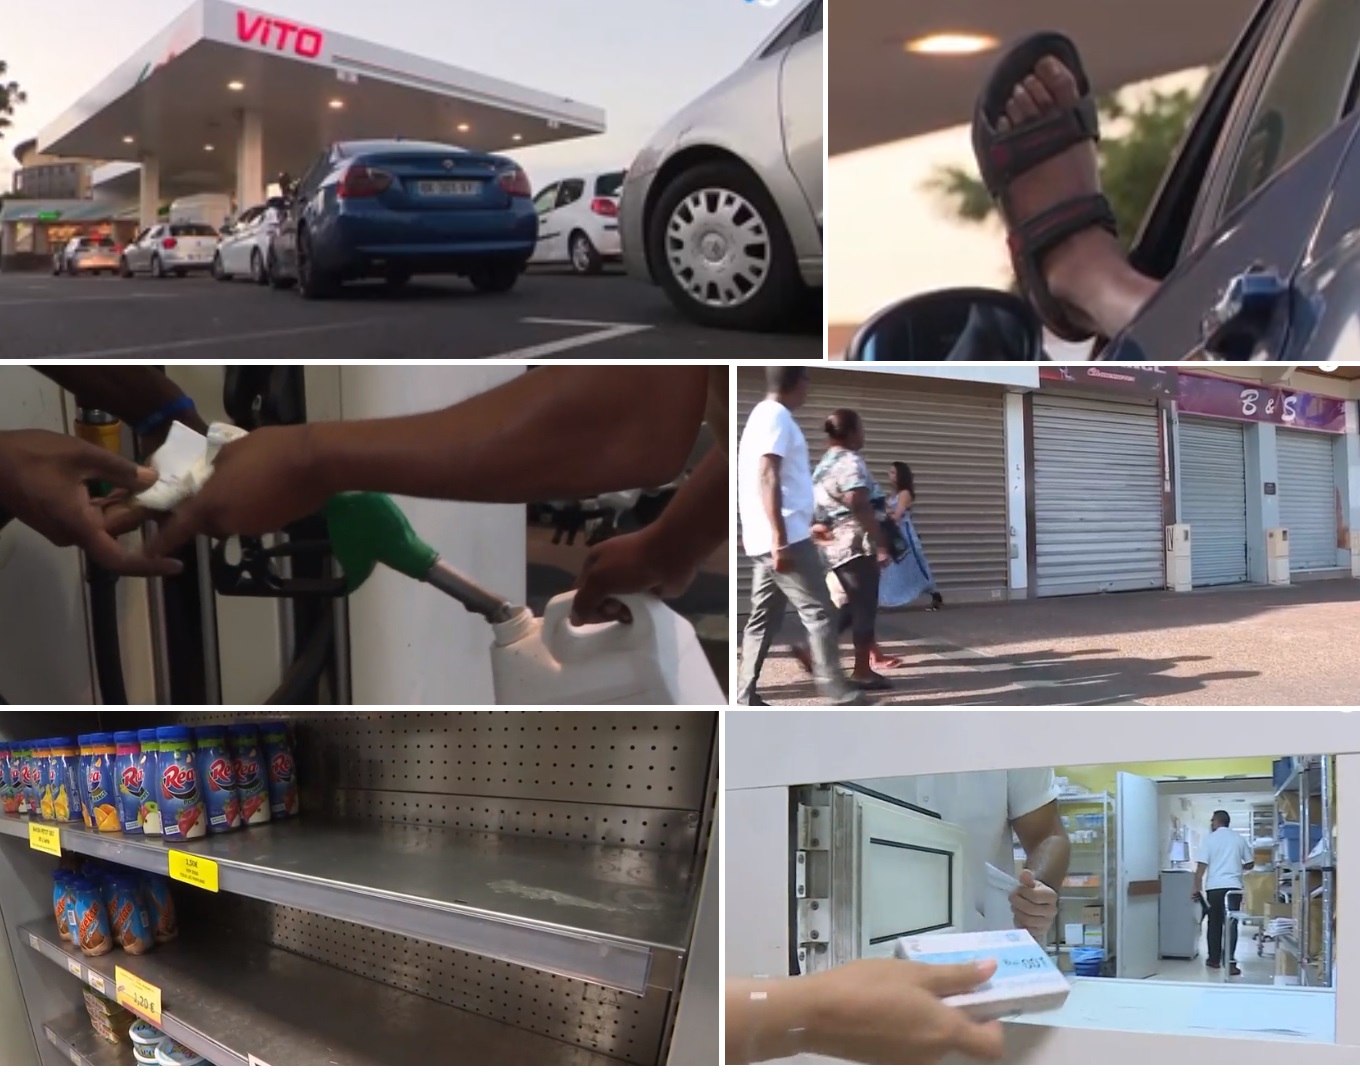 Petrol lines in St Denis, €20 rationing, shops closed, shelves emptying, medical supply disruptions
https://www.francetvinfo.fr/economie/automobile/essence/la-reunion-une-ile-asphyxiee_3048073.html
Oil statistics
European oil production peaked in 2000 at almost 7 mb/d, with a production plateau above 6.8 mb/d lasting for 7 years between 1996 and 2002. 17 years after the peak, production was around half of what it was at peak.
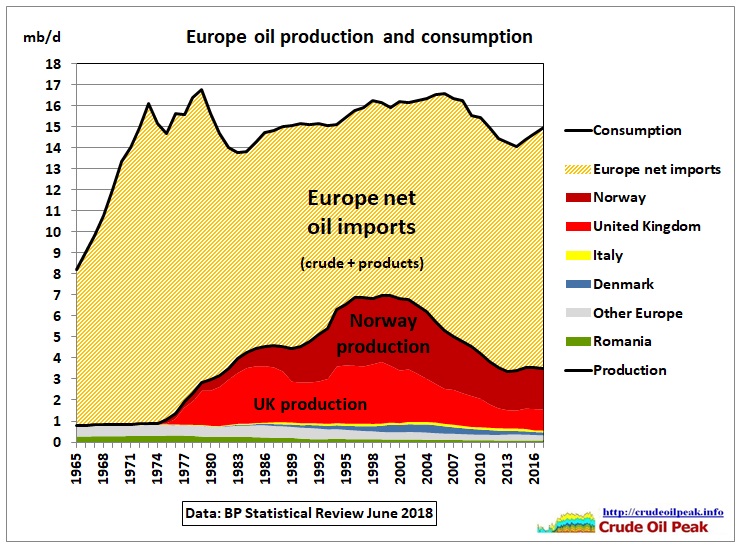 Fig 1: Europe oil consumption, net oil imports and production
BP’s definitions are as follows: “Oil production includes crude oil, shale oil, tar sands and NGLs (natural gas liquids – the liquid content of natural gas where this is recovered separately). It excludes liquid fuels from other sources such as biomass and derivatives of coal and natural gas.
Oil consumption is from inland demand plus international aviation and marine bunkers and refinery fuel and loss. Consumption of biogasoline (such as ethanol), biodiesel and derivatives of coal and natural gas are also included.
Notes: Differences between these world consumption figures and world production statistics are accounted for by stock changes, consumption of non-petroleum additives”
In Fig 1 and 3, net oil imports are calculated as the difference between production and consumption.
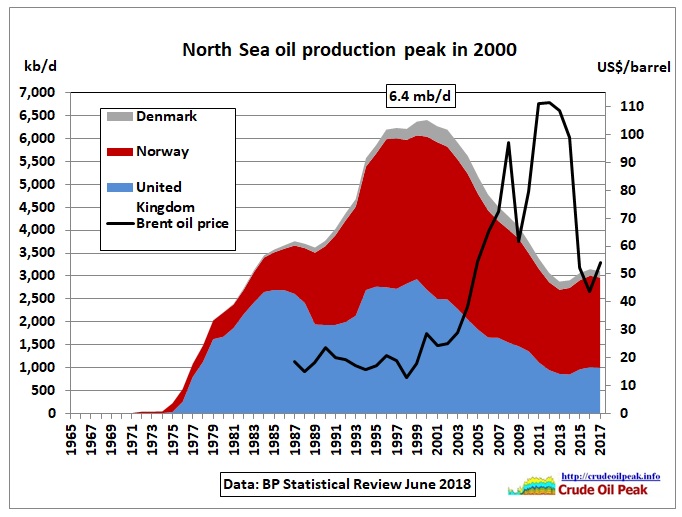 Fig 2: Oil prices went up after the North Sea peak
The peak (>6.1 mb/d) lasted for 7 years between 1996 and 2002.
We re-stack Fig 1 to show imports more clearly:
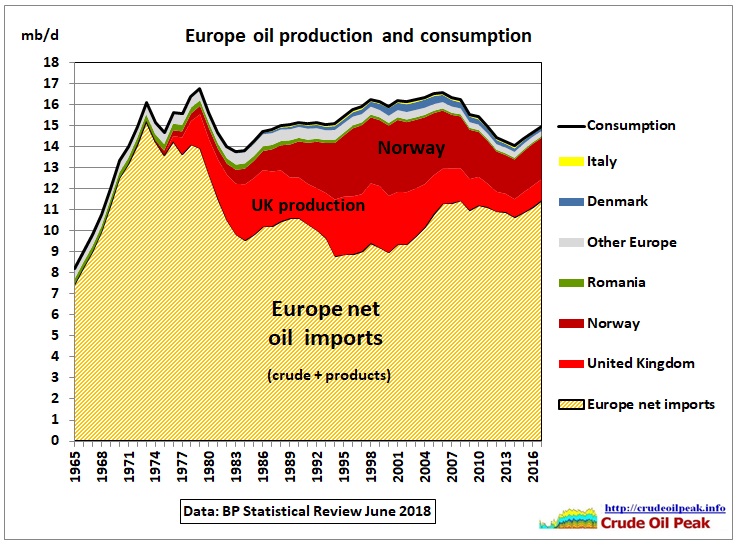 Fig 3: Europe net oil imports, production and consumption
Note that imports increased after the North Sea production peak in order to maintain (and slightly increase) consumption. It started to decline during and after the financial crisis. Lower oil prices since mid 2014 resulted in an increase in oil consumption, mainly diesel and jet fuel (see Figs 13 and 14)
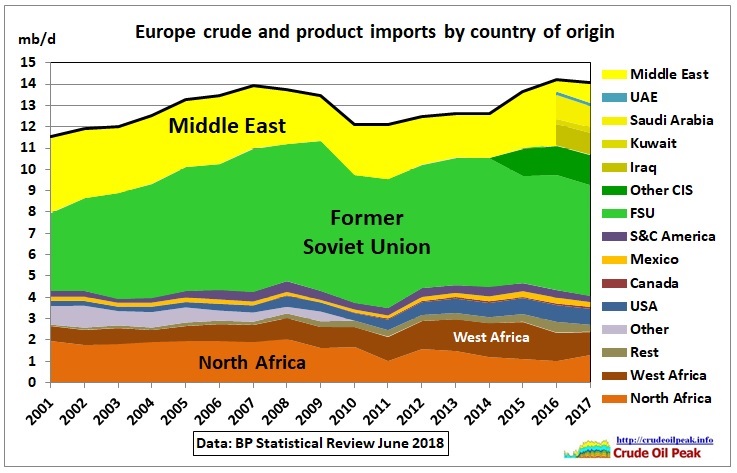 Fig 4: Europe’s crude and products imports by country
From work sheet “inter area”
The import dependency on Russia is clearly visible. A recent increase, however, has come from the Middle East.
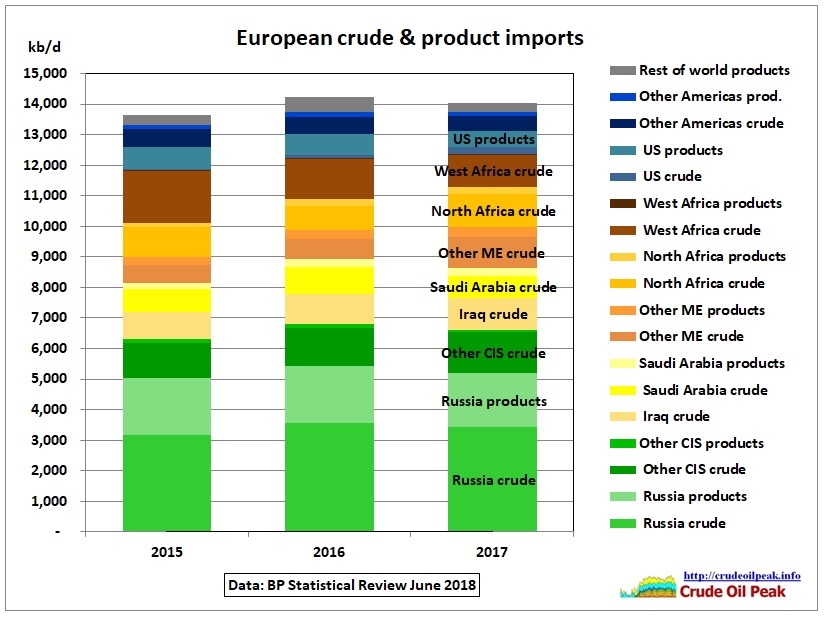 Fig 5: European crude and product imports by country
Separate inter-area data for crude and product imports by country are only available from 2015. The imports are mainly crude. Product imports are from Russia and the US.
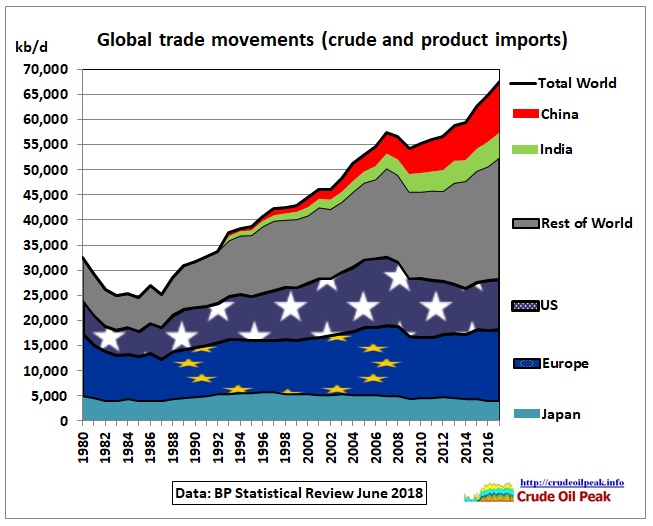 Fig 6: Global oil trade movements
Europe’s share of global oil trade was 21% in 2017, down from 38% in 1980.
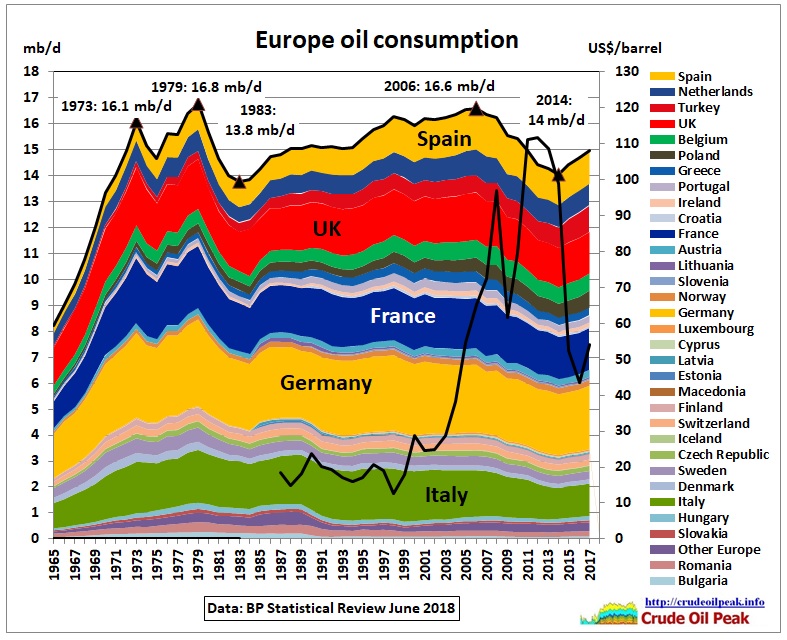 Fig 7: Europe oil consumption by country
European oil consumption grew without interruption until 1973 (1st oil crisis) and then peaked in 1979, the year of the 2nd oil crisis (peak oil in Iran). This caused a recession and oil demand dropped. There were also structural adjustments like closing down oil fired power plants, introducing more fuel efficient vehicles etc. But consumption growth recovered after 1983 although at a much slower pace than before the 70s and not in all countries. Countries in the above graph are stacked in the order of increasing consumption growth up to 2006 – the next turning point – as shown in the following graph:
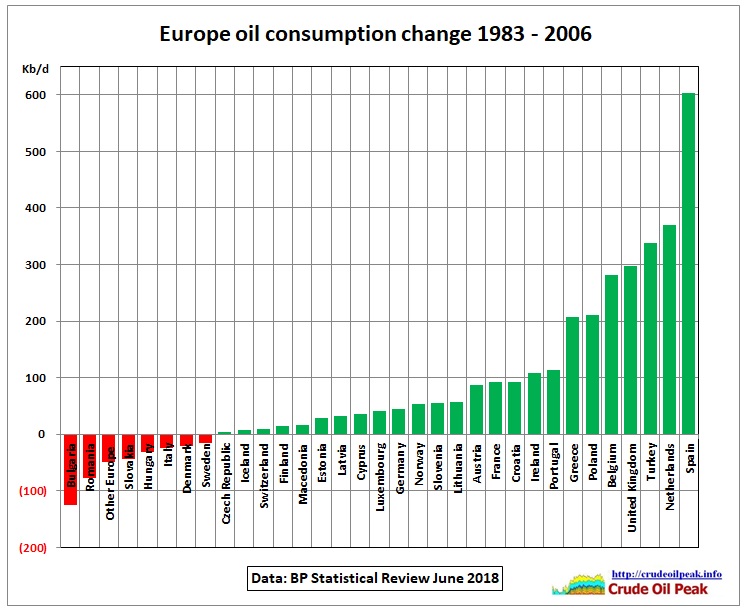 Fig 8: Oil consumption growth 1983-2006
The graph above shows that consumption in Greece, Poland, Belgium, UK, Turkey, Netherlands and Spain increased most between 1983 and 2006
In 2006, when oil prices reached $60 a barrel, 3 times the 1990s average, consumption peaked at almost the same level as 1979. It then dropped until 2014.
 Fig 9: Europe oil consumption
This is the same graph as Fig 7 but stacked in the order of lower consumption drops after 2006
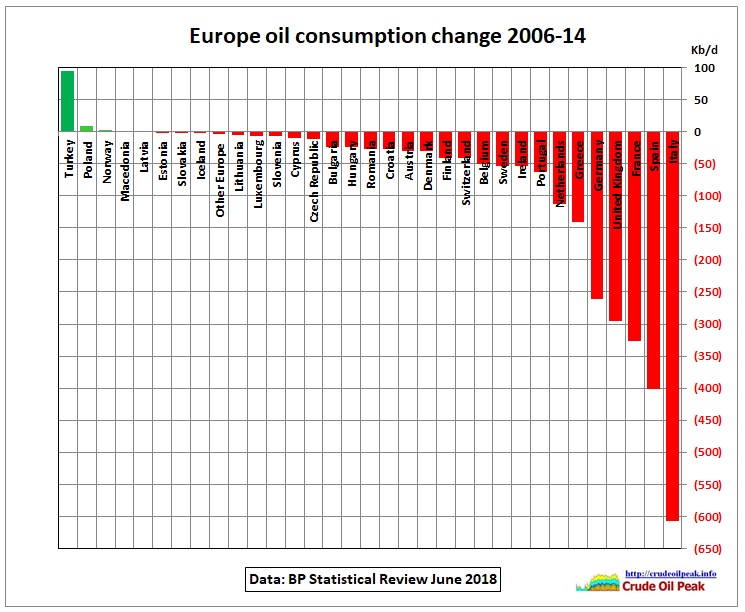 Fig 10: Drop in oil consumption 2006-14
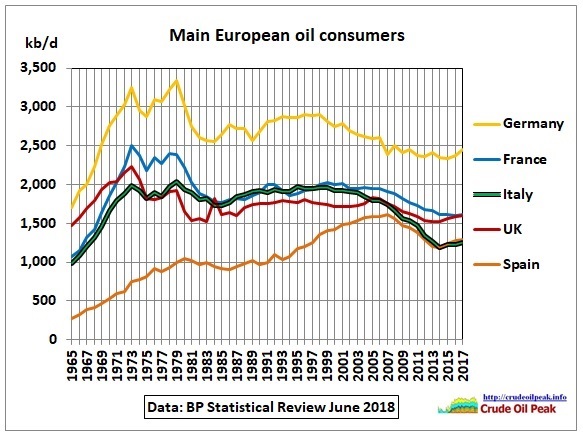 Fig 11: Main European oil consumers
The consumption curves in Fig 11 have the same shapes except for Spain and Italy. As an example, let’s pick Europe’s main oil consumer, Germany:
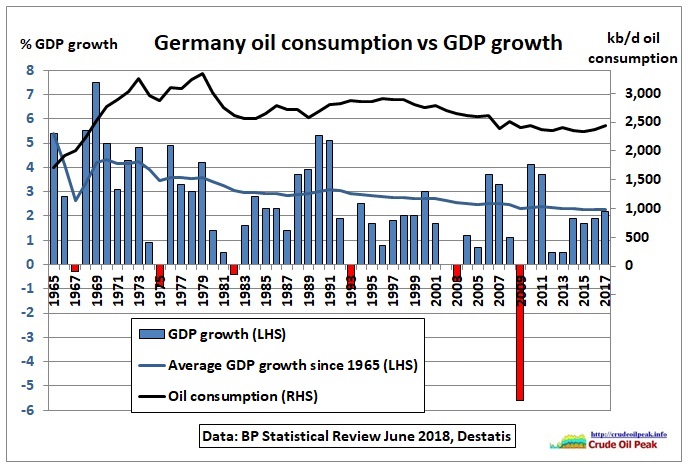 Fig 12: German oil consumption vs GDP growth
There is a long term decline of GDP growth in Germany which started with the oil crises in the 1970s.
Consumption by fuel
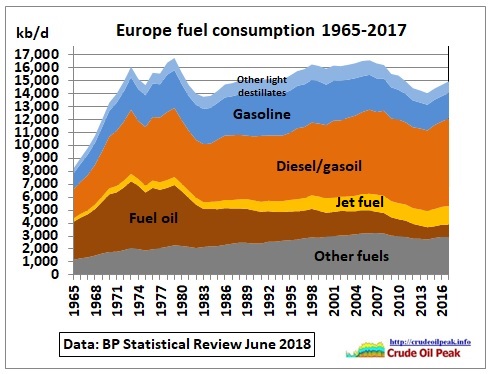 Fig 13: Europe oil consumption by fuel type (stacked)
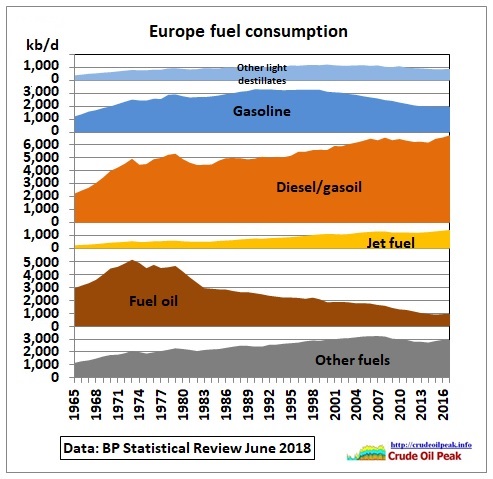 Fig 14: Europe oil consumption by fuel type
Use of fuel oil (e.g. in power plants) was steadily reduced after the oil crises in the 1970s but seems to have leveled out since 2013.
Consumption of jet fuel has been increasing. Gasoline consumption has peaked already in the 1990s and then declined but has recently stabilized. Diesel consumption has grown relentlessly as the share of diesel cars in the car fleet has increased. In so far it mirrors the decline in gasoline consumption. The fall of the iron curtain meant that road freight as well as car ownership in the East increased.
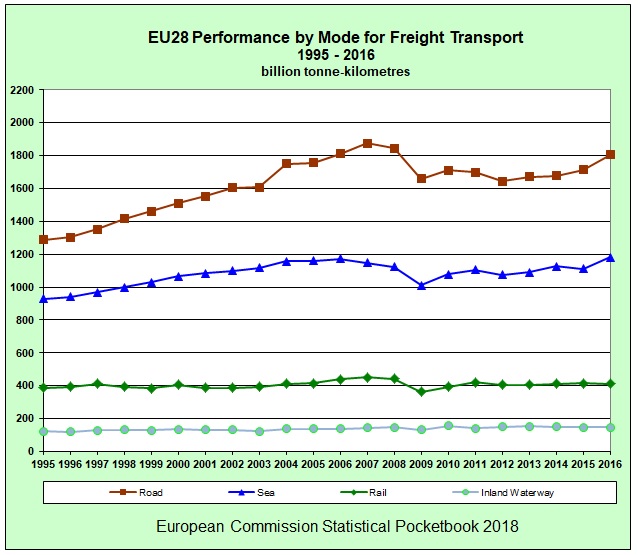 Fig 15: EU 28 Road, sea and river transport
https://ec.europa.eu/transport/facts-fundings/statistics/pocketbook-2018_en
The impact of the 2008 oil price shock and the financial crisis it caused is clearly visible. Diesel dependent road freight dipped by 12%, rail by 10% but both recovered to previous levels. There is no indication that (electric) rail is replacing road transport to reduce oil dependency. In the meantime, a 5 km test lane has been built on the highway A5 between Frankfurt and Darmstadt for electric trucks:
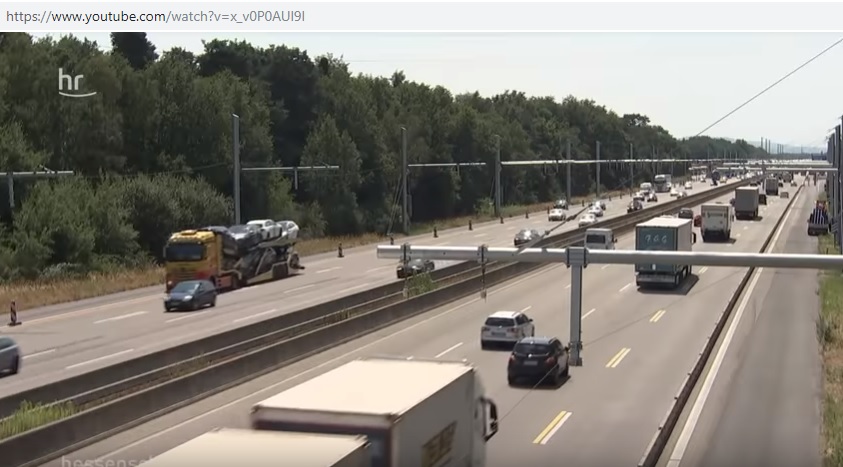 Fig 16: Overhead wires have been installed on the A5 for tests in early 2019
https://www.youtube.com/watch?v=XiOuBrFC8NM
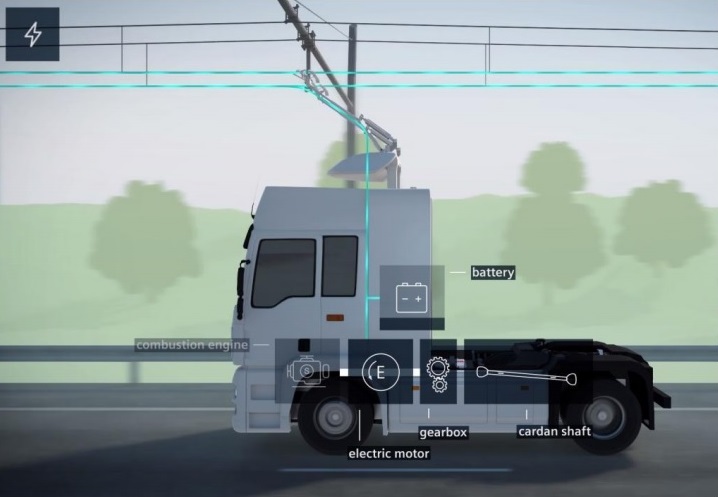 Fig 17: Hybrid truck with diesel engine, electric motor and battery
http://www.set-nav.eu/content/scheduled-set-nav-stakeholder-workshop-14-may-2018-brussels-belgium
https://great-region.org/wp-content/uploads/2018/02/Patrik_Akerman_Siemens.pdf
Existing trucks cannot be converted. Interestingly, not oil depletion but the need to reduce annual CO2 emissions is used as an argument to promote this electrification, with power coming from renewables. Of course, due to lower friction, energy efficiency of rail is much higher than for trucks.
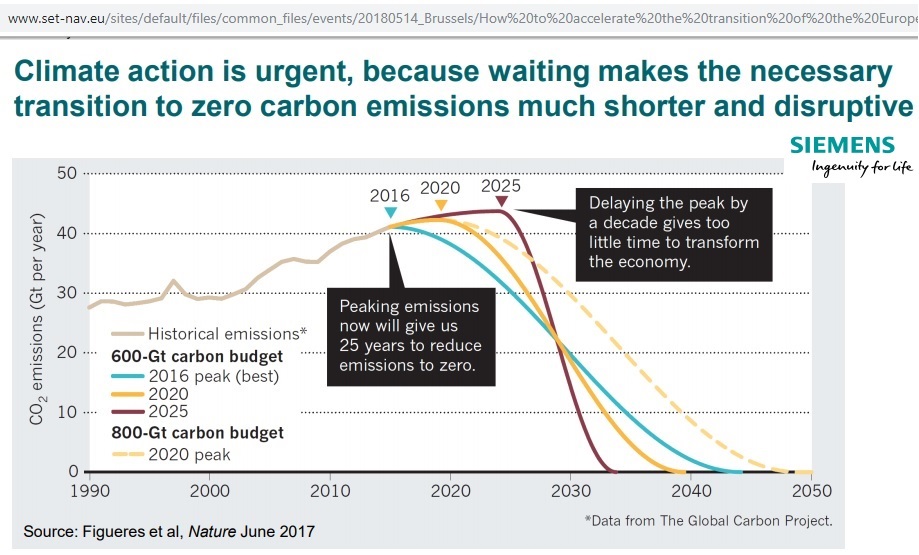 Fig 18: Transition paths as function of peak annual emission years
http://www.set-nav.eu/content/scheduled-set-nav-stakeholder-workshop-14-may-2018-brussels-belgium
And that brings us back to the beginning of this article: France’s climate change commitments trigger rising diesel prices and street protests
Conclusion: Peak oil and climate change are an incredible double whammy