Total crude oil exports peaked at 44.4 mb/d in 2005 and declined by 3.1 mb/d to 41.3 mb/d in 2009, double the rate at which crude production declined during the same period (from 73.8 to 72.3 by 1.5 mb/d).
Net exports (total exports minus imports among oil exporters) peaked at 40.6 mb/d, also in 2005, and declined by 3.1 mb/d to 37.5 m/d in 2009. This decline of around 800 kb/d pa would increase to 1.4 mb/d pa once a yet growing group of exporters (40% of exports) started to reach a plateau (like Russia).
When deducting exports to China and India from these net exports, only 31 mb/d (or 43% of total crude production) remained available for the rest of the world to import in 2009.
Even if crude production stayed flat until 2020, net available crude exports could shrink by around 1/3 in this decade. If crude production declined by around 8 mb/d as predicted by Prof. Aleklett from ASPO, this would increase the export decline accordingly. None of these scenarios assume dramatic events like a depression or a war in the Middle East involving oil producers there.
Contents
(1) Crude oil production by type of producer
(2) Analysis of crude oil exports and comparison with crude oil production
(2.1) Net crude oil exporters
(2.1.1) Declining group of net exporters
(2.1.2) Growing group of net-exporters
(2.2) Group of net oil importers
(2.3) US, China and India
(2.4) Minor crude exporters
(2.5) Available net crude oil exports
(2.6) Impact on importing countries
(2.7) Statistical differences
(2.8) Net crude oil exports/imports by region
(2.9) Summary of decline rates
(3) Outlook
(3.1) Scenario bumpy crude oil production plateau until 2020
(3.2) Production decline scenario
(1) Crude oil production by type of producer
First, we look at how much of the total crude oil production is used for local consumption and how much for exports. We distinguish:
(a) oil producers where exports > imports (net exporters), 80% of global crude production
(b) oil producers where exports < imports (net importers), 5% of global crude production
(c) US, China, India, (no crude oil exports), 14% of global crude production
(d) Minor producers (rest, negligible exports), 1% of global crude production

For the last 6 years, crude production from net exporters (a) has been practically flat, at around 59 mb/d.
Note that export statistics are not yet available for 2010 (EIA budget cuts)
(2) Analysis of crude oil exports and comparison with crude oil production
(2.1) Net crude oil exporters

Crude exported from net exporters declined from 42 mb/d to 39.4 mb/d or by 2.6 mb/d. Imports were fairly steady at around 1.9 mb/d.
Among the net exporters there are 2 groups, one with growing and another with declining exports.
The overall decline of 2.6 mb/d in crude exports results from a much larger decline of 5.3 mb/d (4.6% pa) in a declining group (60% of exports) and a partially offsetting growth of 2.6 mb/d (4.9% pa) in a growing group (40% of exports).
 This graph shows the trends. When the growing group starts to go over into a plateau, all exports will decline by 4.6 % pa.
(2.1.1) Declining group of net exporters
 Crude production in this group declined 4.3 mb/d between 2005 and 2009 (2.9% pa) and local consumption of crude increased by 1 mb/d or 2.5% pa, thereby reducing exports by that additional amount to a total of 5.3 mb/d.
This group also imported 260 kb/d, so net oil exports were marginally lower.
(2.1.2) Growing group of net-exporters
This group’s exports are on a long term growth path and grew by 2.6 mb/d or 4.9% pa between 2005 and 2009.

46% of exports come from 3 FSU countries. Russia (5.4 mb/d), which was basically flat since 2004 increased only in 2009 by +300 kb/d. But Kazachstan and Azerbaijan boosted exports by 590 Kb/d over the same period. Canada and Qatar a modest +180 kb/d. Iraq, a continuing wild card, increased by +440 kb/d. Angola beat them all with +600 kb/d. Brazil and Colombia are also noteworthy with +390 kb/d together.
This group also imports around 1.6 mb/d, mainly by Canada (East coast) and Brazil.

Candidates from the growing group for future declining net exports are those oil producers where
- crude oil production has already peaked
- exports are high compared to production
- domestic consumption growth is high
- political events exacerbate declining crude production
Malaysia and Syria are examples


Results of the above calculations are put in the first graph shown above. Out of 57.8 mb/d crude oil production of net exporters:

(1) 18.4 mb/d are used by these exporters in local refineries
(2) 1.8 mb/d are imports from other exporters
(3) 14.4 mb/d exports available and growing at 0.6 mb/d pa
GO FOR IT!
(4) 23.2 mb/d exports available and declining at 1.4 mb/d
FIGHT FOR IT!
(2.2) Group of net oil importers
These countries are oil exporters but they have become net oil importers due to declining crude production and exports. The cross-over year for this group was in 2004:
 The best example in this group is UK

Crude oil production from this group peaked between 1996 and 1999. A 9-year long export plateau at around 3 mb/d ended 2 years later in 2001/02. Since then, in just 7 years, exports have almost halved.

(2.3) US, China and India
Crude exports from these countries are now negligible (around 100 Kb/d)
 US crude oil imports increased by 6 mb/d over 18 years (while crude production declined by 3 mb/d) and peaked at 10 mb/d between 2004 and 2007
By contrast, China’s imports increased “only” by 3.8 mb/d over the last 18 years while crude production increased by 1.2 mb/d.

Considering that China
- imports as much crude oil as the US 25 years ago
- produces just half of what the US did in the mid 80s
- has a population more than 4 times that of the US
we get an idea how far China has to go to catch up.
India’s crude production is practically flat and imports increased at a slower pace of 2.1 mb/d over an 18 year period. The scale of potential demand for crude oil imports is equally mind-boggling.

(2.4) Minor crude exporters
This is a mixed bag of minor producers and small exports from the main group of crude oil importers.

Examples of countries in this group: Italy, Germany, Netherlands, Pakistan, Peru, Philippines, Ukraine, Ivory Coast
(2.5) Available net crude oil exports
We add up the results from the previous chapters and find that total exports are reduced by 3.8 mb/d (exports=imports between oil producers) to 37.5 mb/d of net crude exports in 2009, down by 3.1 mb/d from 40.6 mb/d in 2005 or 2% pa.

But when looking at net oil exports available to the world outside China and India, the decline was 5 mb/d from 36 to 31 mb/d or 4% pa.
(2.6) Impact on importing countries
So which countries reduced their imports? We look at the changes with 2005 as the base year. Reductions were around 500 kb/d pa between 2006 and 2008 but then jumped in 2009, the year of the recession after the financial crisis end 2008.

The US was the largest contributor with a reduction of 1.1 mb/d, followed by Japan with 700 kb/d. The 3rd largest country to reduce imports was Germany with 300 kb/d. These 3 countries together made up around 50% of all reductions. The total reduction was 4 mb/d. So where is the remaining 1 mb/d?
(2.7) Statistical differences
While in year 2005 exports and imports were almost equal, they did not match in the following years. In 2009, imports were 934 Kb/d (or 2.2%) higher than exports.

The total amount of crude oil imports between 2005 and 2009 was higher than exports by 1.9 Gb or 25 days worth of supplies. Not much of this could have come from inventories because total industry stocks are only 1.2 Gb
http://www.theoildrum.com/files/iea_oil_stocks.png
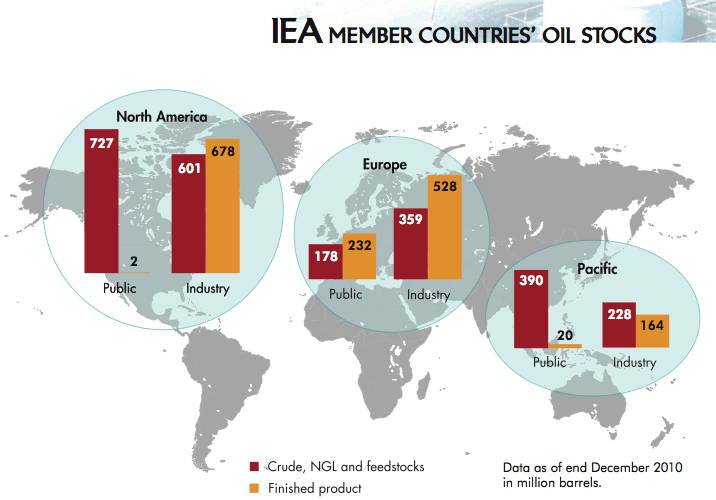
and if they had been tapped into to a large extent, that would have been reported and noticed.
So we have to note that there are some unexplainable differences here.
(2.8) Net crude oil exports/imports by region

We see that – on a net basis – Asia imports as much as the whole Middle East exports. Europe needs more than Eurasia can deliver and the US import requirement is equivalent to the whole African exports.
(2.9) Summary of decline rates
So for the years 2005-2009, which included
- a period of increasing oil prices and the Olympic boom year in 2008
- 2 years of recession in the US due to the combination of high petrol prices and high mortgage debt in car dependent suburbia, followed by quantitative easing
- 1 year recession in other OECD countries suffering from the delayed impact of high oil prices and a financial crisis which at least partially was also triggered/caused or exacerbated by high oil prices
- 4 years of increasing oil demand from India and China @ + 500 kb/d pa
- 4 years of increasing oil consumption in oil producing countries @ + 750 kb/d
we found, over 4 years:
Crude oil decline -1.5 mb/d
Export decline -3.1 mb/d
Available net exports to importers
outside Chindia -5 mb/d
Actual reduction in imports by
importers outside Chindia – 4 mb/d
This suggests that even if crude production stayed flat, we can expect a decline in available net oil exports between (5-1.5)/4 = 900 kb/d and (4-1.5)/4 = 600 kb/d.
(3) Outlook
(3.1) Scenario bumpy crude oil production plateau until 2020
In 2010, crude production has rebounded to 2005 levels. We do not have statistical data to tell us how that oil was distributed among oil importers. But let us assume we are going to have similar periods like the one between 2005 and 2009, maybe of different length (but no depression and no oil or other war in the Middle East). This would be the crude oil production scenario in the IEA’s WEO 2008 which is basically flat.

Despite crude production not declining, we are going to see a continuous erosion of global net oil exports available to the main importers at the rate of between 600 and 900 kb/d pa. Given that the growing export group (2.1.2) may peak in this decade, decline rates would rather be in the higher than the lower range. Therefore, by 2020, this may add up to a decline of around one third of currently available exports.
(3.2) Production decline scenario
Prof. Aleklett from ASPO has calculated that the IEA assumed too high extraction rates and that crude production may be 6.8 to 7.5 mb/d lower between 2015 and 2020.

Such a production decline will lead to a further reduction in available net oil exports, resulting in oil shortages which will go beyond the experience of anyone who did not go through the 1st and 2nd oil crisis in the 70s.

Swiss freeway during Sunday driving bans in 1973.
Further reading:
Rebuttal to Daniel Yergin’s “There will be oil” in the Wall Street Journal
By Jeffrey Brown