This article follows 2 earlier posts on power price spikes in May 2021 (Tomago alu smelter load shedding and Callide C4 explosion)
It is easy enough to click on the following link of the National Electricity Market (NEM) to get the percentage of coal used by power plants:
https://opennem.org.au/energy/nsw1/?range=7d&interval=30m
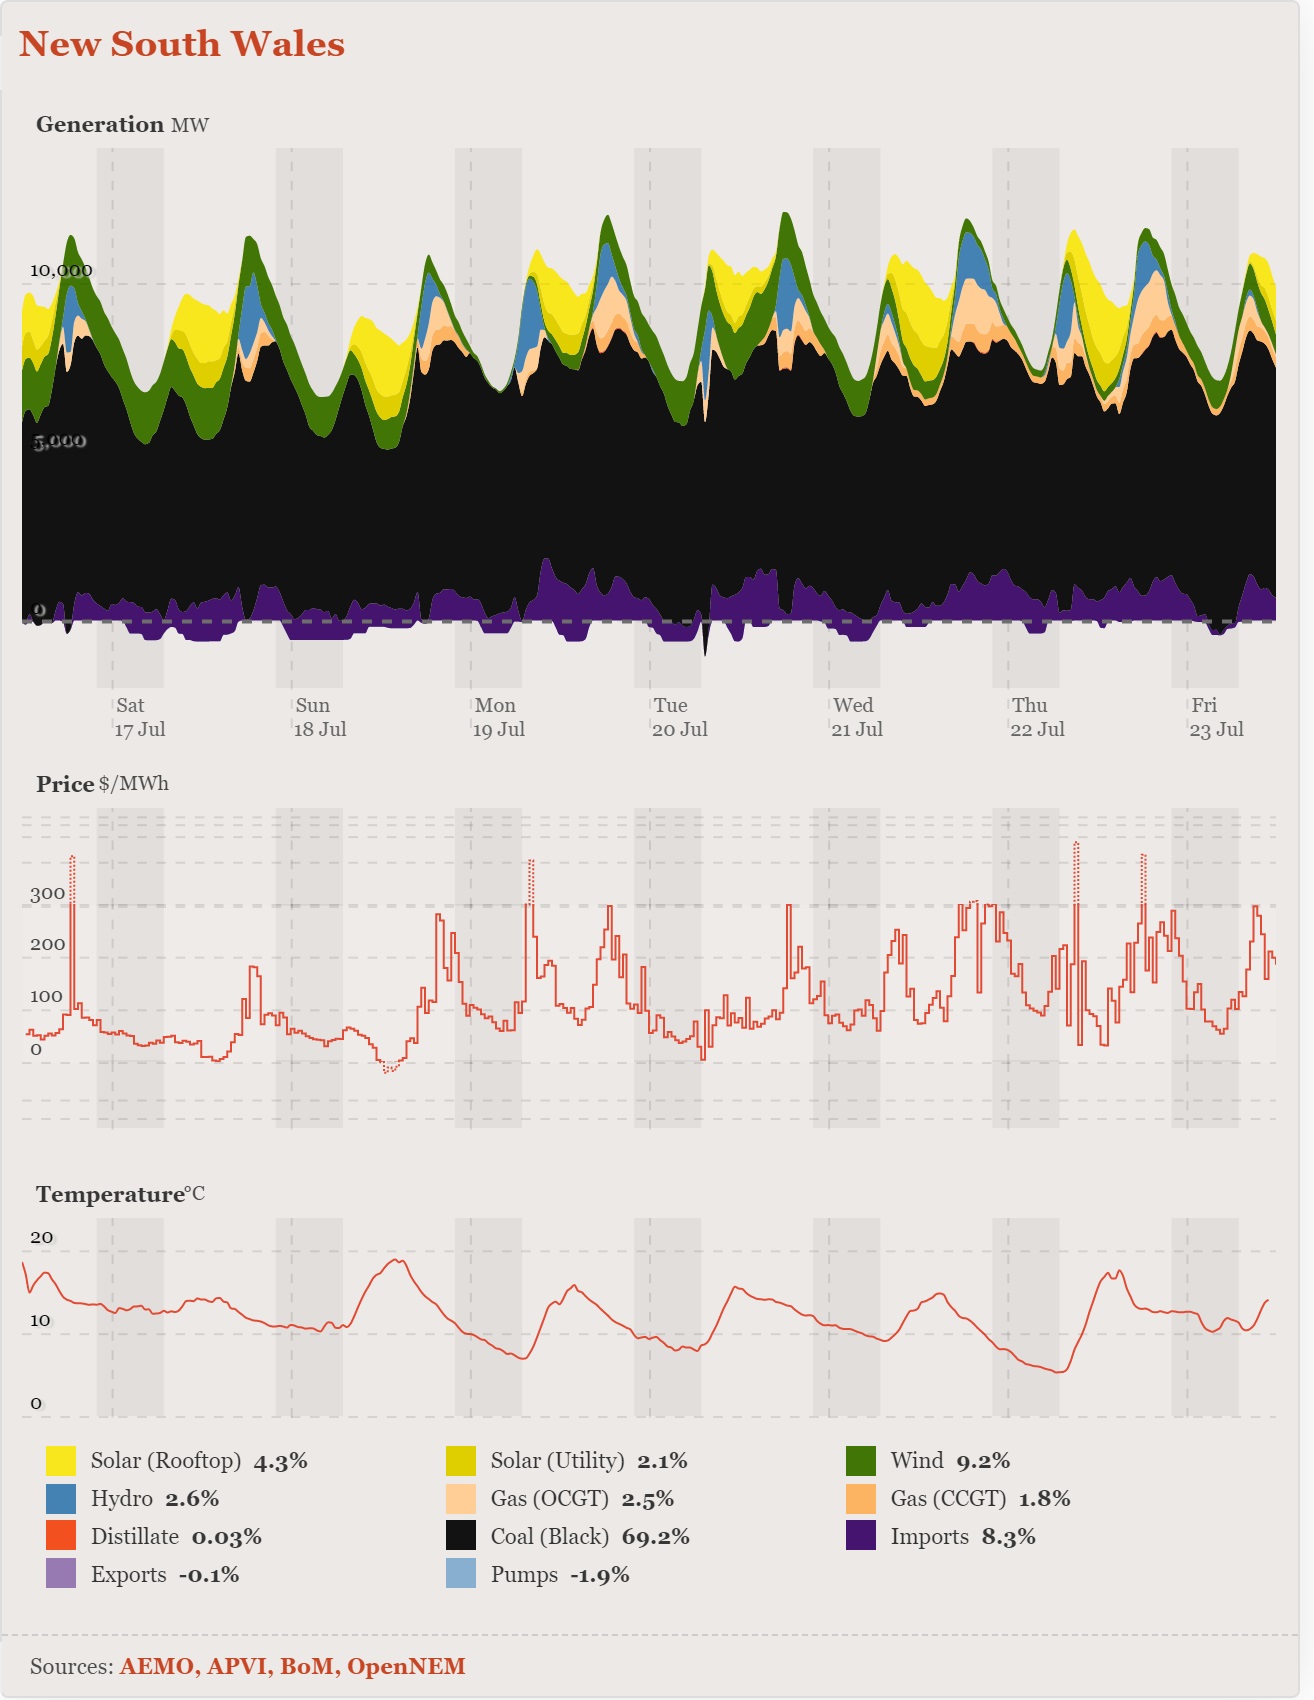 Fig 1: NSW power generation by source of primary energy for 7 days in July 2021
Note there was a lot of wind on 17/18th and 20th July. The afternoon peaks need gas and (pumped) hydro.
The dependency on coal was around 70% over 7 days (even higher as power imports from Queensland and Victoria also contain coal; pumped hydro may also be powered by off-peak coal). Let’s go through the list of NSW coal plants from AEMO (Australian Energy Market Operator)
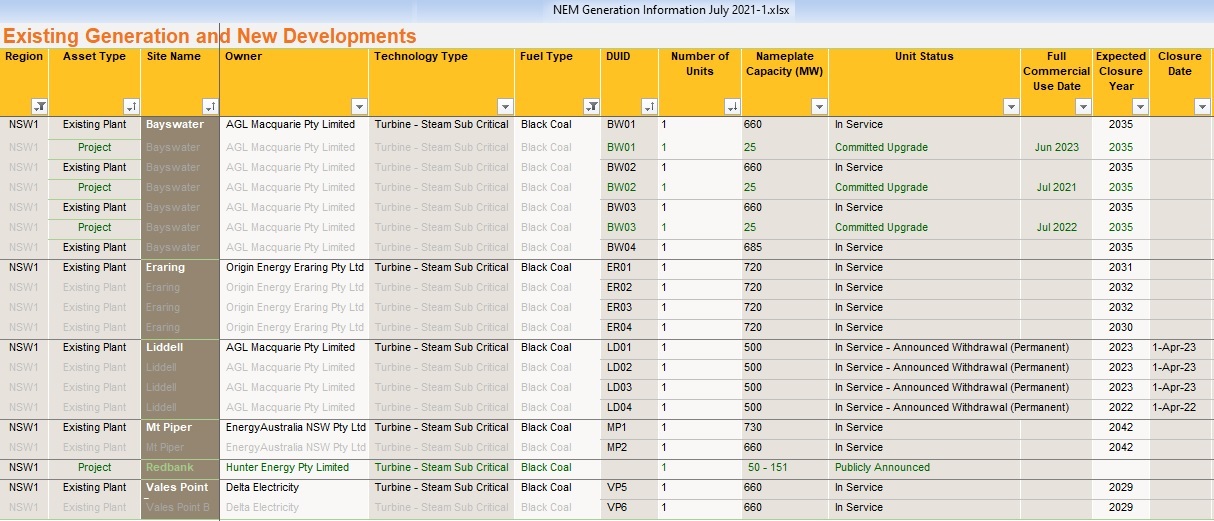 Fig 2: AEMO’s generation information for NSW coal plants (dated 13/7/21)
https://aemo.com.au/en/energy-systems/electricity/national-electricity-market-nem/nem-forecasting-and-planning/forecasting-and-planning-data/generation-information
Note that 3 days later on 16/7/21 the Australian Energy Regulator (AER) granted AGL’s application of 30/4/2021 to swap the closure of Liddell units 4 and 3:
Under the exemption, LD03 will close on 1 April 2022. AGL will then delay the closure of LD04 to 1 April 2023.
https://www.aer.gov.au/communication/agl-provided-exemption-from-notice-of-closure-requirements-to-improve-reliability
Compared to the May 2021 version of the above table, Bayswater upgrades (3×25 MW committed) were added. The Redbank power plant has shut down in August 2014 (change log, line 447). There are controversial plans of the current owner of the site to use 1 mt pa of woodchips as fuel source.
https://www.verdantearthtechnologieslimited.com/wp-content/uploads/2021/02/Redbank.pdf
NEM also publishes data on individual power plants and their units:
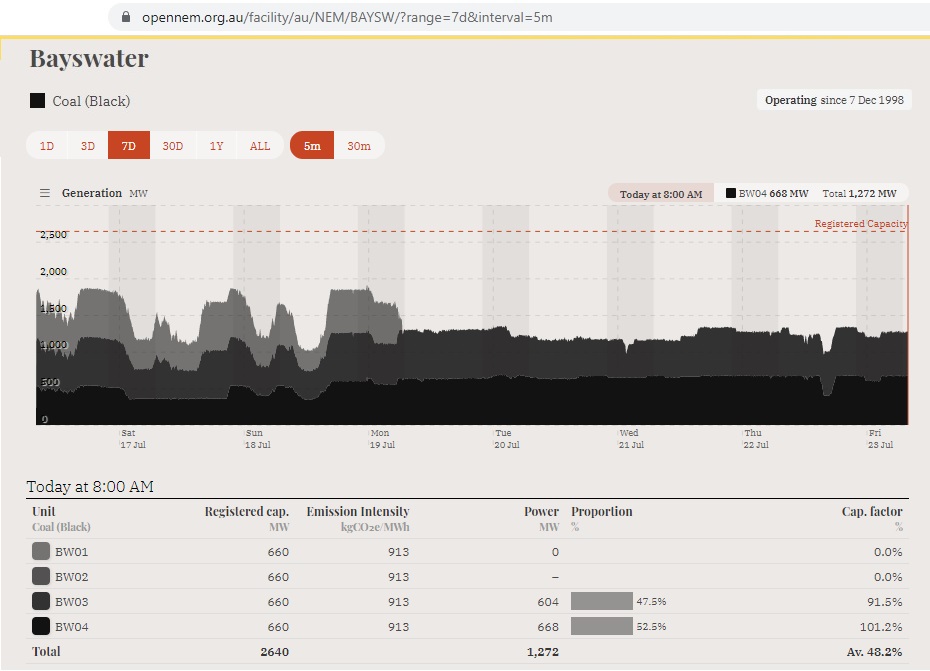 Fig 3: Bayswater: BW02 was not in operation
https://opennem.org.au/facility/au/NEM/BAYSW/?range=7d&interval=5m
BW01 stopped on the 19th in the middle of the night. That was the beginning of the week. When writing this article, it had not come back. The following graph shows the daily generation over the day.
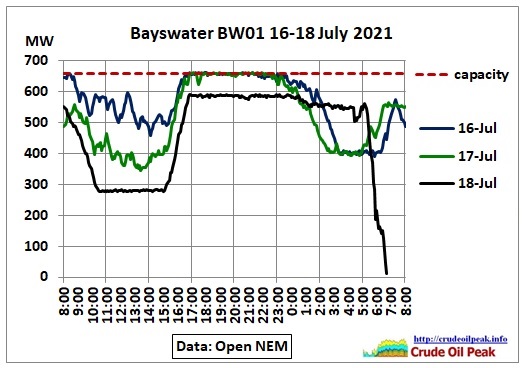 Fig 4: BW01 stopped on the 19th in the middle of the night
It was generating at 100% capacity between 5 and 11 pm the previous 2 days.
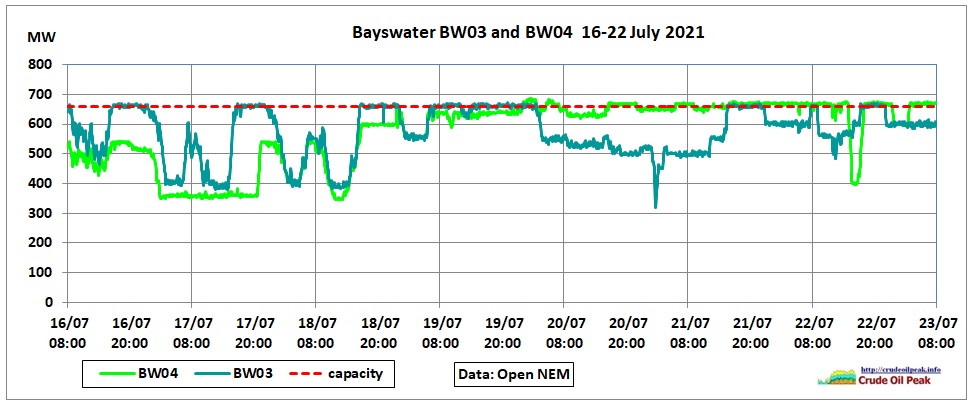 Fig 5: BW03 and BW04 testing capacity limits
After 3 days of following the ups and downs of demand patterns, BW04 was running at an average of 97% of capacity for the remaining 4 days with one short interruption. BW03 also tried hard to provide baseload but couldn’t.
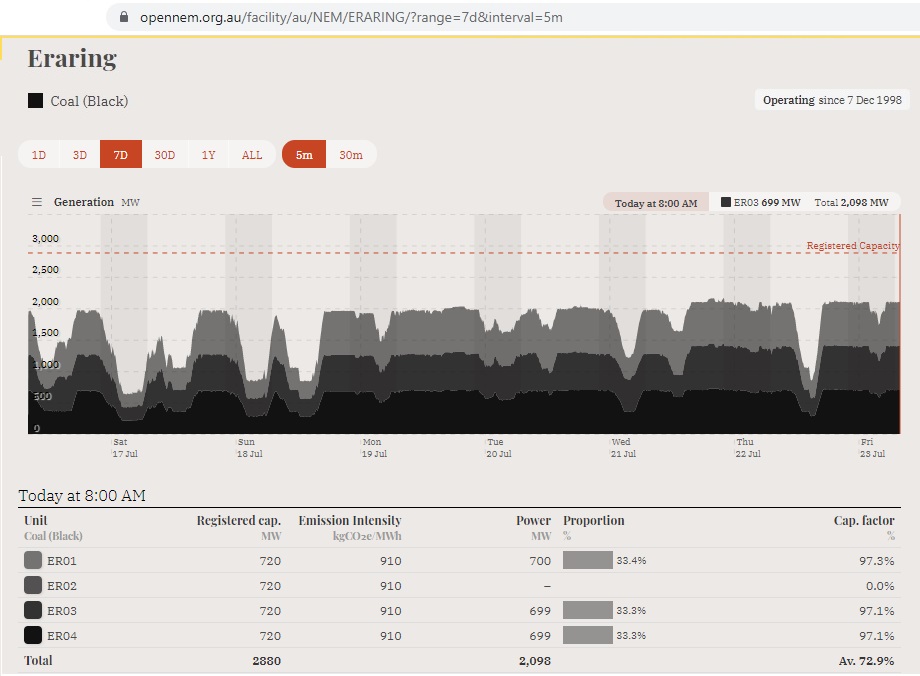 Fig 6: Eraring: ER02 was not in operation
https://opennem.org.au/facility/au/NEM/ERARING/?range=7d&interval=5m
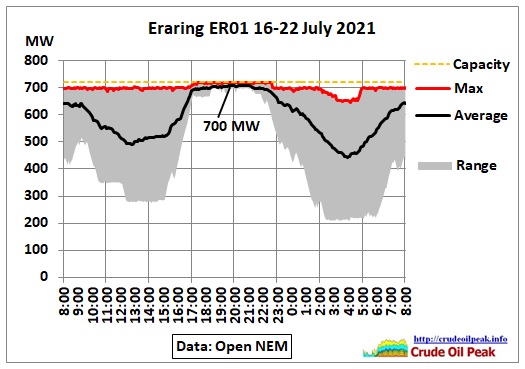 Fig 7: Eraring ER01 daily generation profile
Between 5 – 11 pm ER01 is running at an average of 97% of rated capacity of 720 MW. In the shorter morning peak it is 89%. The numbers for ER04 are similar. ER03 is operating at 86% in peak hrs with 100 MW to spare.
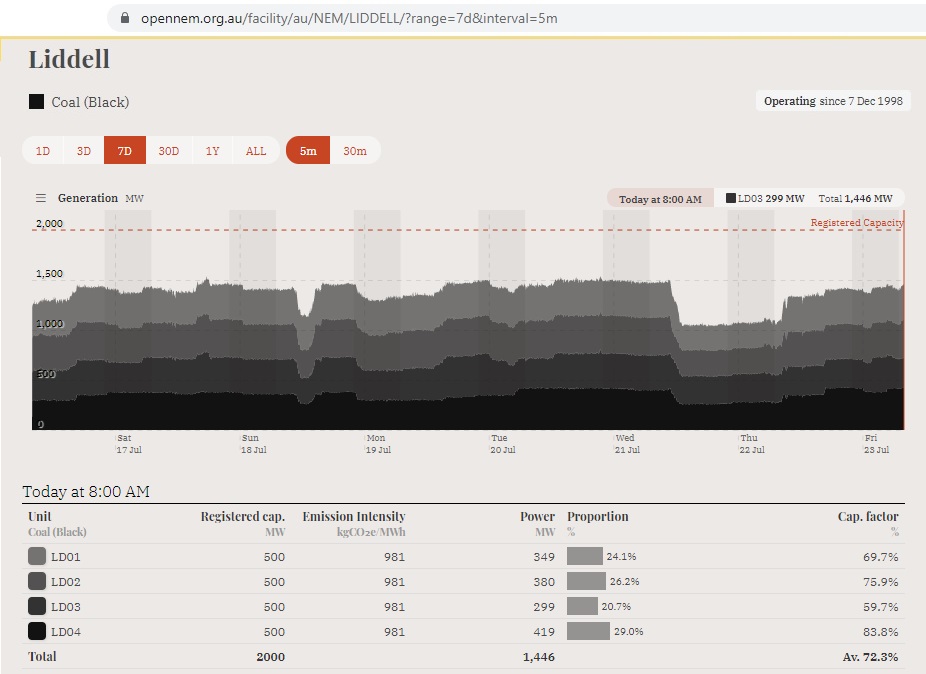 Fig 8: Liddell: All 4 units were in operation which is an achievement in itself
https://opennem.org.au/facility/au/NEM/LIDDELL/?range=7d&interval=5m
Sudden drops in all 4 units happened on 18 Jul and 21/7/21 at 10:45 (-450 MW). The registered capacity of 500 MW for each unit is highly theoretical. According to an analysis for the year 2020 from Watt Clarity the maximum output achieved was 375 MW (75%) per unit, with monthly maxima as low as 335 MW (LD01). LD03 will shut down in April 2022, after the next summer 21/22, the other units 1 year later (see table in Fig 2 and AER’s approval to swap closure of units 4 and 3).
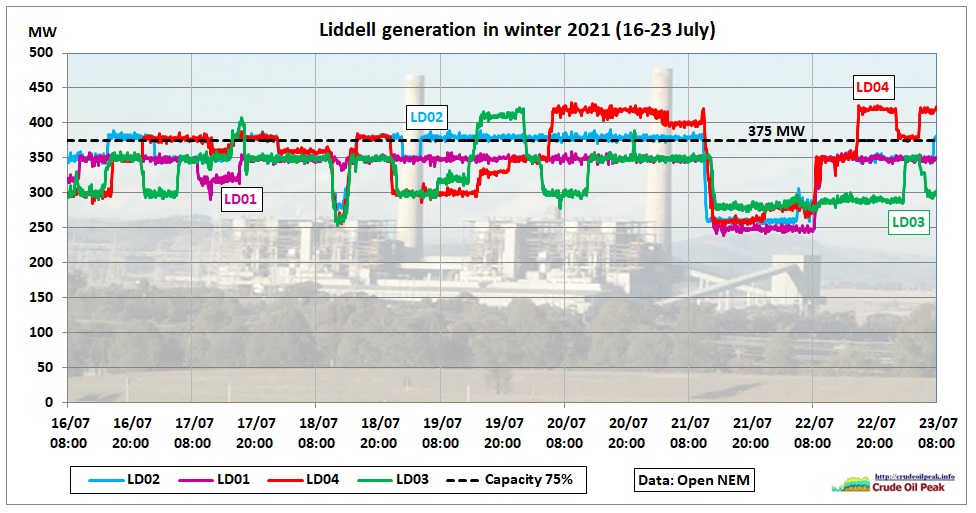 Fig 9: Liddell’s 4 units
We sum up the above graph and find that units were running between 93% and 102% during peak hrs (50-85% of the time)
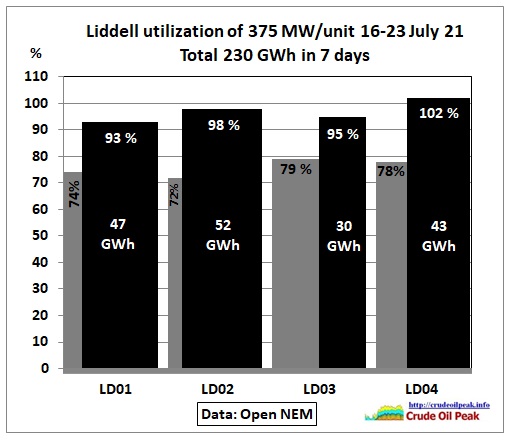 Fig 10: 75% of generation is running at 97% of capacity
The black columns represent generation running at >90% of 375MW with their respective % averages and output in MWh, the grey columns the off-peak operation. The width of the columns indicate the time the units are operating at these levels. LD03 stands out.
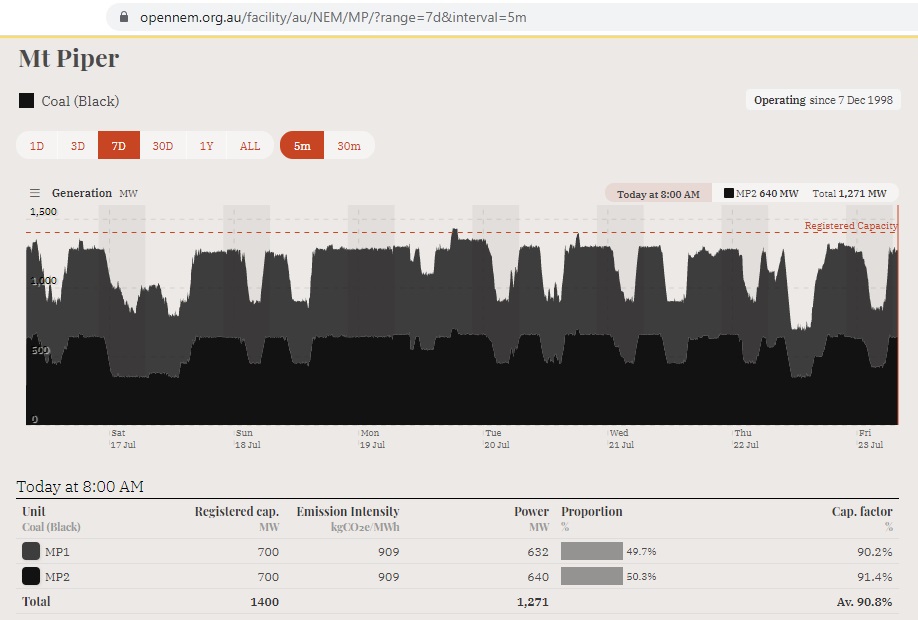 Fig 11: Mount Piper
https://opennem.org.au/facility/au/NEM/MP/?range=7d&interval=5m
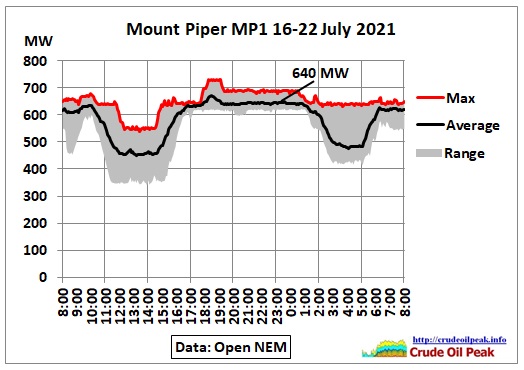 Fig12: MP1 daily generation profile
During peak hrs MP1 is generating at 640 MW or 91% of rated capacity. MP2 is similar with 650 MW
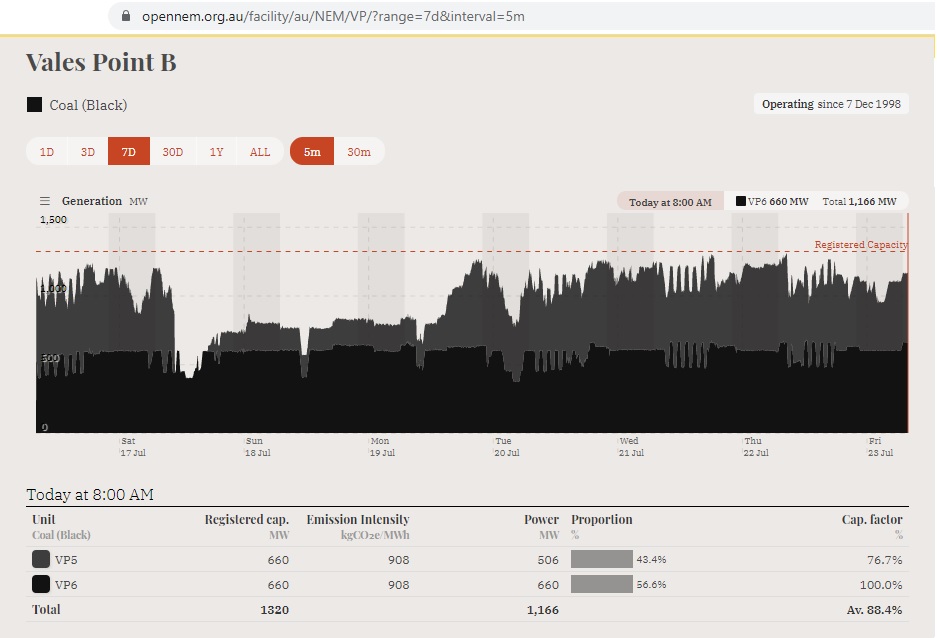 Fig 13: Vales Point highly variable output
https://opennem.org.au/facility/au/NEM/VP/?range=7d&interval=5m
Here is an example of non-conformance notices to Vales Point by AEMO
88420 NON-CONFORMANCE 19/07/2021 03:20:16 PM
NON-CONFORMANCE Region NSW1 Monday, 19 July 2021
AEMO ELECTRICITY MARKET NOTICE
NON-CONFORMANCE NSW1 Region Monday, 19 July 2021
AEMO declared a schedule generating unit non-conforming
Unit: VP5
Duration: 19/07/2021 15:15 to 19/07/2021 15:20
Amount: 59 MW
Constraint: NC-N_VP5
https://aemo.com.au/market-notices?marketNoticeQuery=&fromdate=&todate=&marketNoticeFacets=NON-CONFORMANCE#mnsr
There were similar AEMO market notices 88413, 88346, 88330, 88329, 88326, 88321, 88301
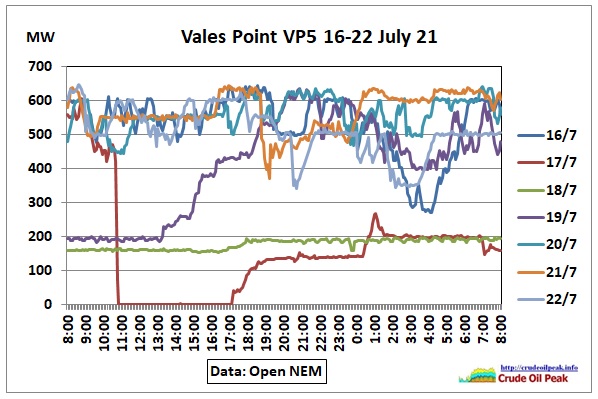 Fig 14: Erratic generation of Vales Point VP5
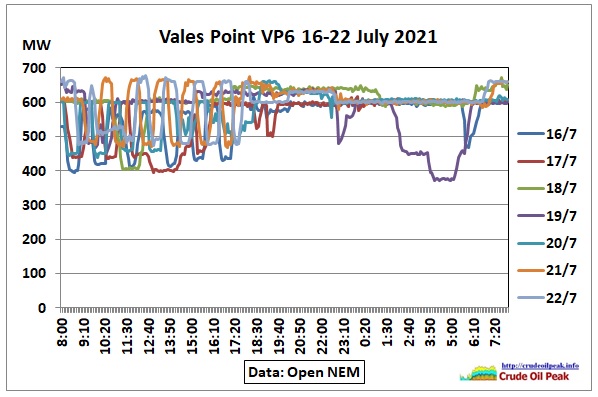 Fig 15: Zoom into the Zig Zag pattern shown in Fig 13
All together now.
It takes more than 1 link click and a screen shot to stack the units of all coal fired power plants. NEM data can be loaded into Jason files and the Windows utility JQ is used to extract the data into a CSV/XLS file for which a VBA program was developed to generate the following graph.
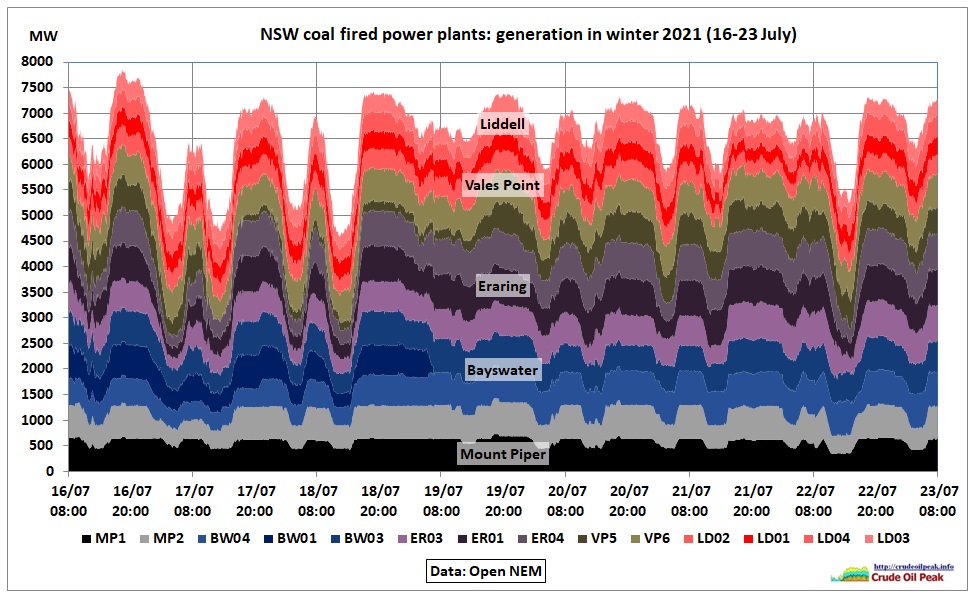 Fig 16: All NSW coal plants and units stacked
The vertical lines indicate the days at 8 am when the morning peak is on.
Useful links:
Outages table
http://nemlog.com.au/nlog/nem-coal-unit-outages-for-period/
Australia Institute’s Gas and Coal watch
https://australiainstitute.org.au/initiative/gas-coal-watch/#all-trips
Conclusion
The 16 coal plant units in Fig 2 have a total (theoretical) capacity of 9,740 MW. 13 units in full operation during the whole period under consideration with a total capacity of 7,700 MW were running at close to rated capacity during long peak hours. The only spare capacity would be the 3 remaining units BW01, BW02 and ER02 (together 2,040 MW) but it is unclear whether they were under regular maintenance or (emergency) repair and how reliable they would be in future.
It is an untested assumption to think that the aging coal fired power plants scheduled to close according to the AEMO generation information will actually run to their full capacity up to the very end. On top of these technical problems we have an increasing number of extreme weather events which will make the replacement of coal plants ever more urgent. Hopefully the above graphs give some appreciation about what kind of big job it will be to replace these coal plants. New energy hungry projects like skyscrapers, 100s of apartment towers and new airports will worsen the current tight power supply balance and make the transition job harder. Power demand needs to be limited.
Addendum (31/7/2021)
The above is of course a snapshot of the period under consideration.
1 day after posting, on 30/7/2021 in the evening, all 16 units were operating together with following max. outputs:
Bayswater (4×660 = 2,640 MW) generating at 2,291 MW (although BW02 only for a short time)
Eraring (4×720 = 2,880 MW) generating at 2,702 MW
Liddell (4×375 = 1,500 MW) generating 1,578 MW
Mt Piper (2×700 = 1,400 MW) generating 1,402 MW
Vales Pt (2×660 = 1,320 MW) generating 1,202 MW
All 16 units (9,740 MW) generating 9,175 MW (94%) for around 3 hrs
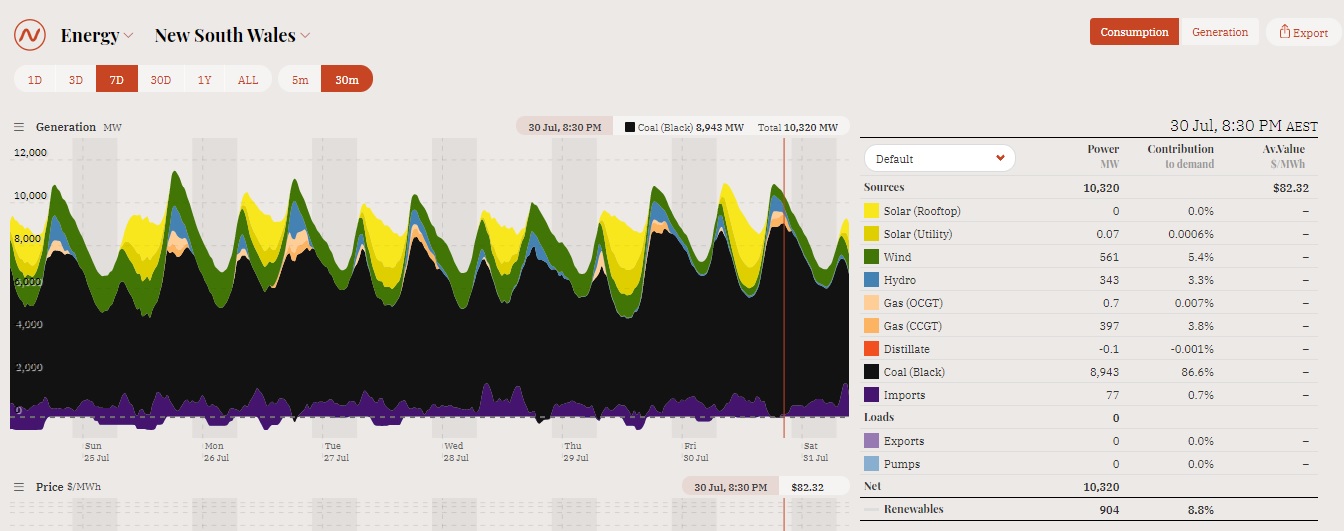 Note that in the period in question (left of the red line) net imports were almost zero and wind was only between 520 and 560 MW. Demand peaked with 10,860 MW at 18:35. Demand in summer can go up to 14,000 MW.
At 11:39 am this morning, AEMO reserve notice 89139 forecast a lack of reserve level 2 for the NSW region (requirement 383 MW, available 140 MW) during the evening of 1/8/21
While doing this update the total capacity in the conclusion para of the previous version was corrected