On 12/4/2018 a briefing session of the Greater Sydney Commission (GSC) on recently released planning documents
https://www.greater.sydney/greater-sydney-region-plan
took place in the Parramatta Novotel. According to the GSC establishment Act 2015 No 56 one of 9 principal objectives is:
(e) to encourage development that is resilient and takes into account natural hazards,
https://www.legislation.nsw.gov.au/acts/2015-57.pdf
The term “resilient” for the purpose of this legislation is not defined elsewhere in the act. According to the Oxford Dictionary resilient is being “able to withstand or recover quickly from difficult conditions” https://en.oxforddictionaries.com/definition/resilient
Note that CO2 emissions are not mentioned in this act.
Two of the most “difficult conditions” are oil supplies and climate change. So the question here is: has the Commission done any calculations to demonstrate Sydney’s resilience in this regard?
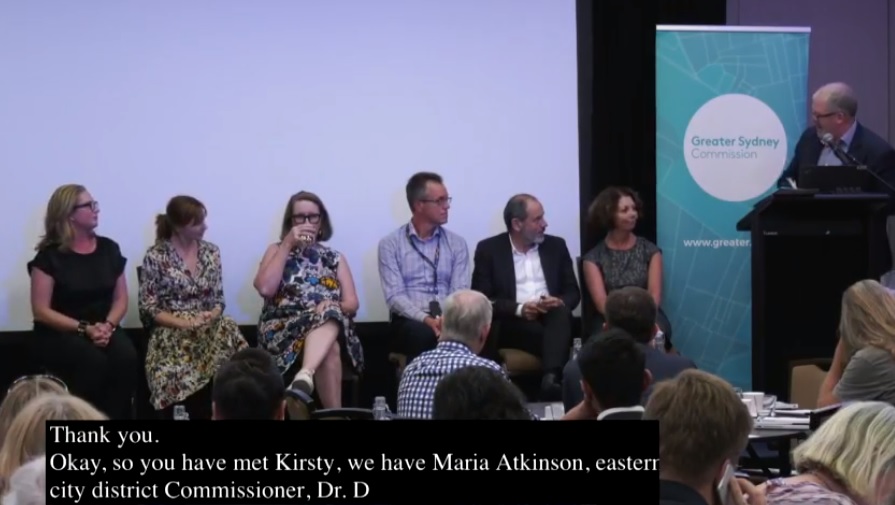
Fig 1 GSC Panelists
https://www.facebook.com/GreaterSydneyCommission/videos/2062526773961111/
From left to right: Kirstie Allen (Head of Strategy and Planning INSW), Maria Atkinson (District Commissioner Eastern City), Deb Dearing (District Commissioner North), Tim Raimond (Transport for NSW executive director for future transport), Rod Simpson (Environment Commissioner), Heather Nesbitt (Liveability Commissioner), Craig Middleton (Director Media and Communications)
Presentations:
(1) Overview 3 Sydney cities (Rod Simpson)
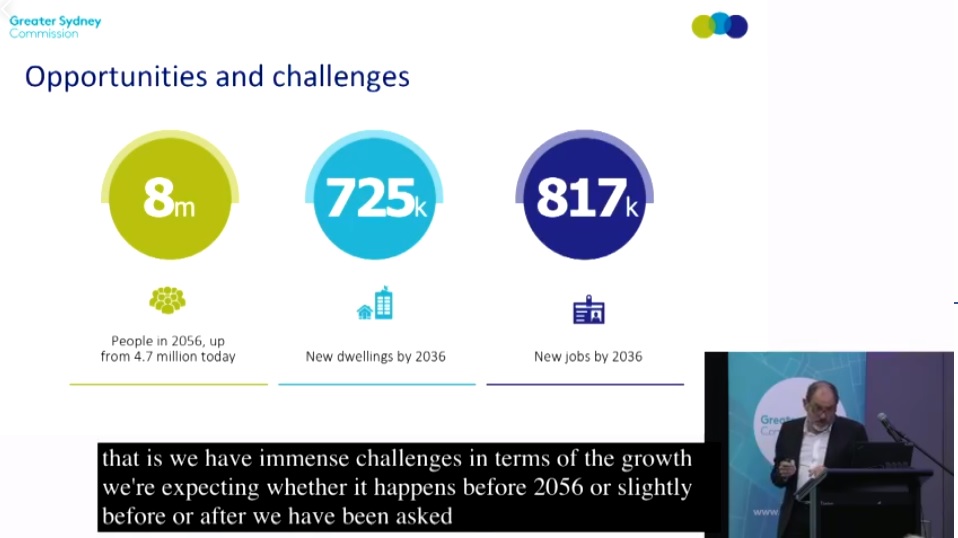
Fig 2: An 8 million Sydney from high immigration is assumed as a non-debatable given
https://www.greater.sydney/structure-plan-metropolis-three-cities
(2) Transport 2056 (Tim Raimond)
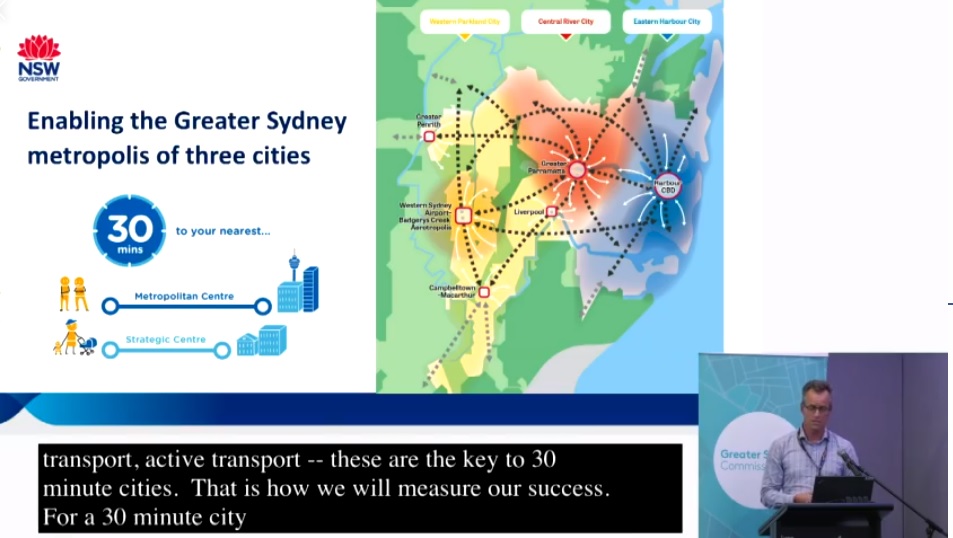
Fig 3: The much debated 3 x 30 min cities
https://future.transport.nsw.gov.au/wp-content/uploads/2018/plans/Future_Transport_2056_Strategy.pdf
(3) Building Momentum 2018 Infrastructure Strategy (Kirsty Allen )
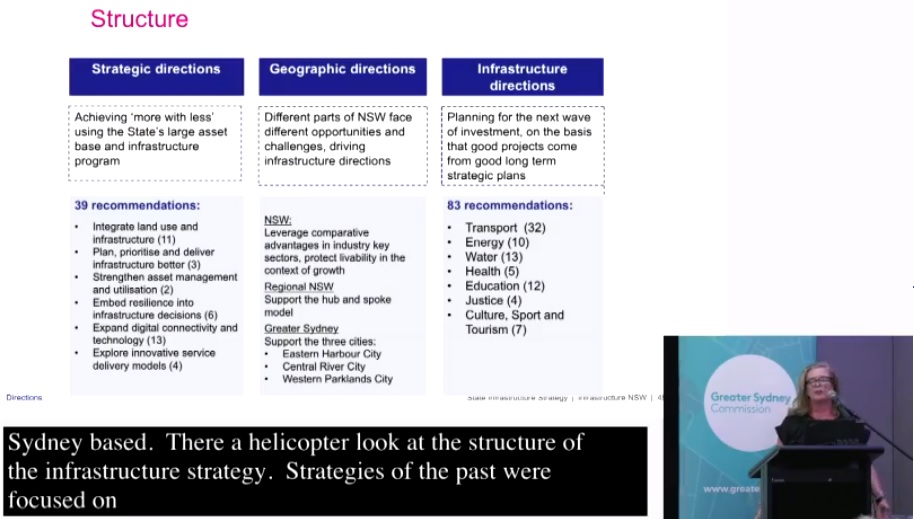
Fig 4: Recommendations on energy
https://insw-sis.visualise.today/documents/INSW_2018SIS_BuildingMomentum.pdf
In Q&A questions had to be submitted in writing:
My question was: “In which document can I find your energy calculations? How much oil, gas and coal will Sydney need in 10, 20 years? Have emission calculations been done? Has resource consumption as a function of alternative immigration scenarios been calculated?”
The host (Craig) sorted and selected the questions. He left out the immigration related part of my question and replaced it with: “And how about resource consumption?” This shows the GSC does not want an immigration debate because it would practically put in question their whole perpetual growth planning.
The Commissioner for Environment, Rod Simpson, answered:
“Good question. So we have actually got a publication where we are looking at the actual energy demand, the water demand across Sydney up on the web. So I encourage you to look at that.
And then there is also – it is also in the sustainability profile – which looks at current energy and water consumption in the city. It looks at canopy and so forth. We also have a document called towards zero emissions in 2050 which is the government’s commitment to achieving that. We looked at where it’s most effective to have either efficiencies within buildings but where it’s also possible to have renewables. What that showed was that, no surprises, it’s in the areas that will be undergoing the greatest changes where there is obviously the greatest opportunity to improve efficiency and reduce carbon emissions. There is detailed analysis in that.
It’s done looking at the future projection of housing and all other land uses and what the changes might be and where we think we can focus our attention. If you look at the detail, then in the greater Sydney Regional plan it talks about high performances pre-integrated sites in the precincts. In the District plans the plans that are engaging more directly with local government, it suggests and we encourage that any area around about 10 hectares, that’s about 300 m by 300 m with about 10,000 m2 of development around about 1,000 dwellings or about 4,000 jobs, should look at strategies for reducing energy and looking at water conservation and also looking at how waste services might be changed.
If you look at that there is quite strong directions about how we improve our efficiency and just what is possible in meeting the long-term, what the city can do in meeting the overall target of zero emissions by 2050. I would encourage you to look at that document. It’s an interesting read. It’s called Towards Zero Emissions 2050 and it’s on our website. It should be in the background papers. There is a section information and background. There is a lot of material up on the web.”
From that long answer let’s pick that zero emissions report (prepared by Kinesis)
Exploring Net Zero Emissions for Greater Sydney
October 2017
https://gsc-public-1.s3.amazonaws.com/s3fs-public/exploring_net_zero_emissions_for_greater_sydney_-_kinesis_-_october_2017.pdf
In chapter 2.1 of this report we find this interesting graph on Sydney’s GHG emissions profile:
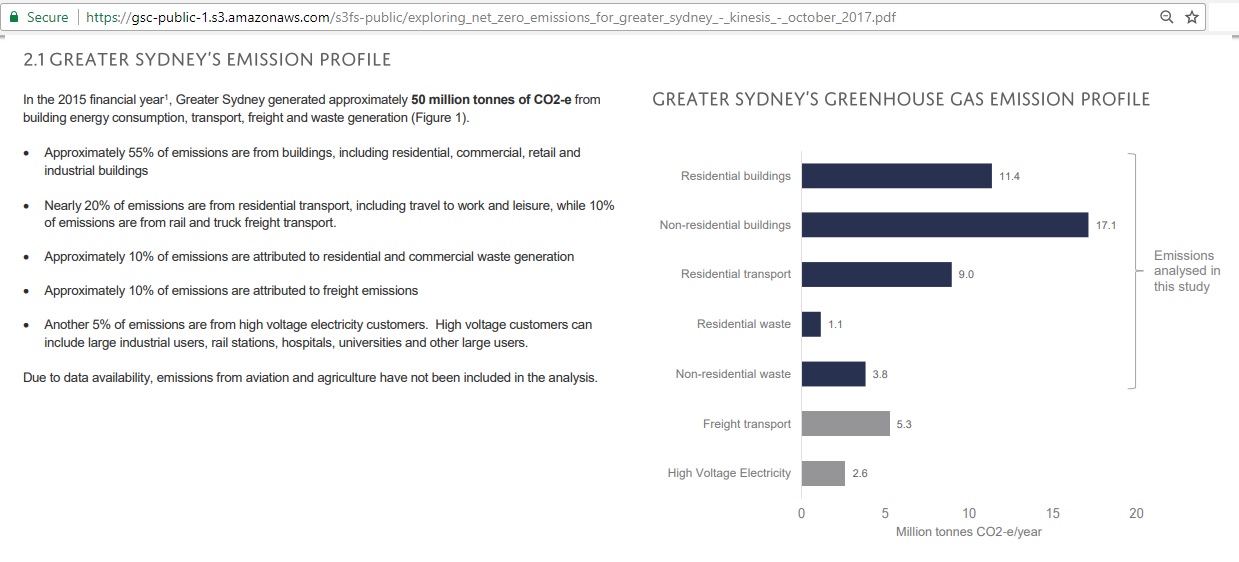
Fig 5: Sydney’s 2015 emissions by sector
Note that freight transport (diesel consumption!) has not been analyzed. One can assume that this is because the NSW Freight and Ports Plan 2017 estimates (i.e. wants) that freight volumes will double over 40 years to 2056, including a 20% increase in coal freight, mainly in the Hunter valley.
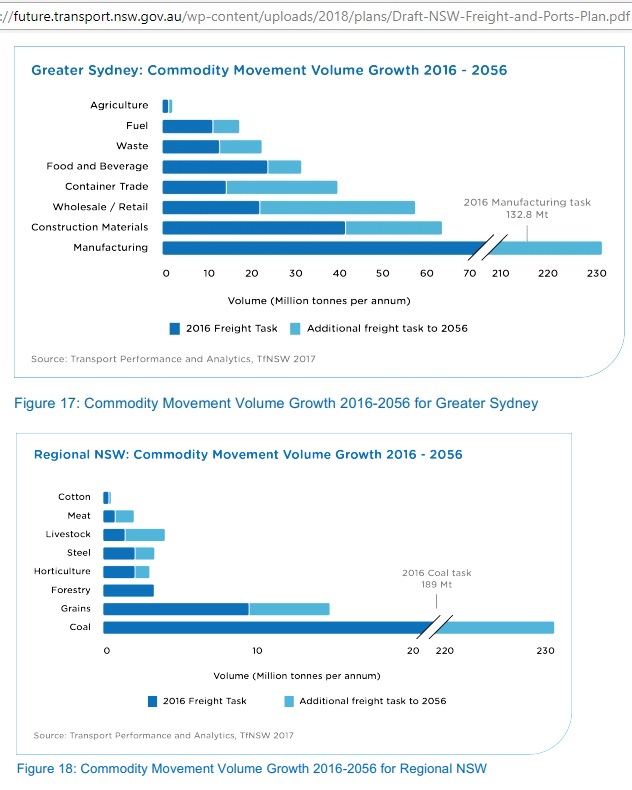 Fig 6: Freight growth in Sydney and regional NSW
https://future.transport.nsw.gov.au/wp-content/uploads/2018/plans/Draft-NSW-Freight-and-Ports-Plan.pdf
The fact that the NSW government expects record volumes of coal freight to continue for another 40 years shows that it doesn’t understand climate change tipping points which will force us to stop coal, long before 2056. Nor does this suggest any willingness to reduce emissions. In an earlier freight plan of 2013, Centennial Coal was praised for its sustainability objectives by introducing new, state of the art diesel electric locomotives – to pull more coal trains.
After this short excursion into freight planning let’s have a look at future emission pathways, in chapter 2.2 of the Kinesis report:
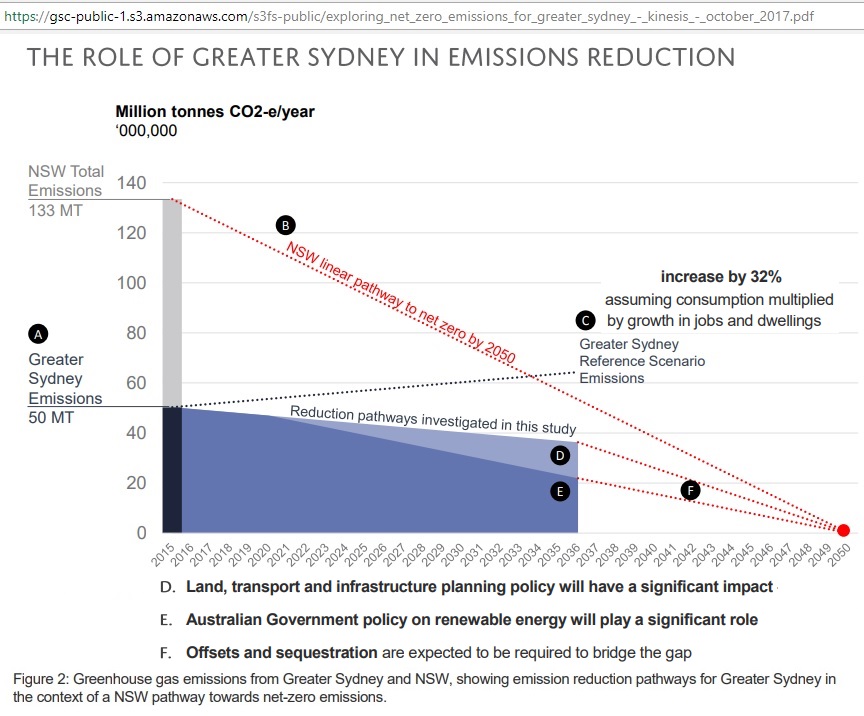 Fig 7: Emission pathways for NSW and Sydney
Note the 32% emissions increase of the reference scenario (business as usual) comes from a growth in jobs and dwellings.
How does this compare with Australia’s commitment to reduce emissions according to the Paris Agreement?
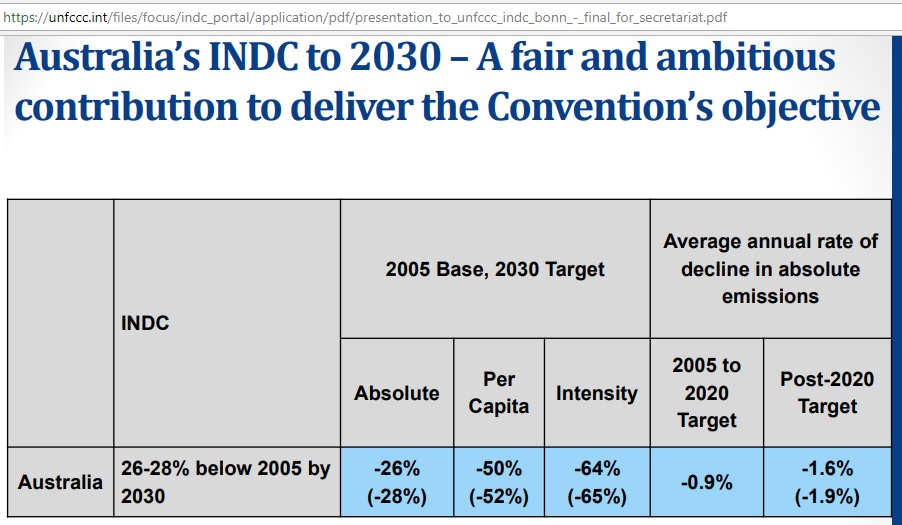
Fig 8: Australia’s Intended Nationally Determined Contribution
https://unfccc.int/files/focus/indc_portal/application/pdf/presentation_to_unfccc_indc_bonn_-_final_for_secretariat.pdf
NSW emissions were 158.4 mt in 2005 (see Fig 11), higher than in 2015 (133 mt). Therefore, the target is also higher (very convenient for governments). Assuming for Sydney a ratio of 50/133= 38% of NSW emissions that would be 158.4 mt * 38% = 60 mt in 2005. 72% of these emissions would be 43 mt in 2030. That would be slightly above the light blue trend (marked D).
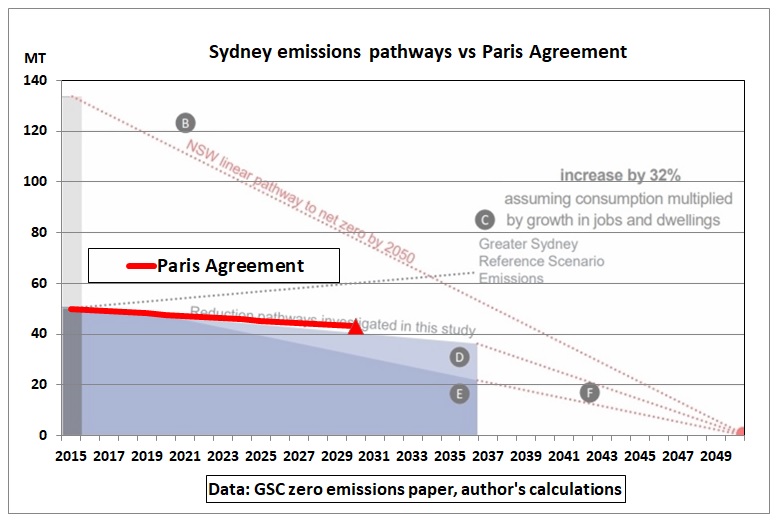
Fig 9: Comparison emission pathways and Paris Agreement
Note that the gap between the reference scenario and the Paris Agreement is widening over time (because of the assumed linear trends). The reference scenario includes high immigration (see 8 million population target by 2056 in Fig 2).
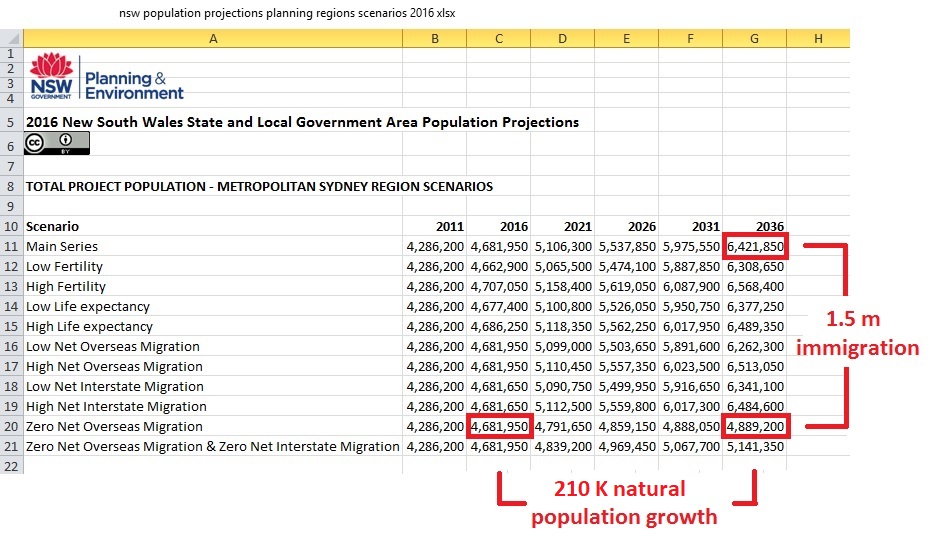 Fig 10: Sydney population projections +33% over 20 years
The above table is from an XLS file of the NSW Planning Department (2016)
http://www.planning.nsw.gov.au/Research-and-Demography/Demography/Population-Projection-Scenarios
Latest statistics published in April 2018 show Sydney had already a population of 5.1 m in June 2017 so the numbers in Fig 10 are on the low side.
http://www.abs.gov.au/ausstats/abs@.nsf/0/797F86DBD192B8F8CA2568A9001393CD?Opendocument
But the ratio between natural population growth and immigration will not change much with a higher base population. From Fig 10 we get a growth of 4.4% (0.210/4.682) from natural population growth (of the existing population) and 32.7% from immigration (1.53/4.682). Incidentally, immigration growth and emissions growth are practically the same. So when it will come to reducing emissions, the resident population will have to save on behalf of the newcomers. Therefore, all those who want the current immigration program in place should be prepared to reduce emissions more than they would otherwise have to. Zero emission immigrants would be subsistence farmers (from Africa?), not urban dwellers living in energy hungry apartment towers.
Fig 2 in the Kinesis zero emissions paper is not very detailed. An earlier fact sheet on NSW emissions up to 2014 shows emission trends by sector:
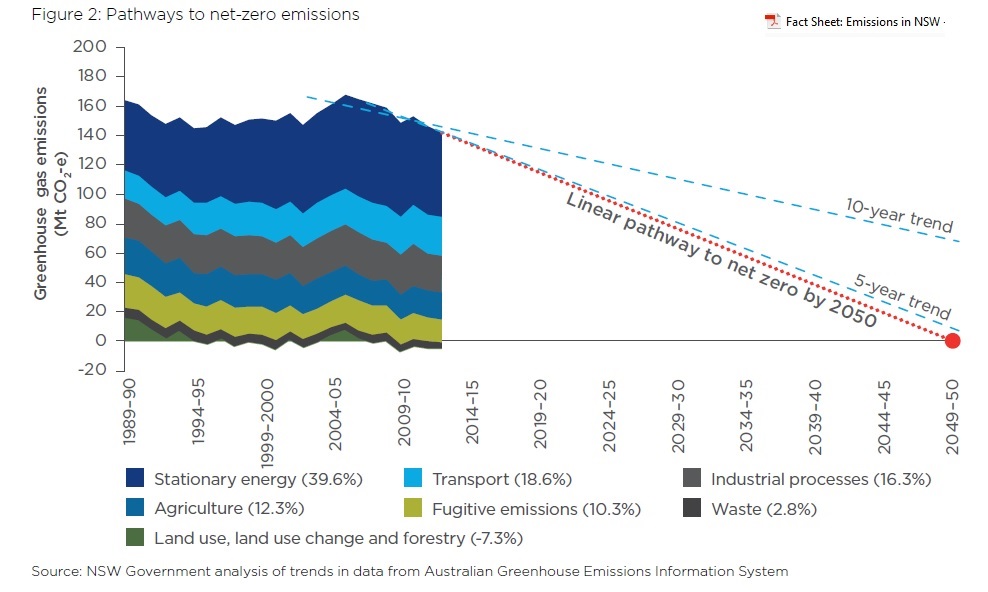
Fig 11: Pathways to zero emissions in NSW (released Nov 2016)
http://www.environment.nsw.gov.au/research-and-publications/publications-search/climate-change-fact-sheet-emissions-in-nsw
Let’s see how trend lines look like for each of the sectors in Fig 11:
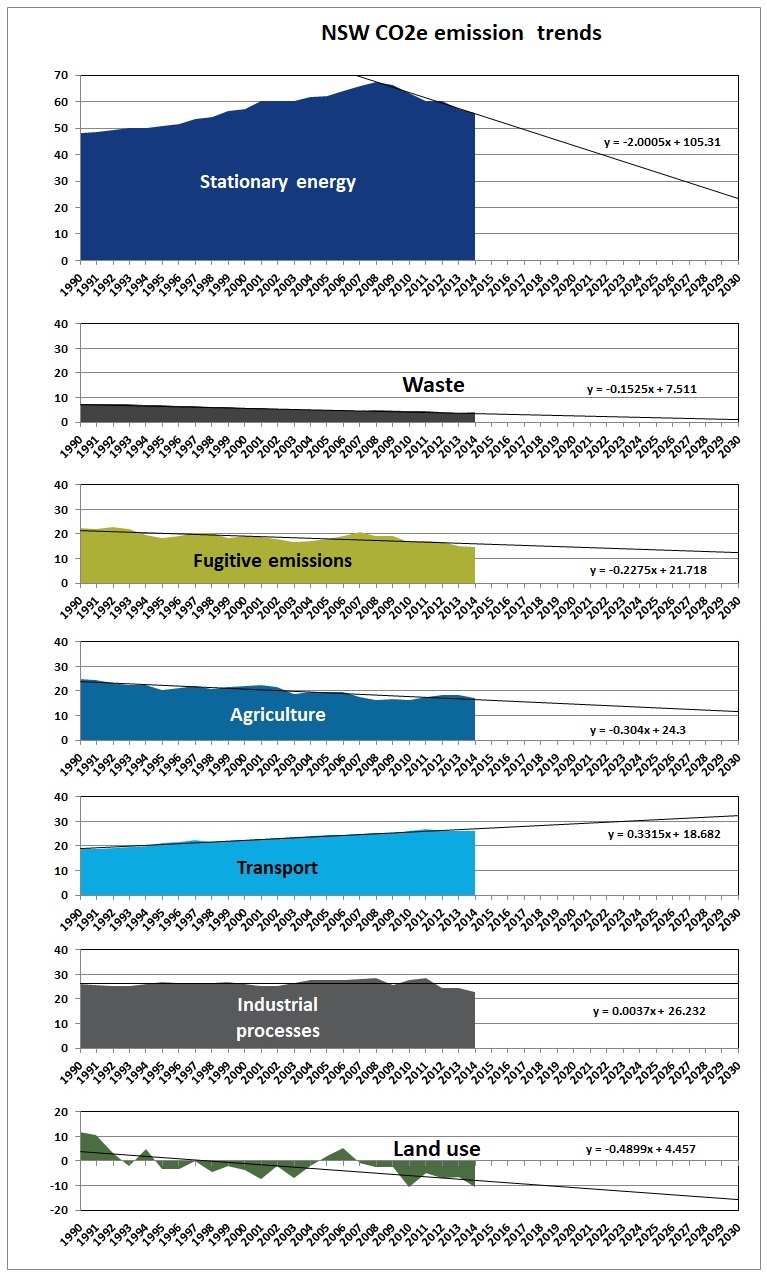
Fig 12: NSW emission trend lines
Whether any of the trend lines can be implemented would require a detailed analysis and forecast – plus a strong political commitment. The most important and challenging component comes from fossil fuel plants for power generation (46% reduction on 2014 levels). Several coal plants have closed and renewables and gas are being used. The next closure is Liddell but the government wants it to continue for another 5 years. An endless debating club competition about climate change and energy policy has created an environment of uncertainty for investors. Thus, the downward trend line for stationary energy is by no means a given.
Waste has become a new problem as China has banned waste imports. The government wants to build waste incinerators, claimed by the Energy Minister to supply 2 % of Australian energy. That will not be very clean but may reduce emissions from landfills without biogas capture.
Declining trends in fugitive emissions and agriculture seem well established, but all improvements have their limits. Transport emissions are also a big problem:
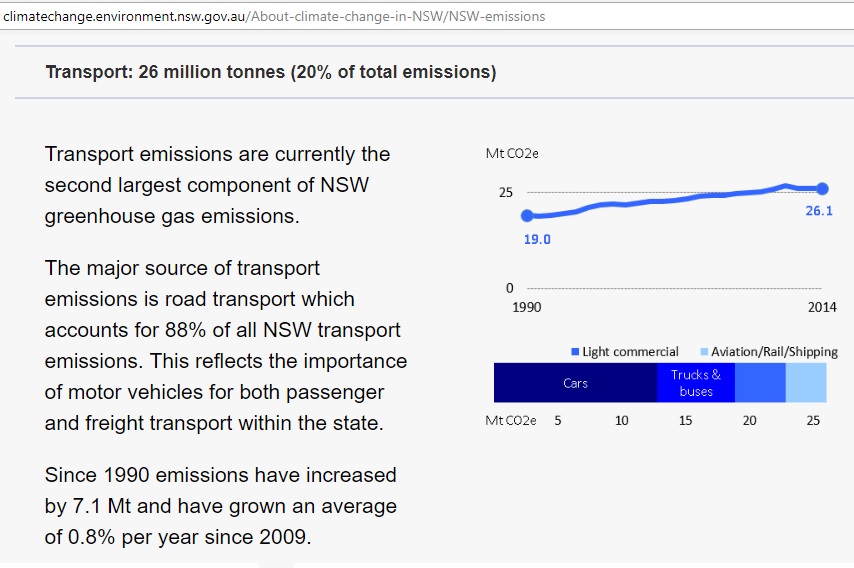
Fig 13: transport emissions
http://climatechange.environment.nsw.gov.au/About-climate-change-in-NSW/NSW-emissions
The upward trend can only be broken by an enduring oil crisis, whether caused by a war in the Middle East or other geopolitical events. The peaking of US shale oil production and the impact of reduced CAPEX since 2014 on decline rates in existing fields is another scenario. OPEC’s paper barrels are another problem. For example, no one knows how much oil remains in the giant oil field Ghawar, where decline rates could be steep once horizontal wells have reached the top layers.
Emissions from industrial processes e could go down (instead of stagnating) as governments are not much interested in supporting a local industry. As an example, the NSW government has ordered metro trains from India, intercity trains from South Korea and trams from France.
Emissions from land use are quite volatile, bringing uncertainty to the declining trend line. Land clearing policies can be changed quickly, to please backbenchers when necessary ahead of elections.
Adding up all the above trend lines gives following graph:
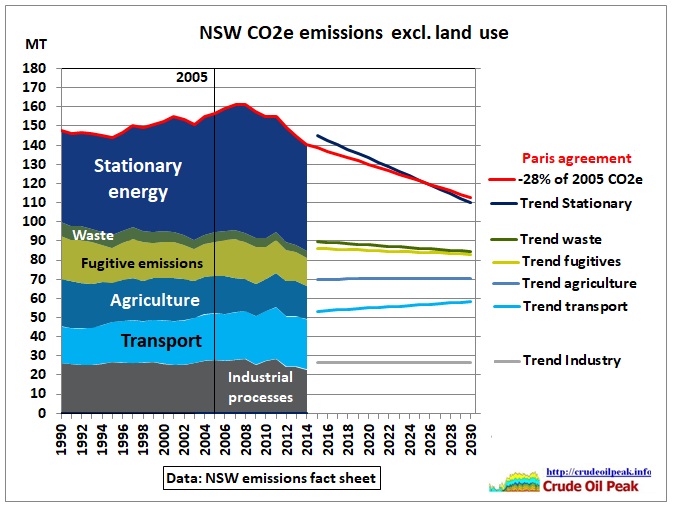 Fig 14: Stacked trend lines vs Paris Agreement
Incidentally, the dark blue line and the red Paris Agreement line (-28% of 2005 emissions by 2030) come together at around 110 MT. This means that emissions from stationary energy will really have to be reduced from 55 MT in 2014 to 25 MT, given that the sum of the other emission trends may not decline much.
On resilience GSC should fill in the next graphs for the period until 2030.
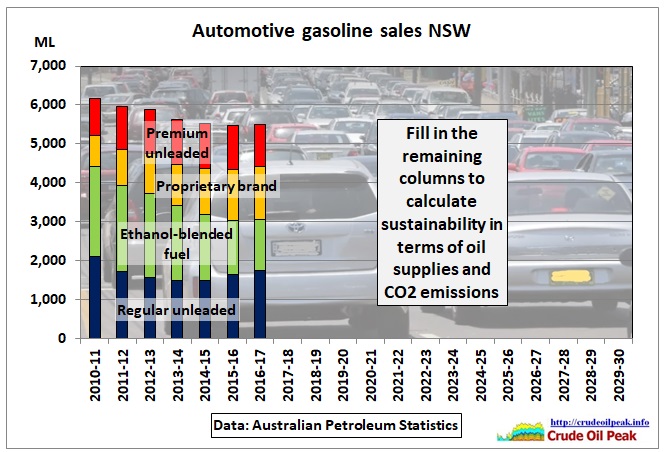 Fig 15: NSW automotive gasoline sales
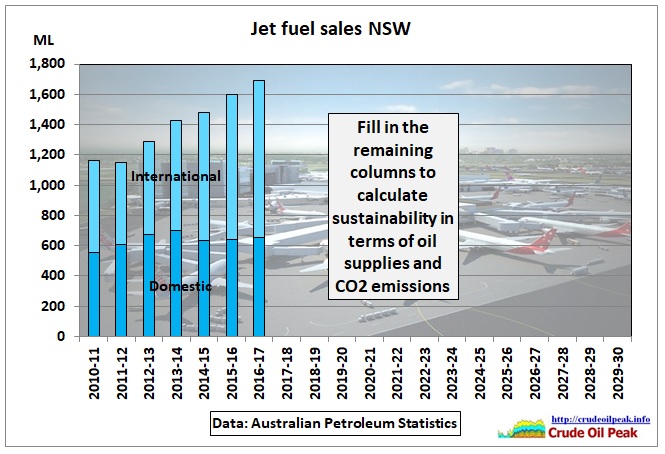
Fig 16: NSW Jet fuel sales
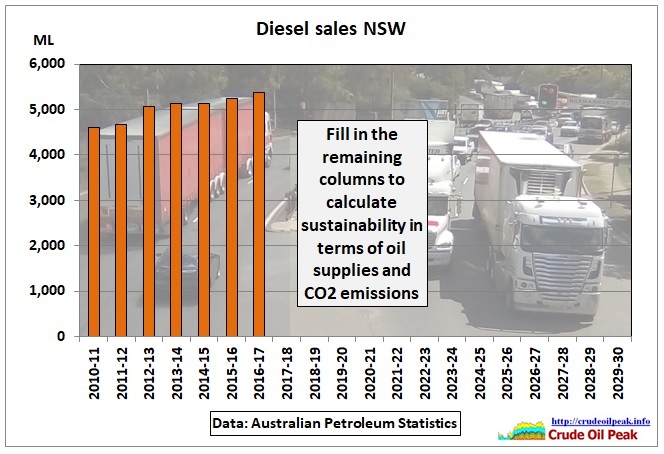 Fig 17: NSW Diesel sales
And how about fuel sales in all of Australia?
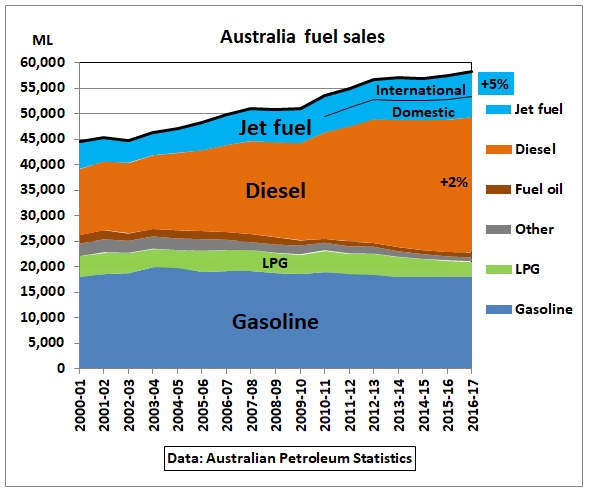
Fig 18: Australia fuel sales
There is no zero emissions revolution to be seen here, just business as usual. The latest example: the NSW government self-approves its own pet project WestConnex, a gigantic road tunnel project in Sydney. This is just one of the interchanges:
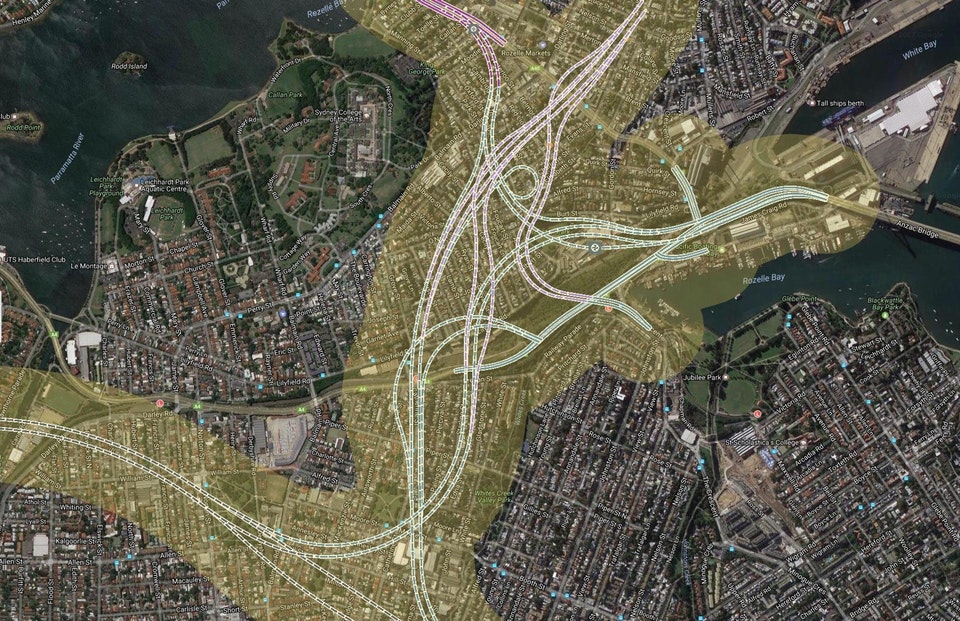
Fig 19: WestConnex Rozelle interchange
https://www.reddit.com/r/sydney/comments/6lentj/westconnex_rozelle_interchange_overlaid_onto/
The following table in the Environment Impact Study shows Sydney’s road traffic measured in vehicle kms traveled (VKT) and in vehicle hrs traveled (VHT):
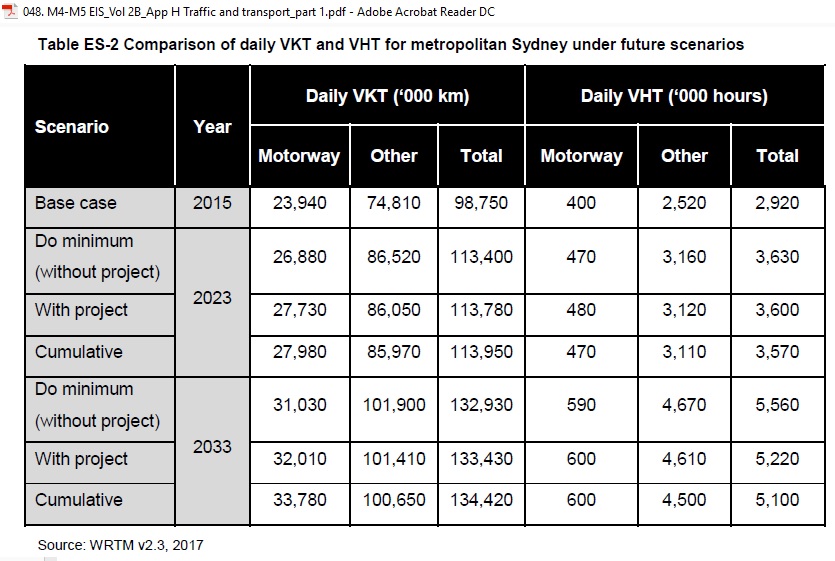 Fig 20: Table showing vehicle kms vs vehicle hrs travelled
http://www.majorprojects.planning.nsw.gov.au/index.pl?action=view_job&job_id=7485
Let’s put the table into graphs:
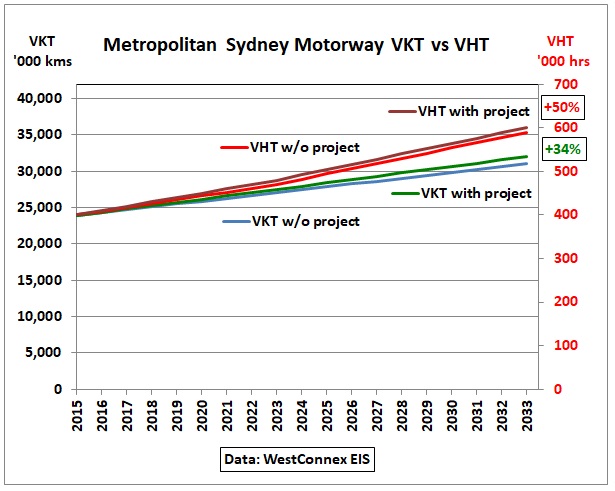 Fig 21: Vehicle kms (LHS) and hrs (RHS) on Sydney Motorways
We see the time spent on motorways increases (+50%) more than traffic (+34%) by 2033.
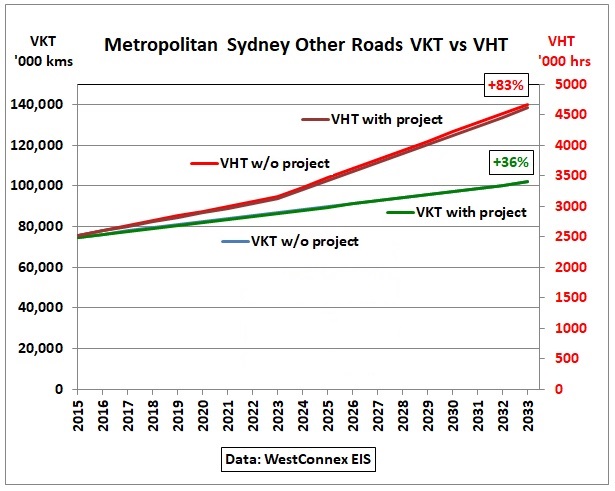 Fig 22: Vehicle kms (LHS) and hrs (RHS) on other Sydney roads
Time spent on roads outside the motorway system increases (+83%) even more than on motorways (50%) and more than double the increase in traffic (+36%). Therefore, road transport will become less efficient. The proximity of the curves (with and without project) shows there is practically no difference whether WestConnex is built or not. This means there is a structural problem in Sydney. This city has reached its limits to growth and additional infrastructure alone cannot fix this problem.
Now let’s look at the CO2 emissions:
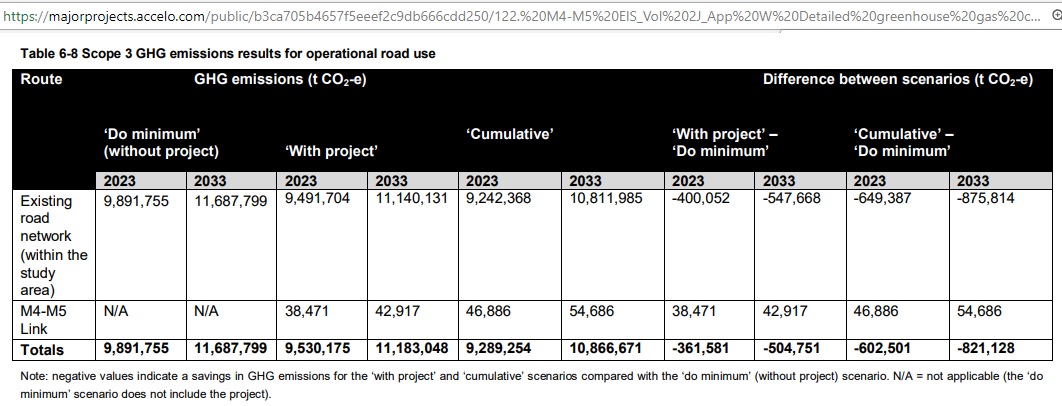 Fig 23: GHG emissions on Sydney’s roads from Appendix W
https://majorprojects.accelo.com/public/b3ca705b4657f5eeef2c9db666cdd250/122.%20M4-M5%20EIS_Vol%202J_App%20W%20Detailed%20greenhouse%20gas%20calculations.pdf
Emissions for the base year 2015 were not calculated but compare 9.9 Mt in 2023 with 9 Mt in 2015 of Fig 5. Over the 10 year period 2023-2033 emissions for the case “with project” increase from 9.5 Mt to 11.2 Mt (18%). That goes in the wrong direction.
All the while the Paris Agreement is actually not sufficient to hold temperature increases to well below 2 degrees.
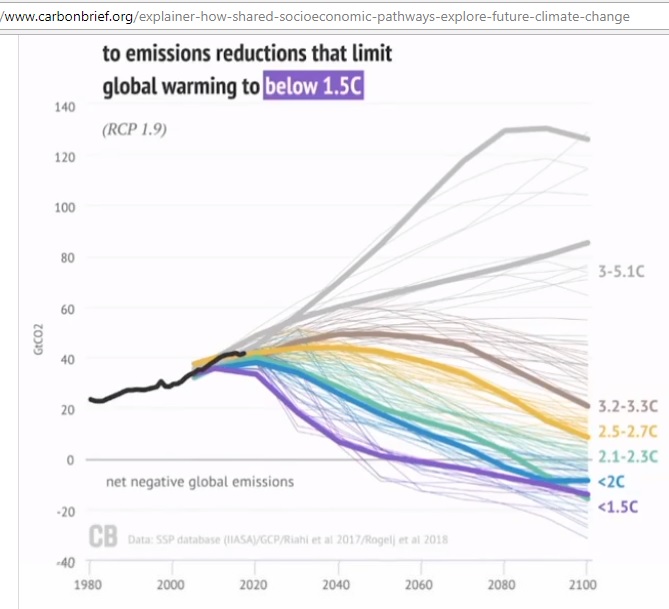
Fig 24: The world is already above the 1.5 degrees trajectory
https://www.carbonbrief.org/explainer-how-shared-socioeconomic-pathways-explore-future-climate-change
Conclusion:
The Greater Sydney Commission must go back to the drawing board as the current set of planning documents is inconsistent. It should calculate a sustainable rate of immigration as a function of available future energy supplies. It cannot be Sydney’s task to offset additional carbon emissions from another 3 million immigrants (adopting wasteful Australian lifestyles) while the current population can hardly manage to reduce its own emissions.
Further reading
Getting off the greenhouse gas:
Public transport’s potential contribution in Australian cities
http://sydney.edu.au/business/__data/assets/pdf_file/0009/326961/ITLS-WP-17-13.pdf