This post describes a series of price spikes in NSW which happened between Tuesday the 7th and Wednesday the 8th of May 2024. The following Fig 1 and Fig 2 are screen shots of AEMO’s dashboard (Australian Energy Market Operator)
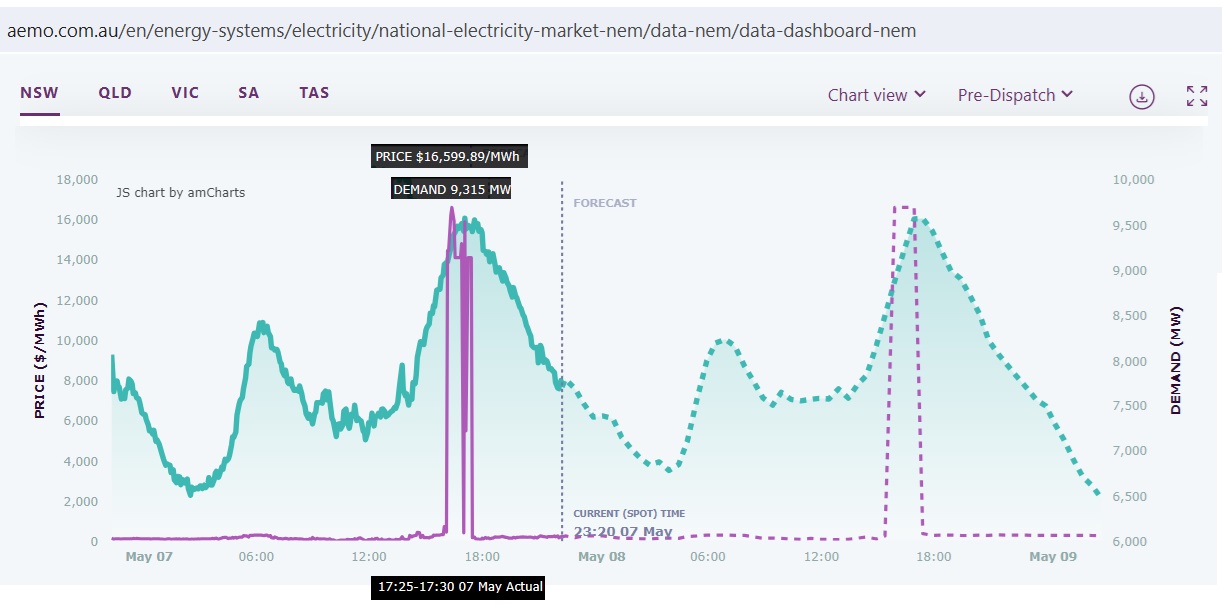 Fig 1: May 7th price spikes up to 16,600 $/MWh at peak hour. Demand 9,300 MW
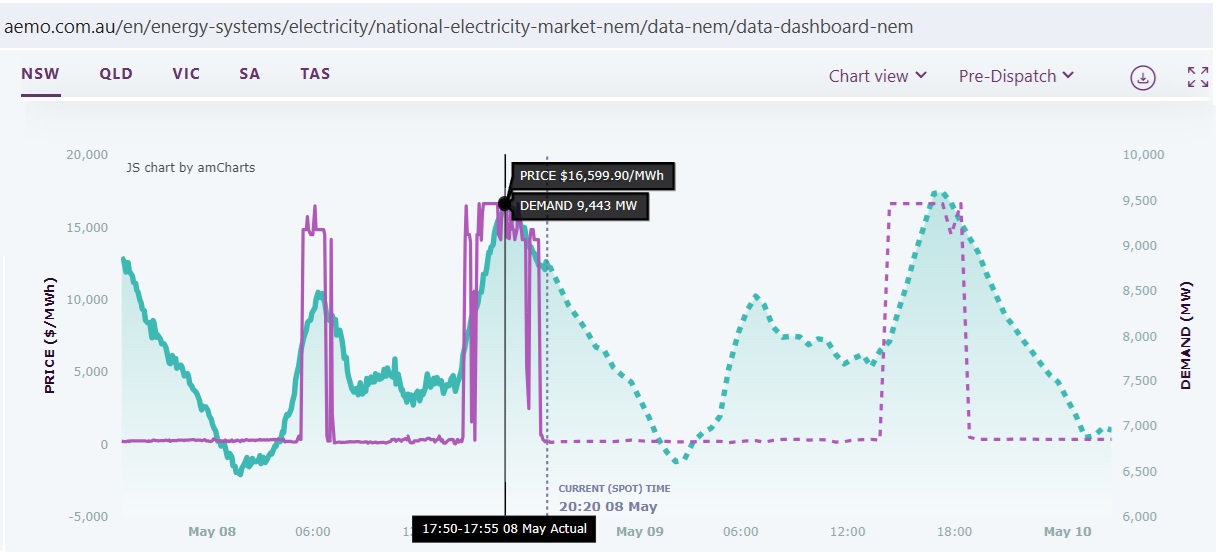 Fig 2: May 8th price spikes both in the morning (!) and afternoon
These 2 price spikes were not short lived but lasted for 1 hr 15 min in the morning (14,900 $/MWh) and 4 hrs 10 min (14,200 $/MWh), unprecedented.
AEMO had to impose administered price caps according to its NEM rules:
116554 ADMINISTERED PRICE CAP 09/05/2024 03:55:11 AM
AEMO has determined that the rolling sum of the uncapped spot prices for
the NSW1 region over the previous 2016 trading intervals has exceeded
the cumulative price threshold (CPT) of $1,490,200.00.
In accordance with Clause 3.14.2(b) of the National Electricity Rules,
AEMO has determined that an administered price period will commence at
the trading interval starting 0405 hrs on 09 May 2024 and will continue
through to the end of that trading day
https://aemo.com.au/market-notices
The CPT is calculated over 7 days
• the sum of the regional reference prices (spot prices) in the energy market for the previous 2,016 trading intervals (equivalent to seven days) exceeds the cumulative price threshold (CPT); or
• the sum of the ancillary service prices for a market ancillary service for the previous 2,016 trading intervals (equivalent to seven days) exceeds the CPT.
https://aemo.com.au/-/media/files/electricity/nem/security_and_reliability/dispatch/policy_and_process/guide-to-administered-pricing.pdf
Let’s have a look at how this developed over time:
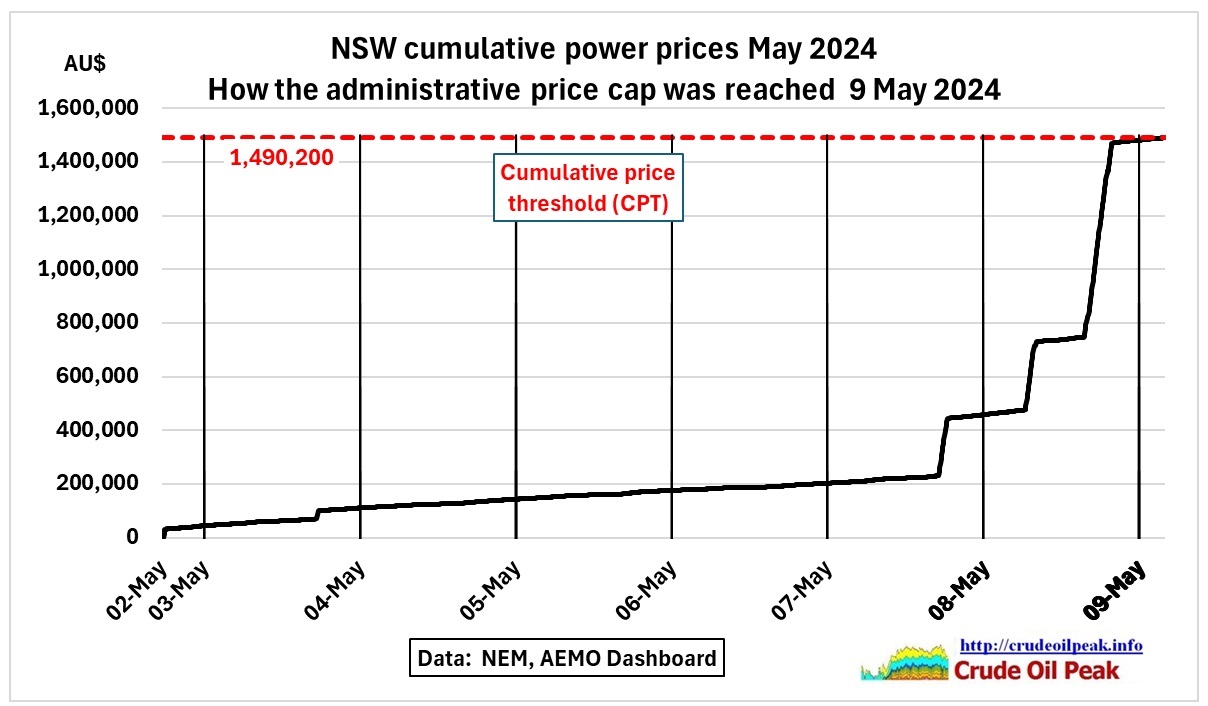 Fig 3: Consecutive price spikes add up and hit the threshold on May 9th
How did that happen? In the following Fig 4 the price spikes have been drawn in a generation-by-fuel graph.
 Fig 4: NSW power generation by fuel and periods of price spikes between vertical lines
We see 3 price spikes coincide with demand peaks and limited generation from coal. At the time of the peaks the combined capacity factor of all coal plants was 62%-64%, 51%-53% and 48%-57% respectively.
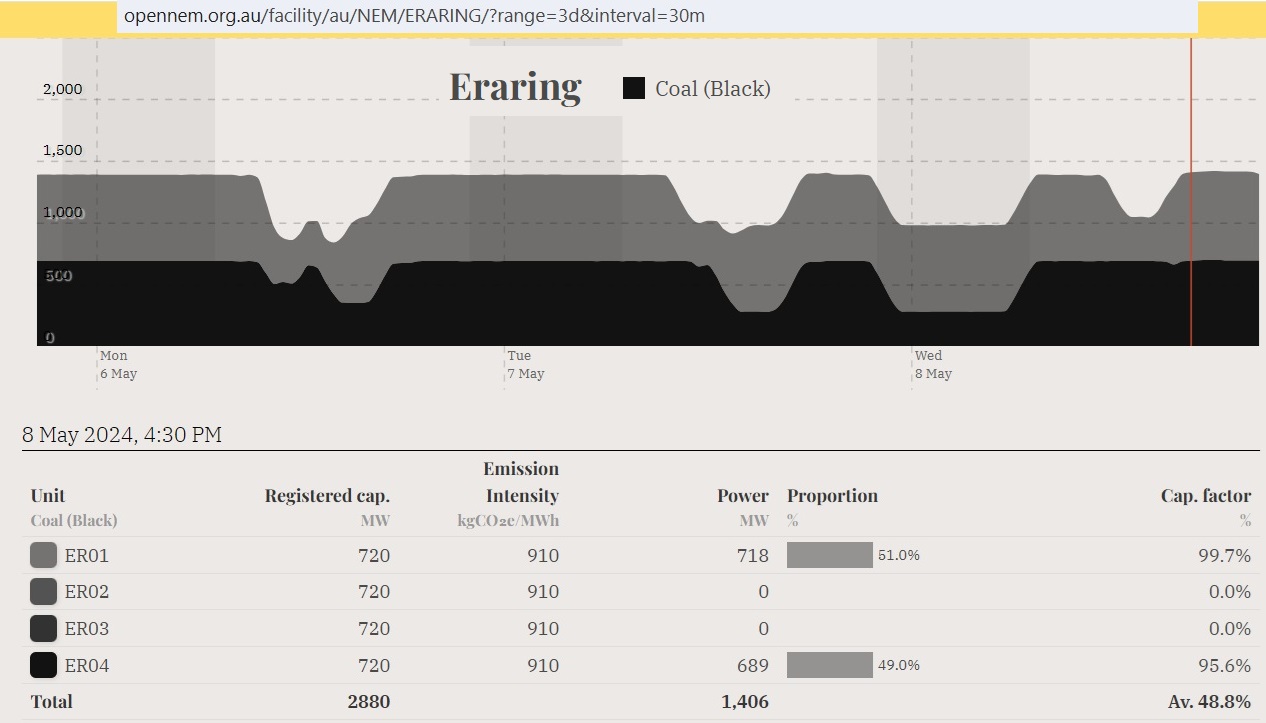 Fig 5: Only two of Eraring’s four units were in operation
Unit ER02 was on an unplanned maintenance since May 2nd and ER03 had experienced an unplanned forced outage on May 3rd. Unit ER04 did not reach its rated capacity.
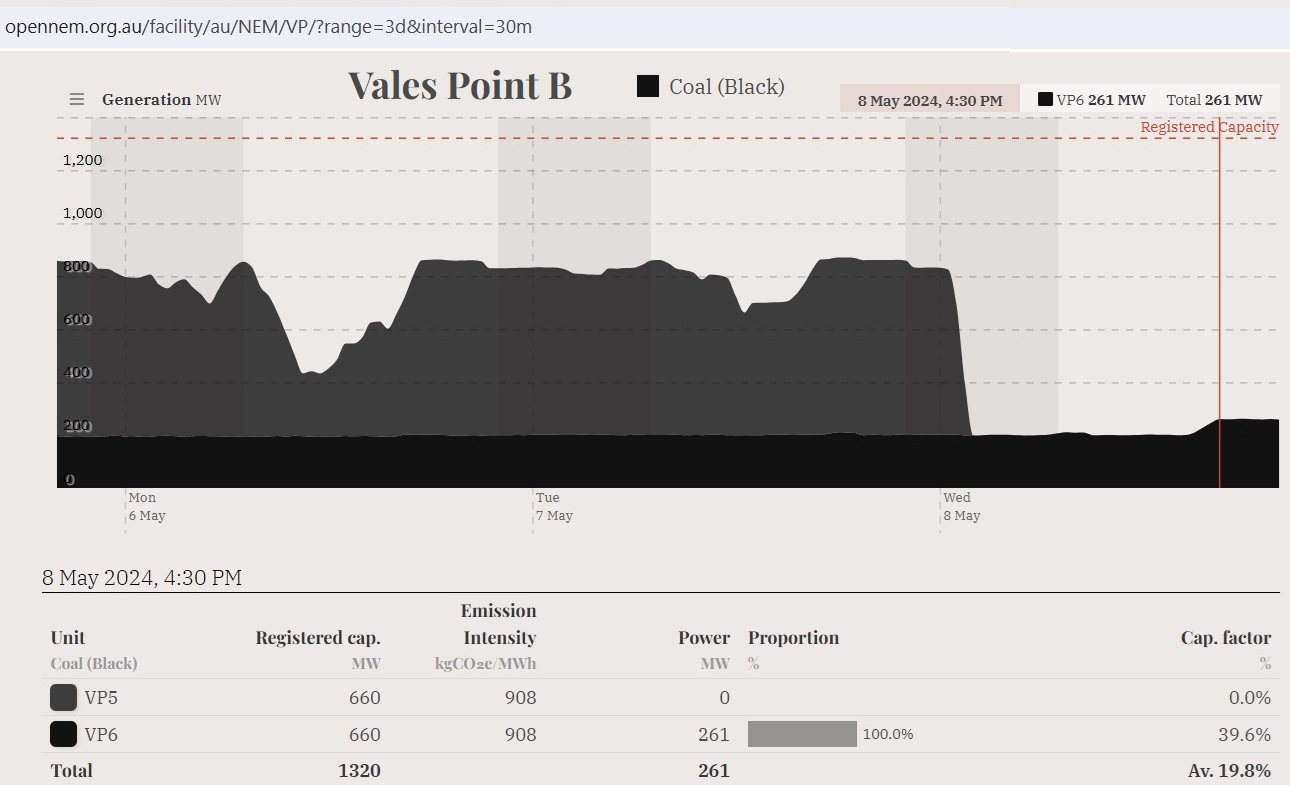 Fig 6: Vales Point VP5 tripped on 8 May 1:30 am
7/10/2022
Sale of Vales Point: How will Czech brown coal baron Pavel Tykac with
business registered in Liechtenstein impact on NSW coal and energy markets?
http://crudeoilpeak.info/sale-of-vales-point-how-will-czech-brown-coal-baron-pavel-tykac-with-business-registered-in-liechtenstein-impact-on-nsw-coal-and-energy-markets
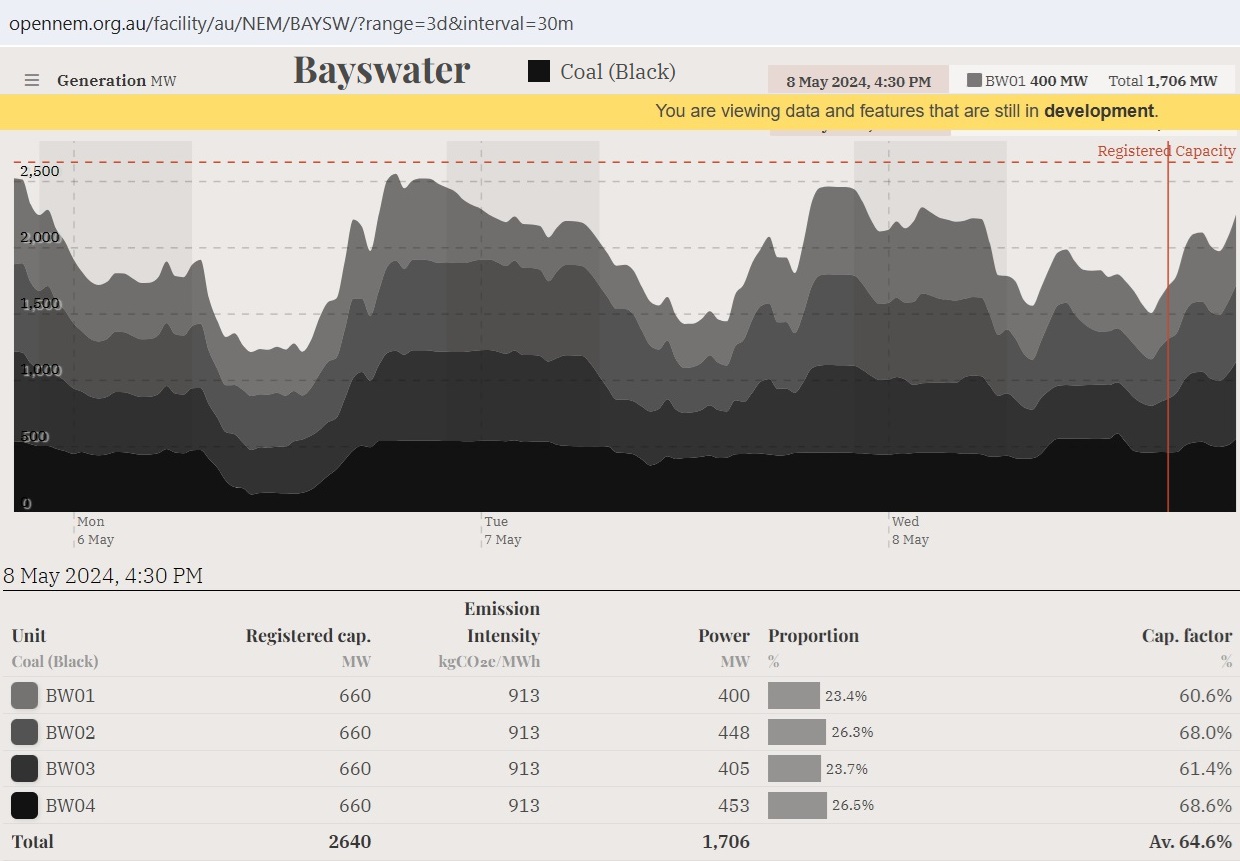 Fig 7: Bayswater was running at 65% of its capacity at the critical time of 4:30 pm on May 8th
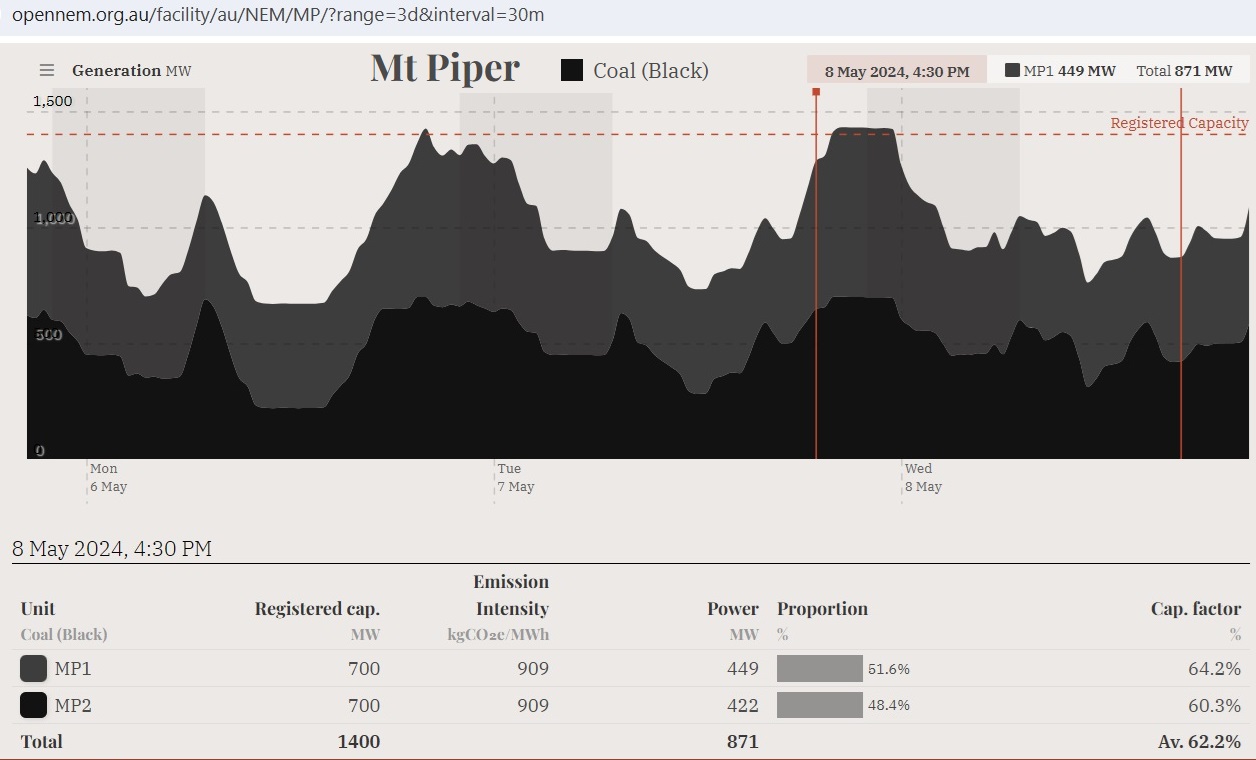 Fig 8: Mt Piper was generating on a bumpy plateau on May 8th, not exceeding 70%
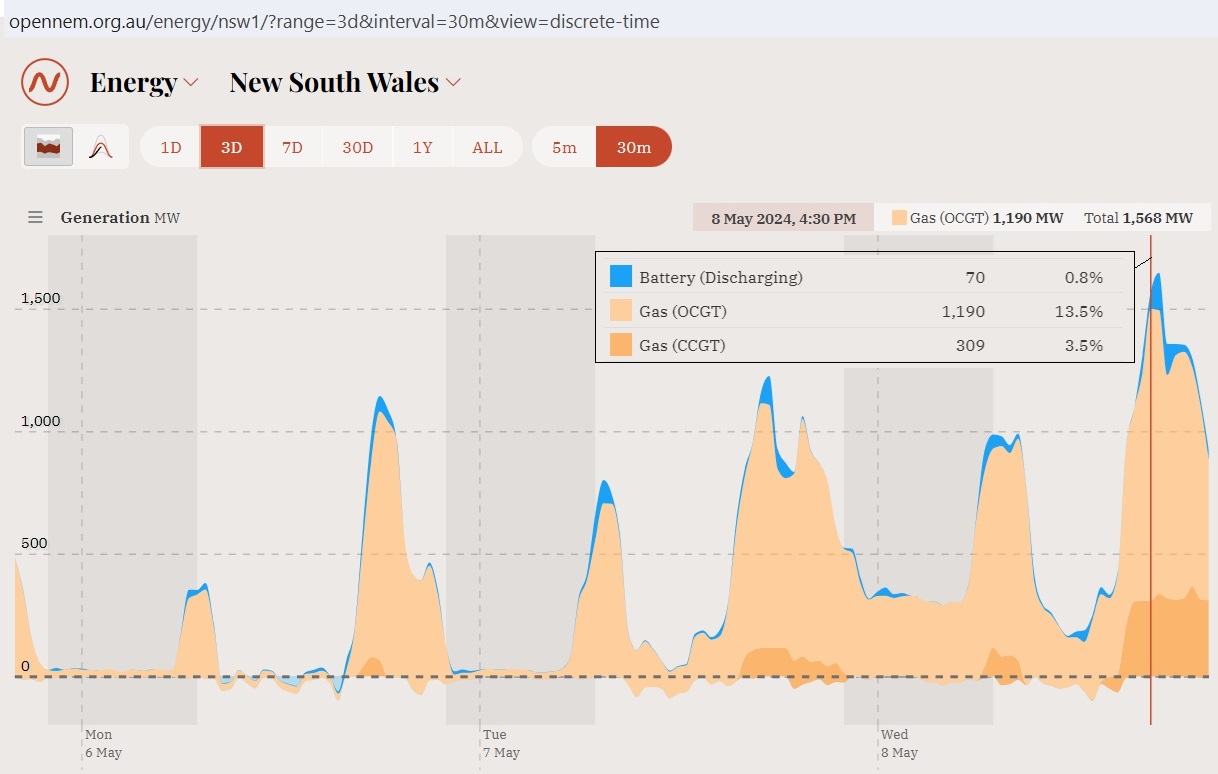 Fig 9: NSW depends heavily on gas peaking plants
https://wattclarity.com.au/articles/2024/05/08may-review-nsw-gas-gen-bidding/
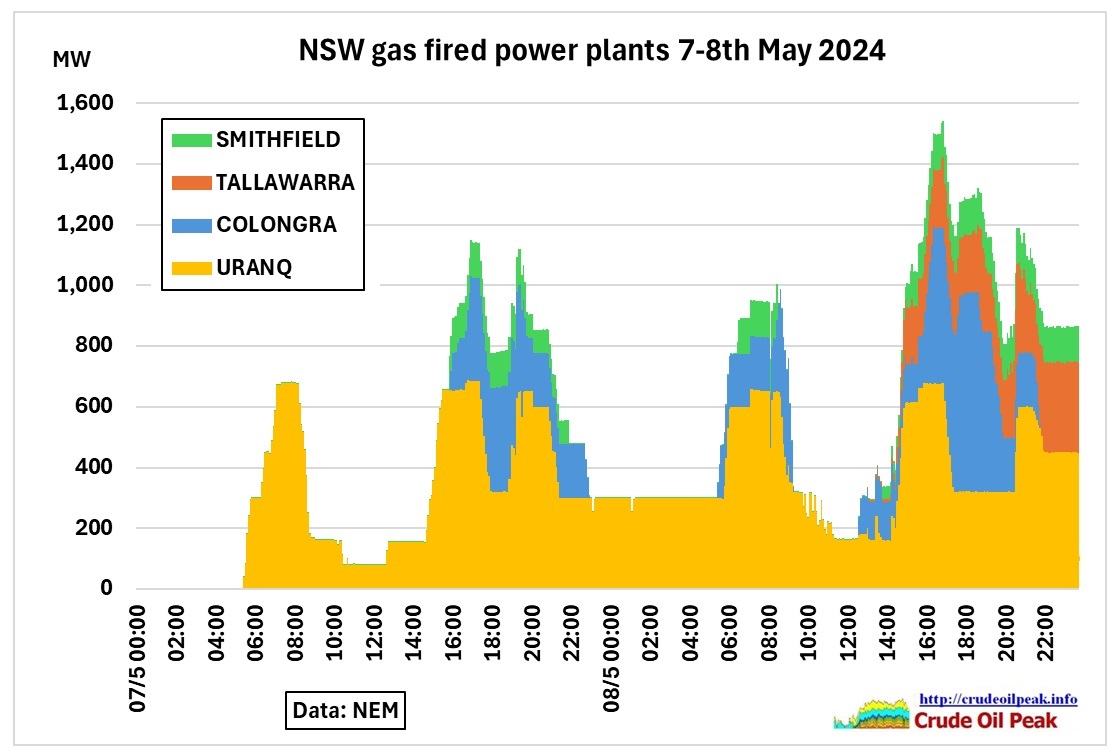 Fig 10: Gas fired peakers. Tallawarra B was not in operation since Apr 9th
Delving deeper, into gas-fired peaker performance in NSW on Tue 7th May and Wed 8th May
10 May 2024
https://wattclarity.com.au/articles/2024/05/08may-review-nsw-gas-gen-bidding/
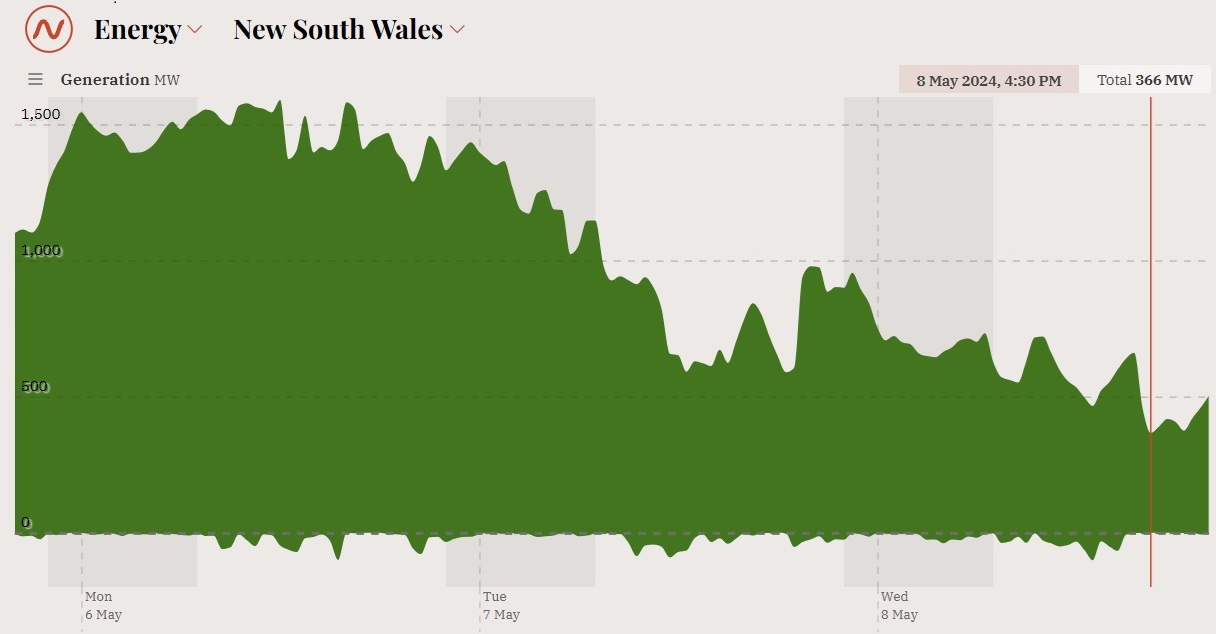 Fig 11: Generation from wind declined over 3 days
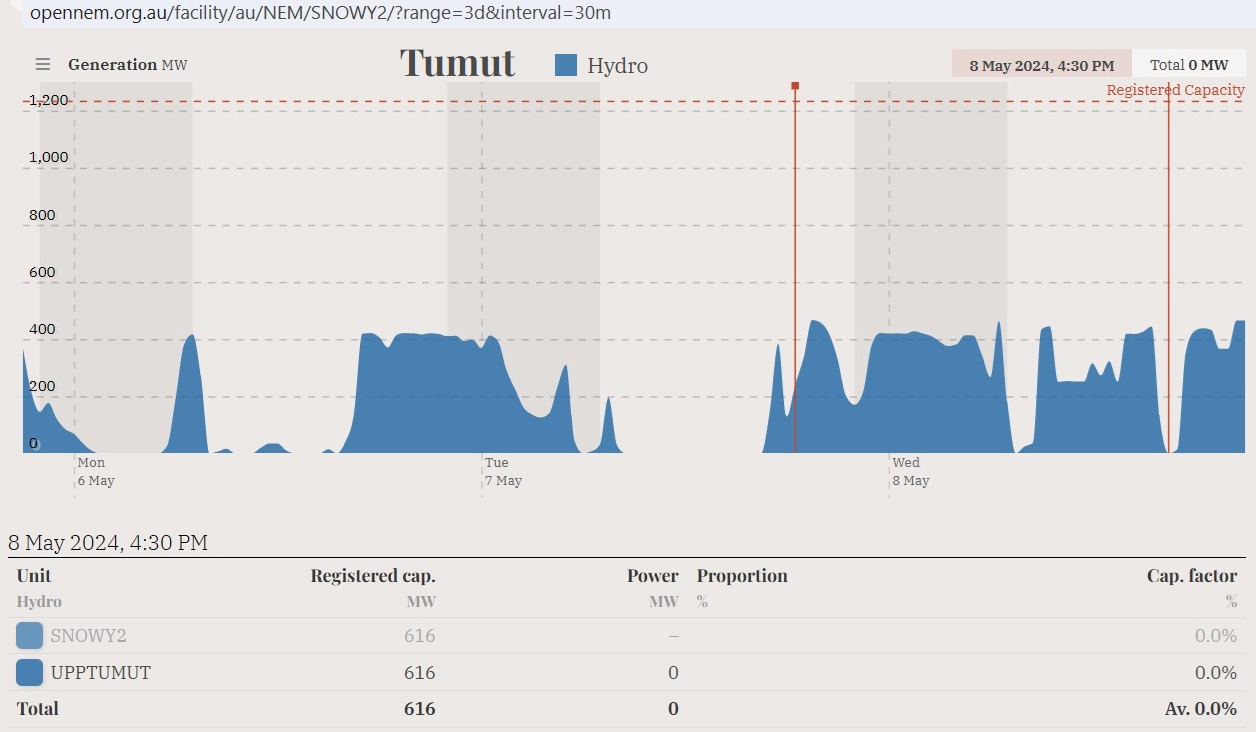 Fig 12: Upper Tumut had a drop in generation of 400 MW at the beginning of the afternoon peak May 8th
There were 3 Lack of Reserve warnings
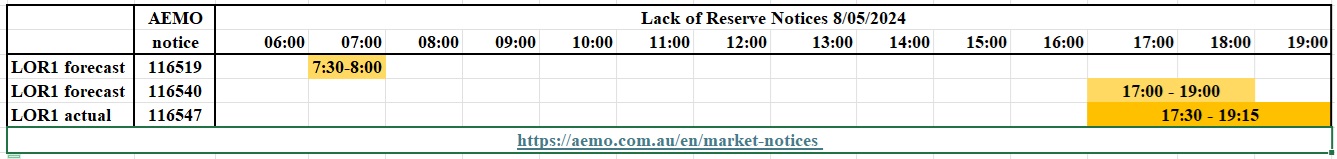 Fig 13: Table showing Lack of Reserve (LOR) warnings 8 May 2024
Summary:
The price spikes are indicators that the NSW power supply has severe problems to cope with multiple and simultaneous challenges like peak demand after sunset (in winter), unplanned outages of coal fired power plants, lack of wind and availability of gas fired plants.