What the agreement said
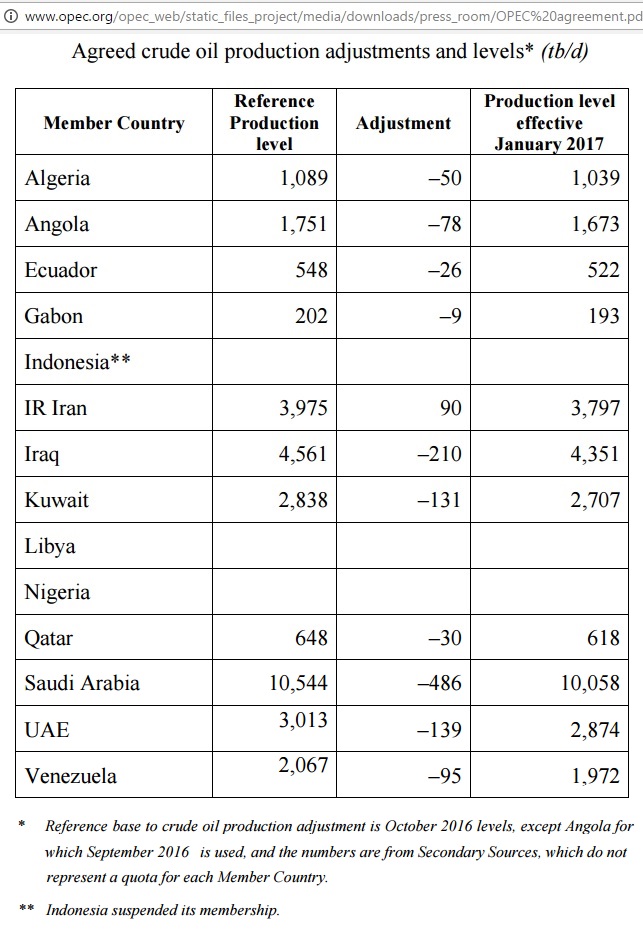
Fig 1: Production table from OPEC’s press release referred to as “agreement table”
“1. In the fulfilment of the implementation of the Algiers Accord, 171st Ministerial Conference has decided to reduce its production by around 1.2 mb/d to bring its ceiling to 32.5 mb/d, effective 1st of January 2017;
2. The duration of this agreement is six months, extendable for another six months to take into account prevailing market conditions and prospects;
3. To recognize that this Agreement should be without prejudice to future agreements;
4. To establish a Ministerial Monitoring Committee composed of Algeria, Kuwait, Venezuela, and two participating non-OPEC countries, chaired by Kuwait and assisted by the OPEC Secretariat, to closely monitor the implementation of and compliance with this Agreement and report to the Conference;
5. This agreement has been reached following extensive consultations and understanding reached with key non-OPEC countries, including the Russian Federation that they contribute by a reduction of 600 tb/d production.”
http://www.opec.org/opec_web/static_files_project/media/downloads/press_room/OPEC%20agreement.pdf
OPEC’s Monthly Oil Market Report November 2016
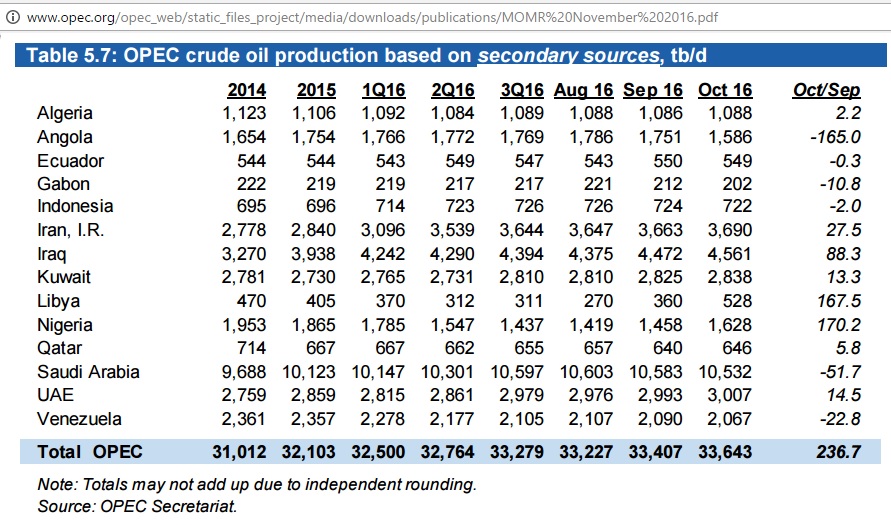
Fig 2: OPEC’s crude production according to secondary sources
Mysteries solved
So let’s do some bean counting on the above tables. We go down to the last kilo barrel not because we would have a particular confidence in the accuracy of data at this level but because we can then trace more easily where the numbers come from.
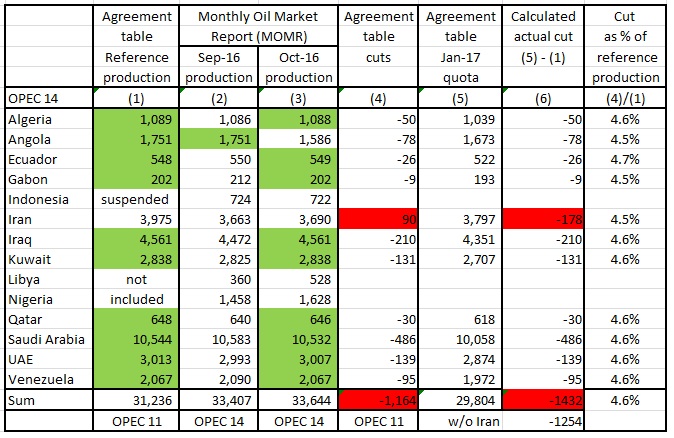
Fig 3: Calculations on agreement table
We observe:
- Reference production has been set at October 2016 production levels from the November Monthly Oil Market Report (secondary sources) with minor modifications but 2 big exceptions:
- Angola’s reference production was taken from September 2016 (Dalia oil field maintenance in October would advantage Angola)
- Iran’s reference production of 3,975 kb/d is a pre-sanctions level
- The numbers for Iran don’t add up. The additional allowance of +90 kb/d is actually a hidden cut of -178 kb/d from pre-sanction levels, but a 107 kb/d increase from October 2016
- The quota for OPEC 11 in January 2017 is 29,804 Kb/d
- The cuts are almost uniformly -4.6% of the reference production, a masterpiece of negotiations
The press release on cuts to “around 1.2 mb/d” could refer to the 1,164 kb/d which contains that arbitrary, non-matching 90 kb/d for Iran (column 4). Alternatively, it could also refer to the calculated cuts in column 6, excluding Iran. Cleverly done.
Another mystery is the press release mentioning a “ceiling” of 32,500 kb/d whereas the Jan 2017 quotas add up to 29,804 kb/d. The difference is 2,696 kb/d. Indonesia has been suspended (it is a net importer of oil anyway) so we have to add Oct 2016 production of Libya and Nigeria, together 2,156 kb/d. Thus Libya and Nigeria are expected and allowed to increase production by 2,696 – 2,156 = 540 kb/d. That makes a total cut for OPEC 13 of -1,412 + 540 = -872 kb/d.
Let’s sum it up for OPEC 13:
| OPEC 11 reference production | 31,236 kb/d |
| 4.6 % cut | -1,432 kb/d |
| Libya, Nigeria Oct 2016 production | 2,156 kb/d |
| Libya, Nigeria increase | 540 kb/d |
| 32,500 kb/d |
Therefore, the total cut for OPEC 13 is 32,500/(31,236+2,156) – 1 = -2.7%. Well done.
Let’s put all that into a graph to see how the 2017 quota is related to production history.
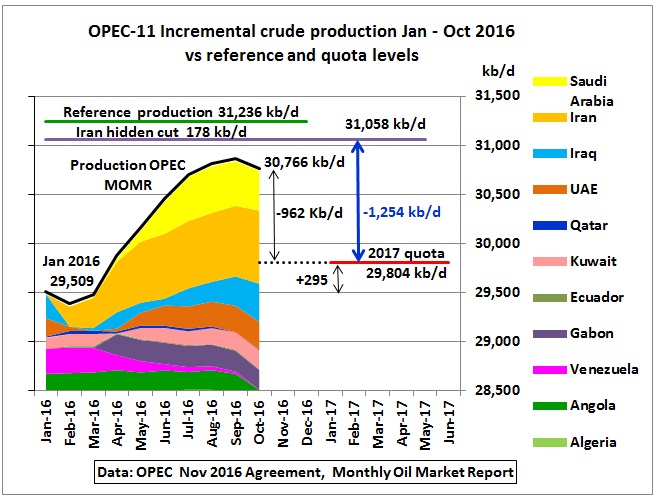
Fig 4: OPEC 11 actual 2016 vs 2017 quota
First, we stack incremental crude oil production using OPEC’s MOMR data. Incremental production is the production in each country exceeding the minimum in the period under consideration, here the 10 months from January to October 2016. The sum of the minimum production is the base production, in this case 28,528 Kb/d.
The axis range starts at 28,500 Kb/d so we don’t see much of it. Algeria, Ecuador and Qatar can also be hardly seen as their production did not change much. Gabon re-joined OPEC in July 2016.
The production in January 2016 was 29,509 Kb/d. The 2017 quota is 295 Kb/d higher.
Then we draw the reference and quota production lines.
From the reference production 31,236 Kb/d (column 1 in Fig 3) we deduct the hidden cut for Iran of 178 Kb/d to arrive at 31,058 kb/d. The cut to the quota level of 29,804 is 1, 254 kb/d (columns 5 and 6 in Fig 3).
Cynics will say that 11 OPEC countries increased production in 2016 so that they can announce production cuts (as a signal to increase oil prices) which will bring them back to where they were a year ago.
We will analyse this is part 2
Outlook
Why is it worthwhile to look into all these boring numbers? Because production cut compliance next year will not only be monitored by the Committee established under clause 4 of the agreement but also by the media, especially as a propaganda war with the US shale oil industry has broken out.
It is 100% certain that there will be many conflicting and confusing press releases so we can get back to the above numbers when necessary. And we can continue our production profile.
Part 2:
http://crudeoilpeak.info/opecs-2017-production-cuts-a-confusing-numbers-game-part-2