This post uses data released by the BP Statistical Review in June 2018
https://www.bp.com/en/global/corporate/energy-economics/statistical-review-of-world-energy.html
Oil production seems to have left its bumpy 6 year long (2010-2015) plateau of 8.4 mb/d and is now back to 2004 levels of 7.9 mb/d, a decline of 6% over 2 years.
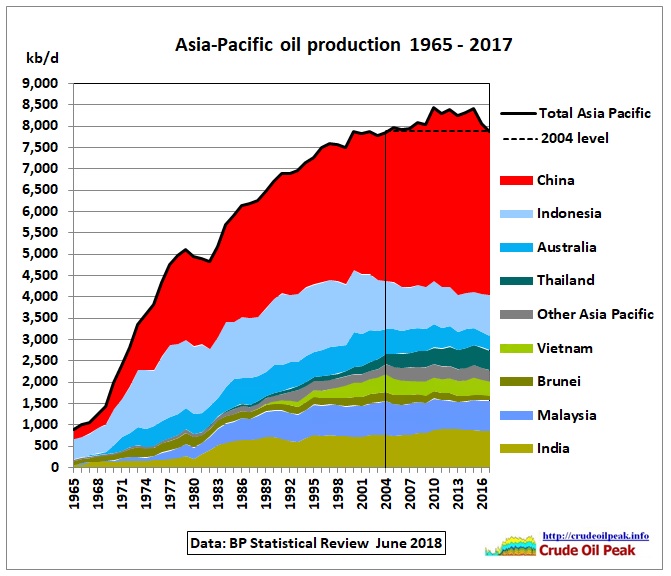 Fig 1: Oil production in Asia –Pacific
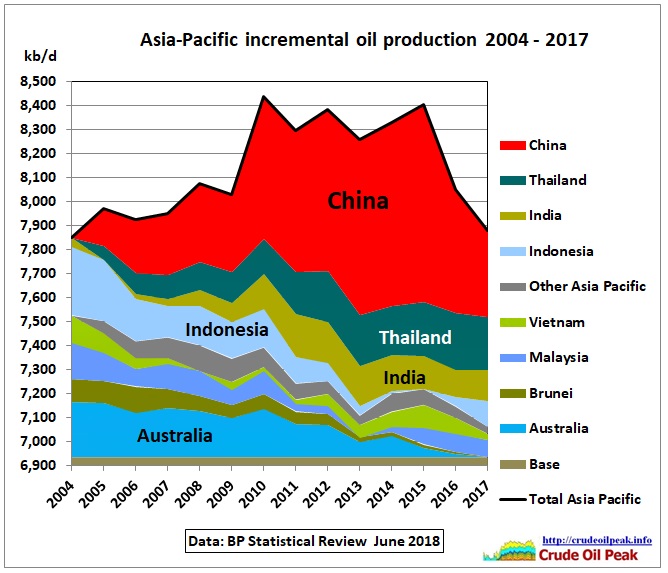 Fig 2: Incremental oil production
Base production is the sum of the minimum production levels in each country during the period under consideration. Incremental production is the production above that base production. In this way we clearly see that the peak was shaped by China, sitting on a declining wedge of all other Asian countries together. Note that growing production in Thailand and India could not stop that decline. Now let’s look at the other side of the coin, consumption:
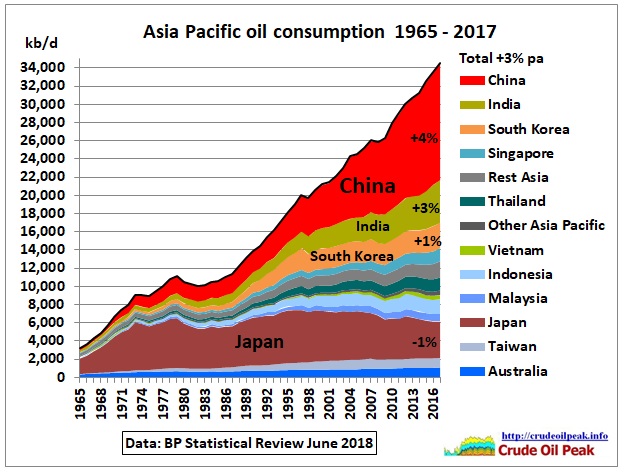 Fig 3: Asia’s oil consumption growth
There has been a relentless increase in consumption since the mid 80s. The growth rate after the financial crisis in 2008 was an average of 3% pa.
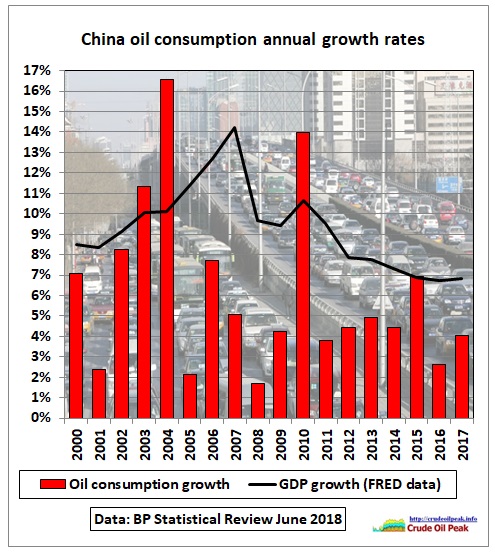 Fig 4: Chinese oil consumption growth rates
Chinese annual oil consumption growth rates have been quite variable between 2% and a whopping 16% in 2004 which contributed to high oil prices. Fig 4 also shows there is little correlation between GDP growth and oil consumption growth (statistical problems?). There is nothing in this graph that could tell us that the Chinese economy has a consistent trend to become less dependent on oil. In the years since 2011, oil consumption growth was around 60% of GDP growth.
Let’s compare China with the US. China’s oil consumption is catching up fast with US consumption.
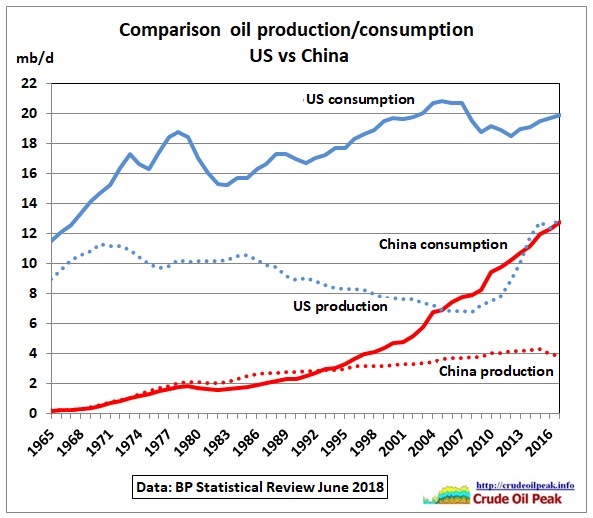 Fig 5: Oil production and consumption: US vs China
On current trends, China’s oil consumption would reach US consumption levels of 20 mb/d in just 14 years.
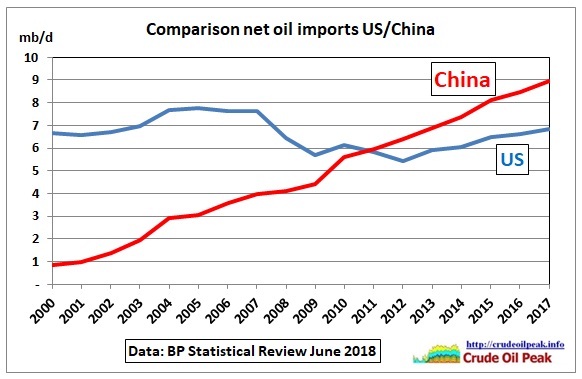 Fig 6: US and Chinese net oil imports
Contrary to misinformation by the media, the US is still a net importer of oil. Even blind Freddy can see that there will be intense competition for oil on global markets.
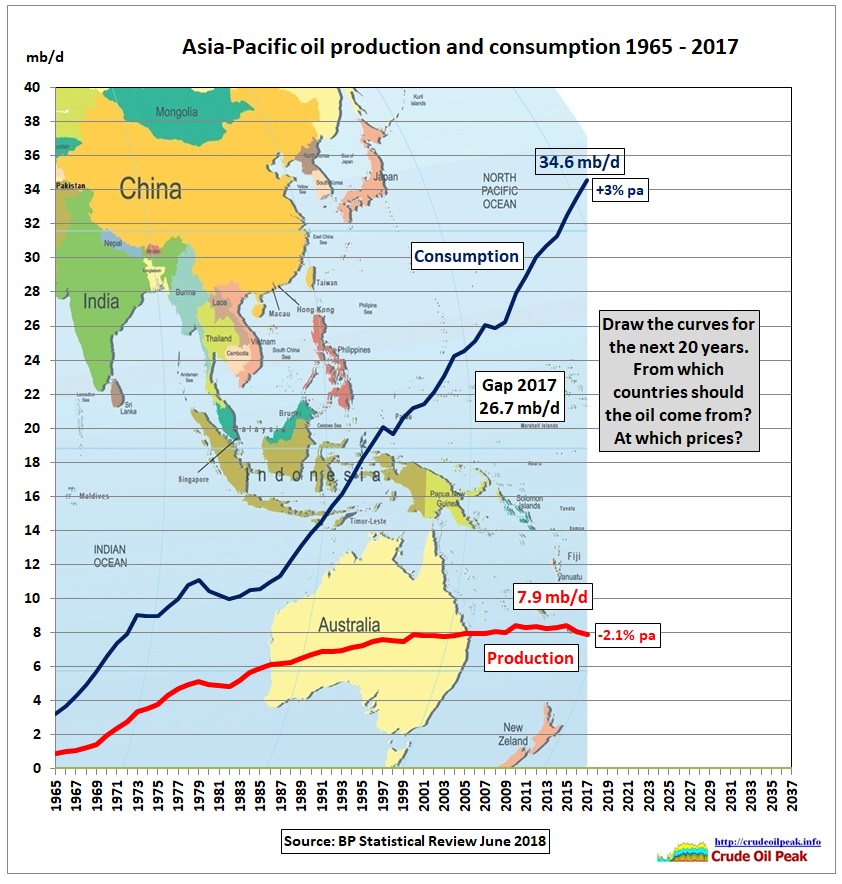 Fig 7: Oil supply gap for the Asia Pacific
All governments who plan for perpetual growth in Asia (new freeways, road tunnels, airports etc) should fill in the above graph. Hint:
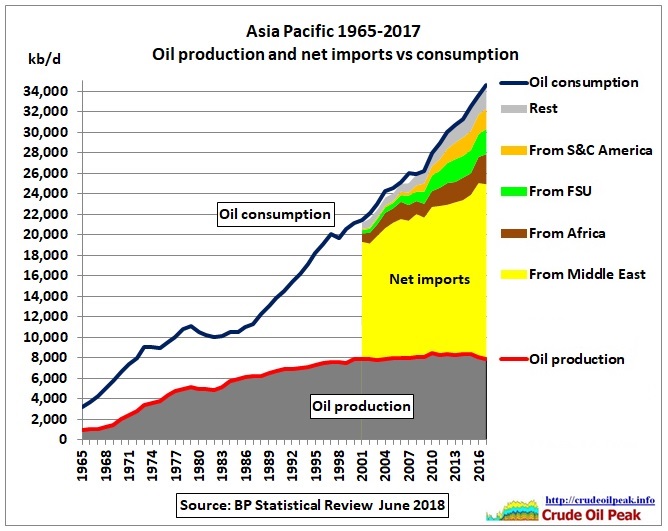 Fig 8: Asian net oil imports
We can see that Asia has diversified its sources of oil imports but is still utterly dependent on Middle East oil:
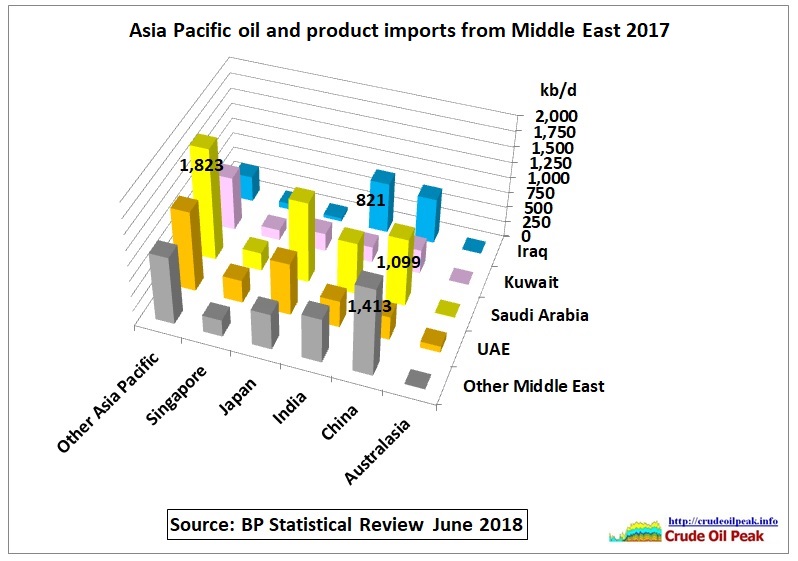 Fig 9: Asian inter area oil movements with the Middle East
“Other Middle East” is Iran and Oman (as Syria and Yemen no longer export oil)
China is preparing for the future by building bases to secure oil supply routes:
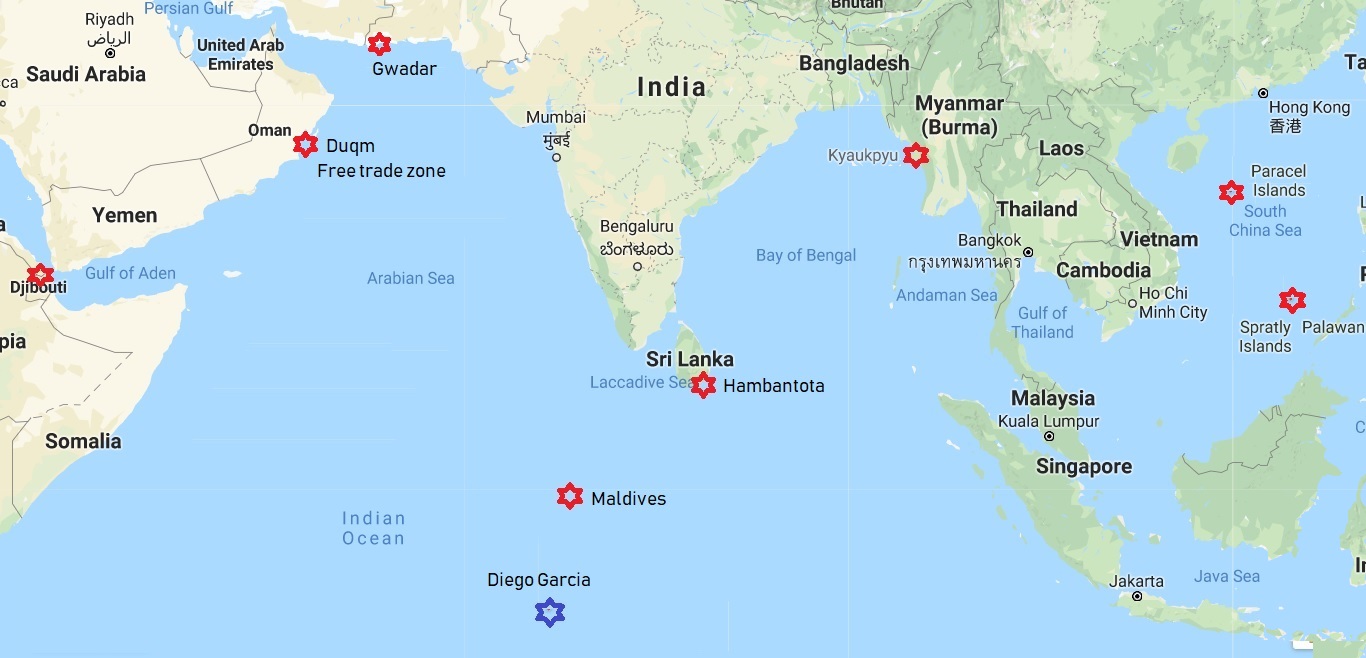 Fig 10: Red stars show Chinese ports/bases in various stages of development
4 June 2018
On Tuesday, the bombers flew from Diego Garcia and conducted “training” in the vicinity of the South China Sea, returning back to Diego Garcia the same day, according to the statement from US Pacific Air Forces.
https://edition.cnn.com/2018/06/04/politics/us-b52-spratly-flyover/index.html
16 June 2018
Beijing has carried out anti-aircraft drills with missiles fired against drone targets over the South China Sea after the US challenged it by flying B-52 bombers across the region.
https://www.businessinsider.com.au/china-does-anti-aircraft-drill-in-south-china-sea-after-us-b-52-flight-2018-6
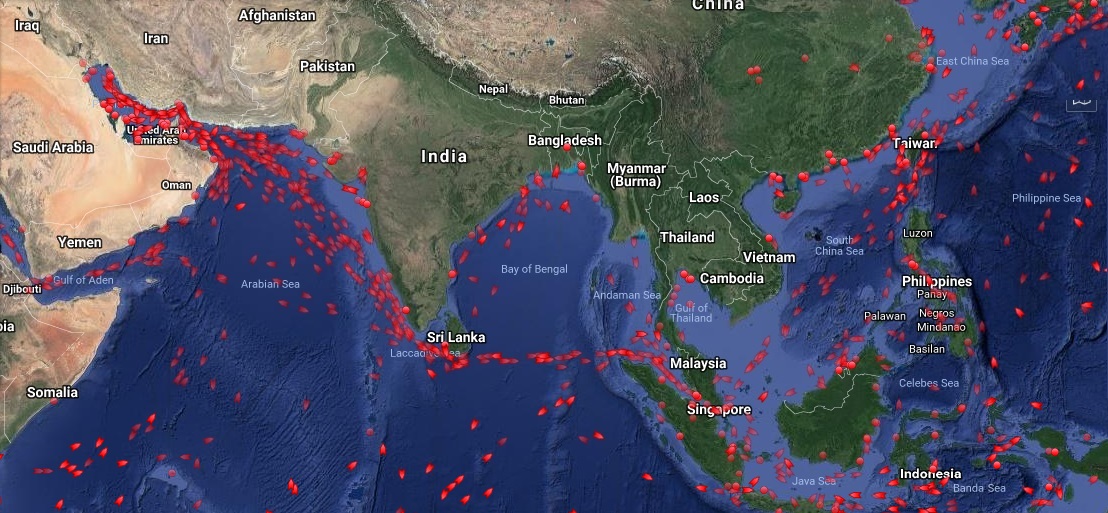 Fig 11: Tanker traffic 17/6/2018 from https://www.marinetraffic.com
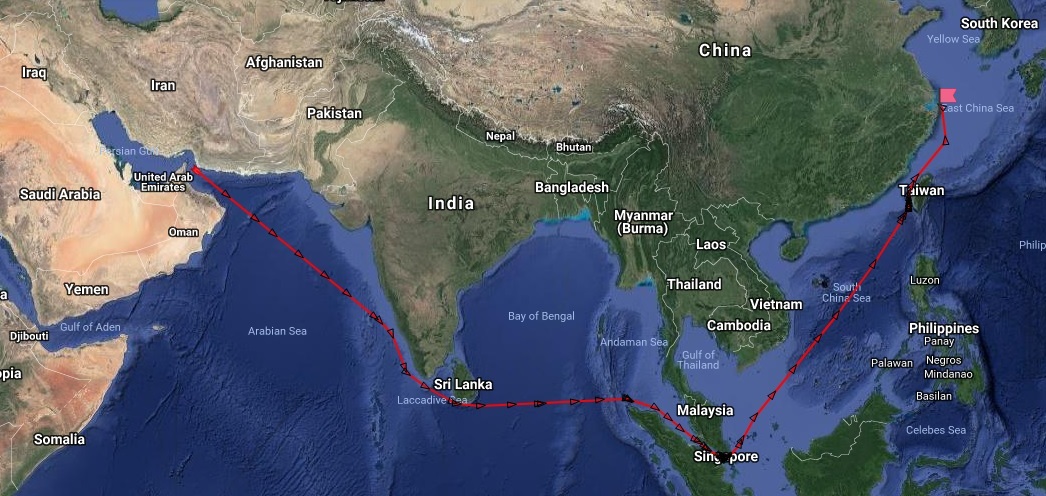
Fig 12: Typical tanker route from the Persian Gulf to China
Reserves
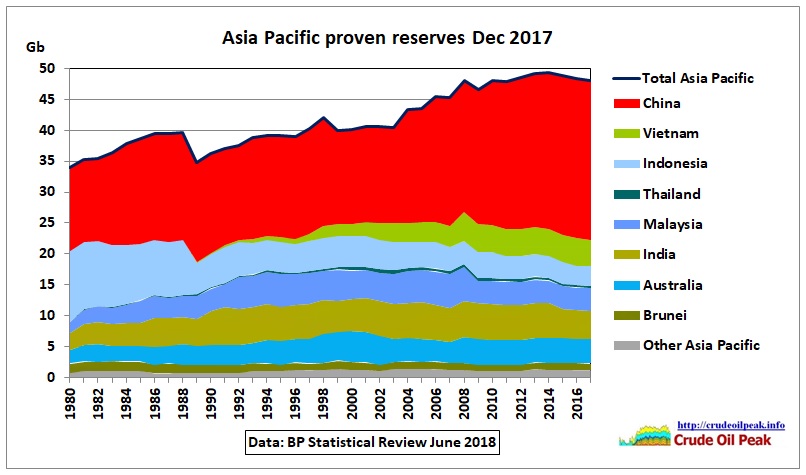 Fig 13: Asian oil reserves
Proven reserves have not changed much in the last years meaning that P2 and P3 reserves have been proved up commensurate with production. The reserve to production ratio is 16.7 years equivalent to an annual depletion rate of 6%, a little bit higher than a reasonable rate of 5% (R/P of 20 years).
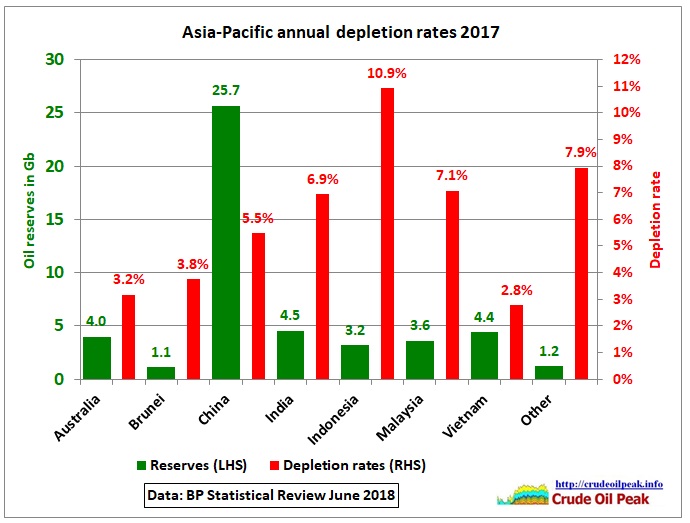 Fig 14: Annual depletion rates
The depletion rates vary considerably and may only be approximate as oil reserves will have been estimated by using differing methodology and accuracy. Indonesia’s depletion rate is very high. Not shown in Fig 14 is Thailand where the depletion rate is off the charts (almost 50%) suggesting reserves are too low.
In part 2 we look at the oil balance in each country.
12/8/2018
Peak oil in China and the Asia Pacific (part 2)
http://crudeoilpeak.info/peak-oil-in-china-and-the-asia-pacific-part-2