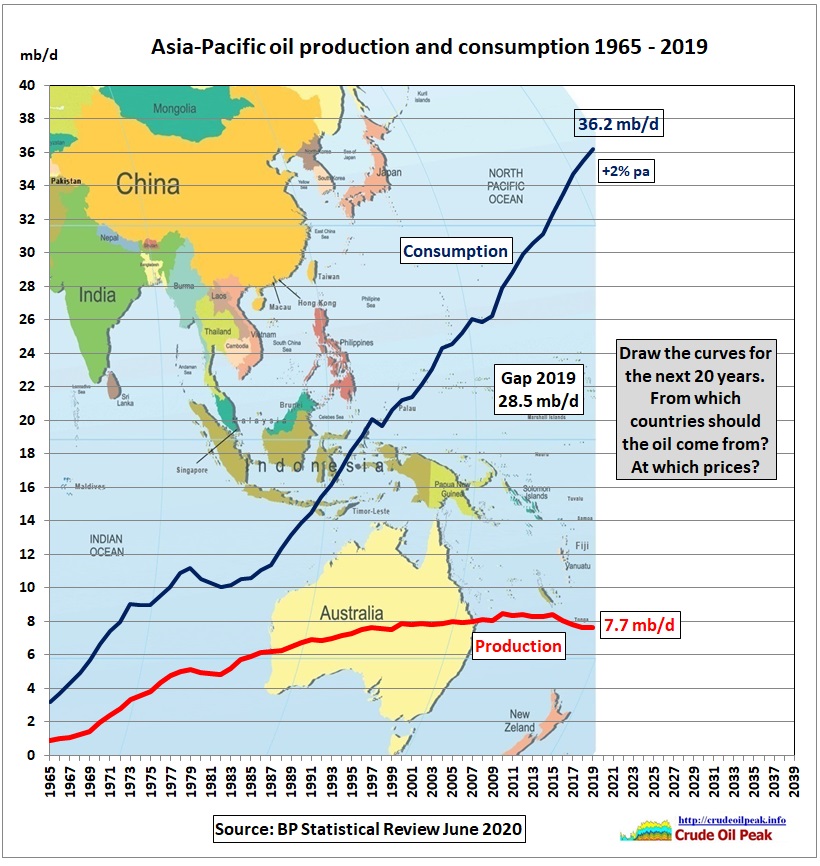
 Fig 1: Asian oil consumption is around 5 times higher than production
The production decline after the peak in 2015 is very modest. The size of the gap between consumption and production is mainly determined by consumption growth rather than by production decline. Will the Corona virus stop the gap growing?
Let’s have a look at which Asian countries consumed how much oil over the years
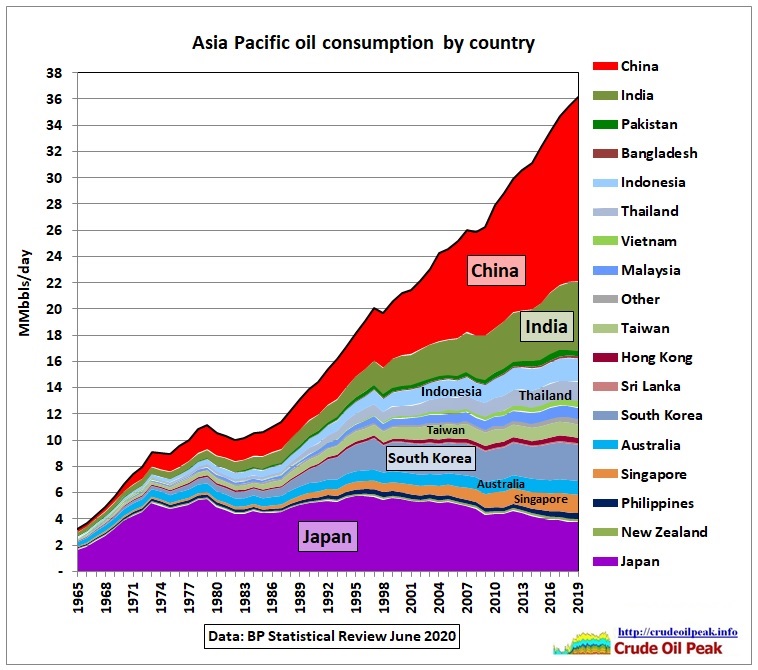 Fig 2: Asian oil consumption by country
Total Asia-Pacific oil consumption grew from 26.2 mb/d in 2009 to 36.2 mb/d in 2019 or by 10 mb/d This is net growth consisting of 11.6 mb/d gross growth (out of which 5.8 mb/d in China and 2 mb/d in India) and 1.6 mb/d gross decline (600 kb/d in Japan).
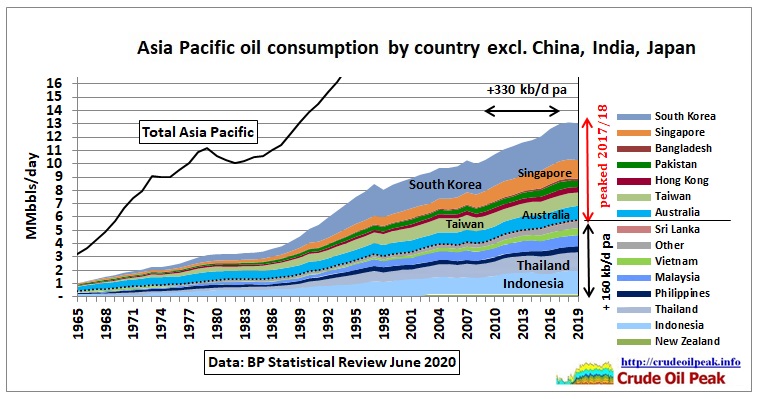 Fig 3: Subgroup with different trends
The subgroup in Fig 3 grew oil consumption at 330 kb/d pa after 2009 until 2017. Then countries above the dotted line (7.2 mb/d in 2019) peaked while the other countries below the dotted line (5.8 mb/d in 2019) continued to grow at 160 kb/d. The net effect was a flat oil consumption for 3 years.
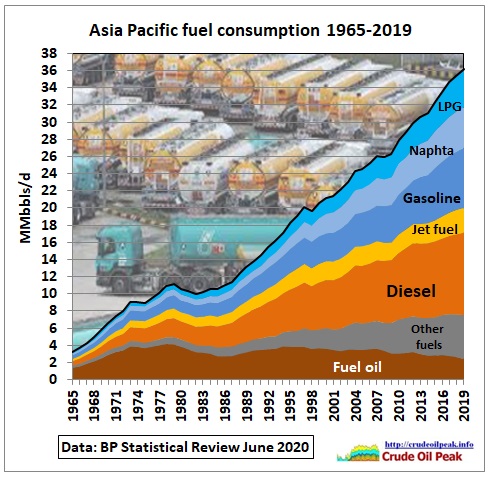 Fig 4: Asia Pacific consumption by fuel
We see how important Diesel is. Fuel oil use is much lower than before the 2nd oil crisis in 1979. Naphta and other fuels are mainly used in the chemical industry.
Asian oil consumption growth is dominated by China and India.
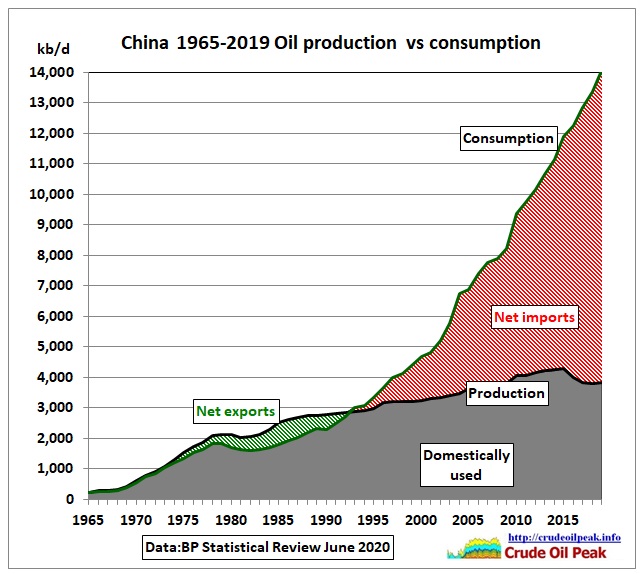 Fig 5: Peak oil in China
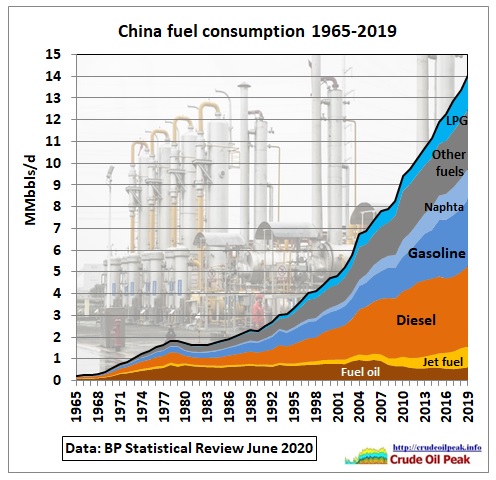 Fig 6: China fuel consumption by type
While recent consumption curves in the above graphs look quite smooth, annual changes reveal a more complex picture with varying growth and even decline rates over time and in different countries.
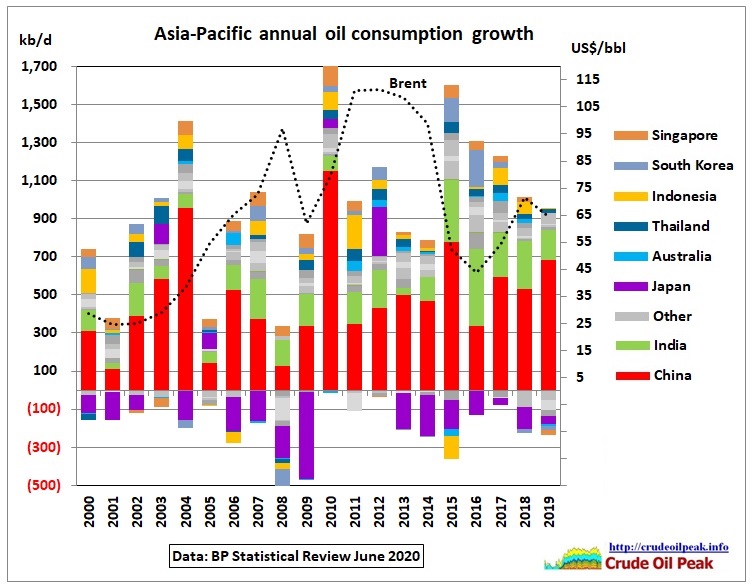 Fig 7: Asian oil consumption growth and decline (gross)
In the last 5 years gross growth came down from 1.6 mb/d to 950 kb/d, dominated by China and India.
China’s oil consumption grew by a whopping 1.1 mb/d in 2010 as a result of a 2009/10 stimulus package amounting to almost 6% of GDP (estimated at RMB 2 Tr). https://treasury.gov.au/publication/chinese-macroeconomic-management-through-the-crisis-and-beyond/2011-01-chinese-macroeconomic-management-through-the-crisis-and-beyond/4-chinas-stimulus-package
But there were years in which China’s oil consumption grew by only 300 kb/d. Given that oil consumption is an indicator for economic activity, let’s see whether this is reflected in China’s official GDP data:
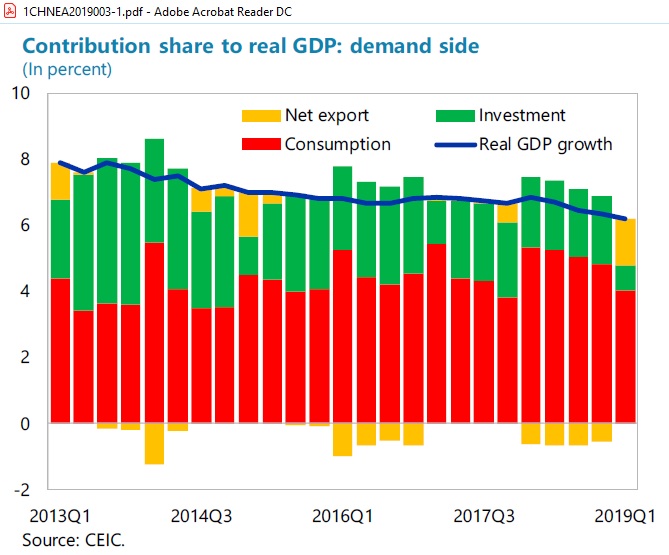 Fig 8: China’s real GDP growth as quoted by the IMF
The discrepancy between changing annual oil consumption growth (Fig 7) and a very smooth GDP growth curve (Fig 8) is only too apparent. We know that China’s GDP data are targets.
China scraps annual economic growth target for first time
22 May 2020
https://www.bbc.com/news/business-52765958
Now the Corona virus has reset everything.
To be continued.
Peak oil in Asia Update June 2020 (part 2)
https://crudeoilpeak.info/peak-oil-in-asia-update-june-2020-part-2