Asian oil production peaked above 8 mb/d for the period between 2008 and 2016 (with spikes in 2010 and 2015). The 2015 peak was mainly caused by peak oil in China. Since then Asia’s decline was almost 800 kb/d or 9%.
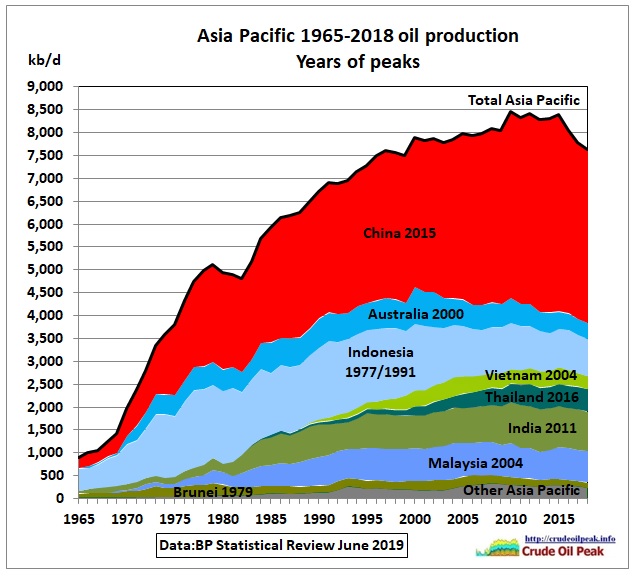 Fig 1: The Asian oil peak lasted 8 years
The rest of Asia peaked already in 2000 (the year Australia peaked) followed by a very modest decline of 1.1% pa. Let’s go through the countries one by one.
In the following, net oil imports are defined as the difference between oil consumption and production. Please see the note at the end of this post.
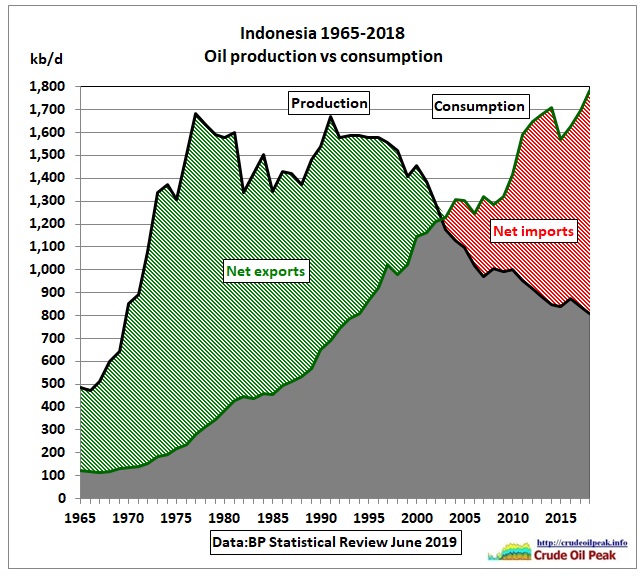 Fig 2: Indonesia is in terminal production decline since the 1990s
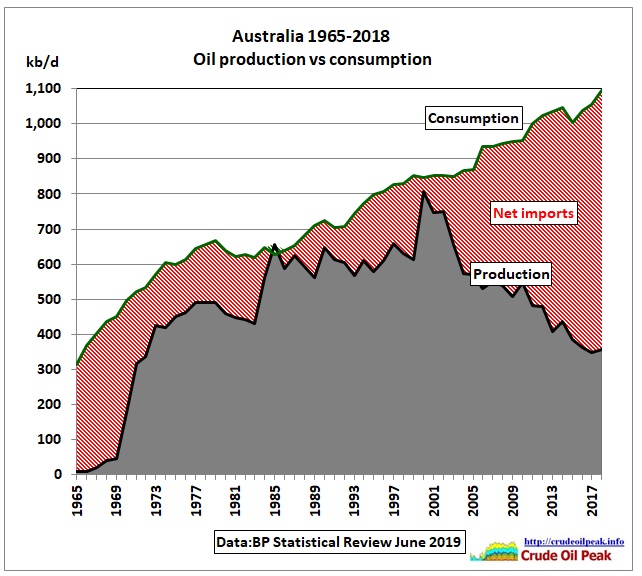 Fig 3: Australia’s net oil imports
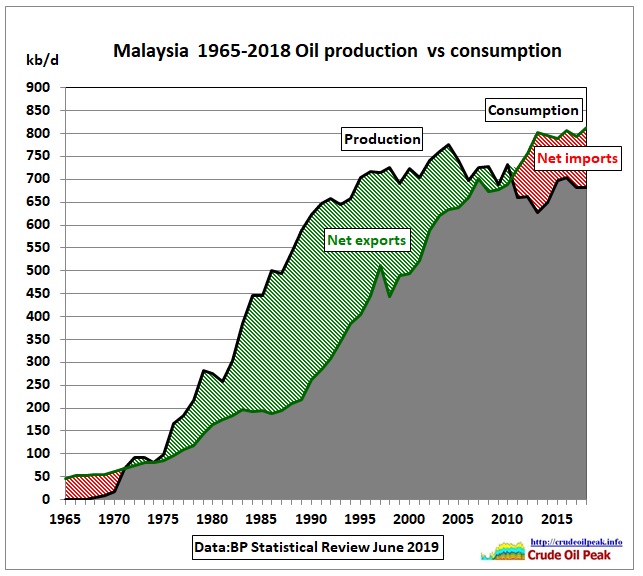 Fig 4: Malaysia is a net importer since 2010
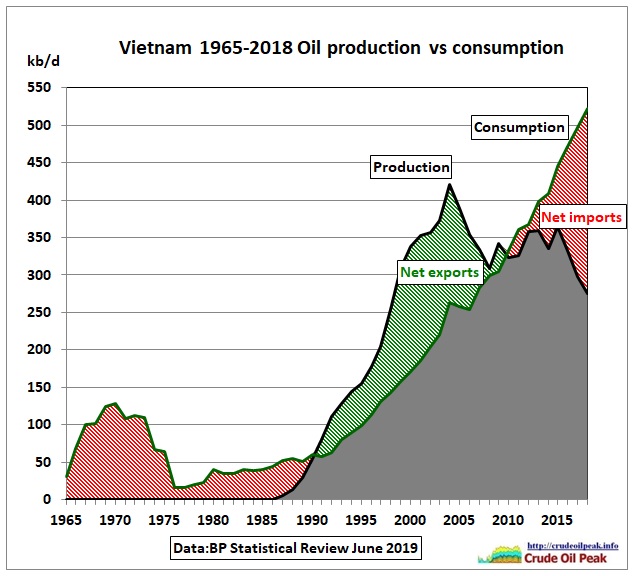 Fig 5: Vietnam’s net imports are increasing fast
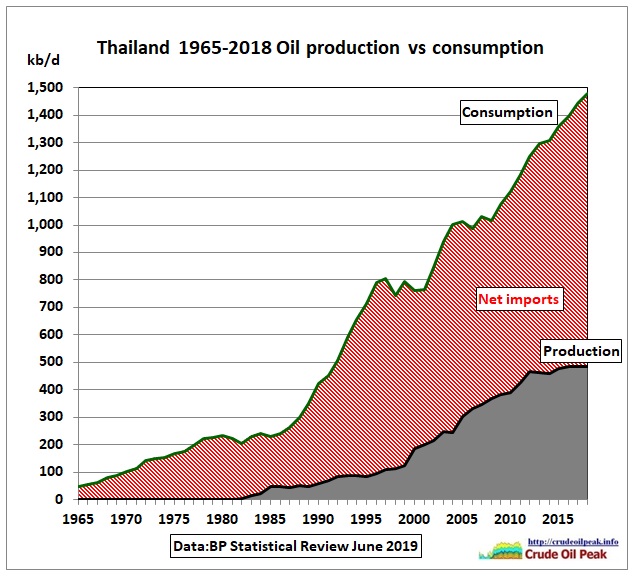 Fig 6: Thailand was always a net importer
Thailand’s consumption increases faster than production.
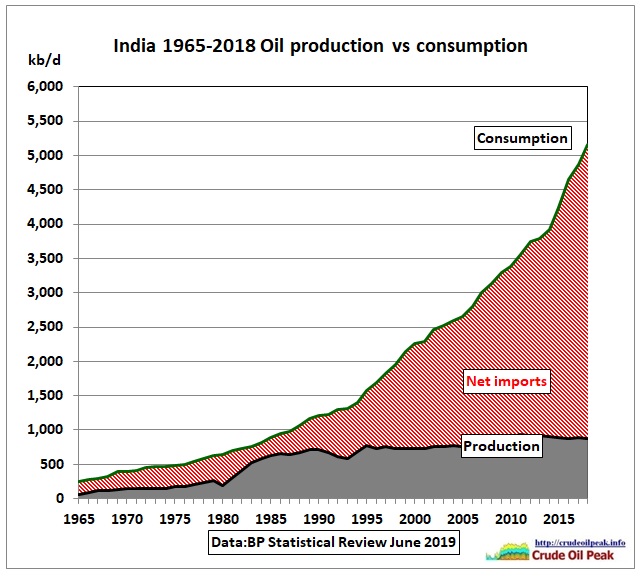 Fig 7: India’s consumption exceeded 5 mb/d in 2018
While India’s production is stuck well below 1 mb/d.
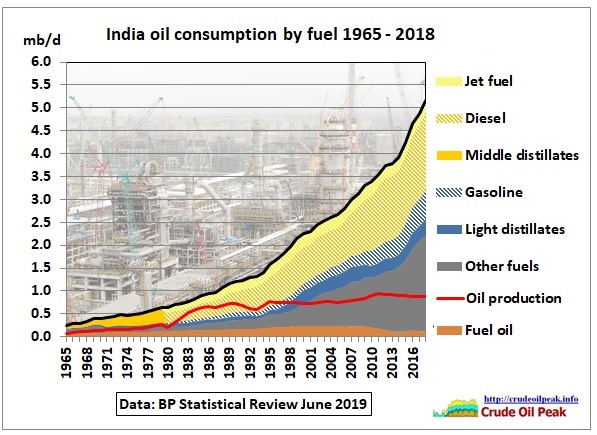 Fig 8: India’s consumption of diesel is much higher than that for petrol
Other fuels “consists of refinery gas, LPG, solvents, petroleum coke, lubricants, bitumen, wax, other refined products and refinery fuel and loss”
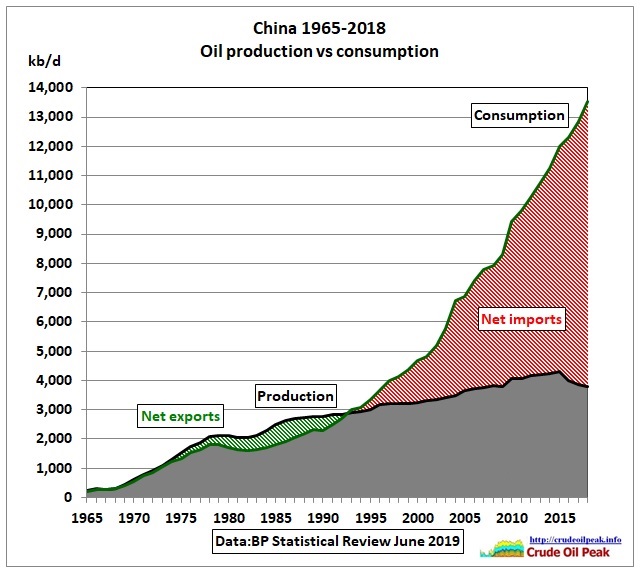 Fig 9: China’s production peaked 2015 while consumption is growing sky-high
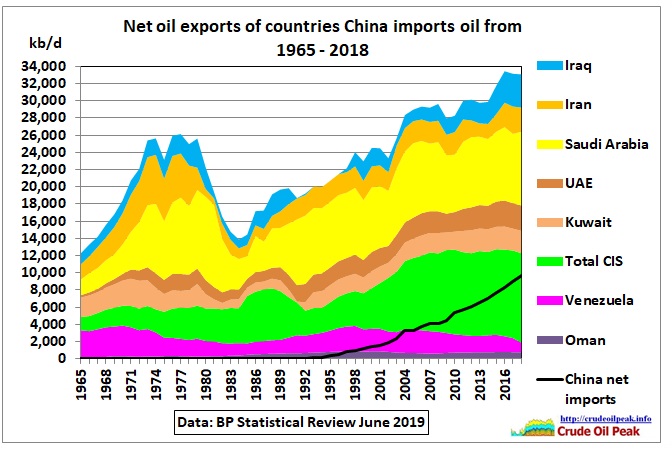 Fig 10: Net oil exports of countries China imports oil from
In 2018, China’s net imports were 9.7 mb/d or 30 % of net exports of countries shown in the above graph. We can see that a recent increase of exports came mainly from Iraq and Iran but that was before Trump’s sanctions were imposed on Iran.
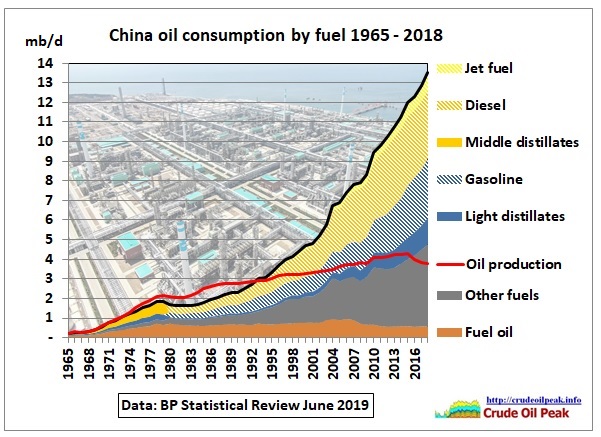 Fig 11: China’s growing gasoline consumption indicates increasing urbanization
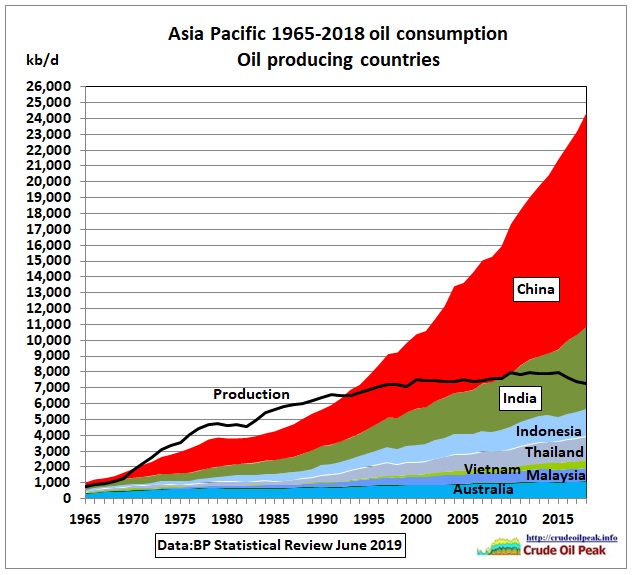 Fig 12: Asia’s oil consumption growth is dominated by China
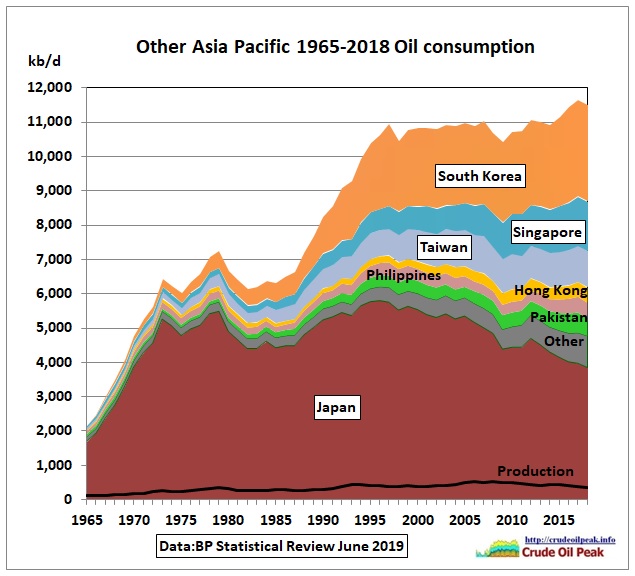 Fig 13: Asian countries with no or negligible oil production
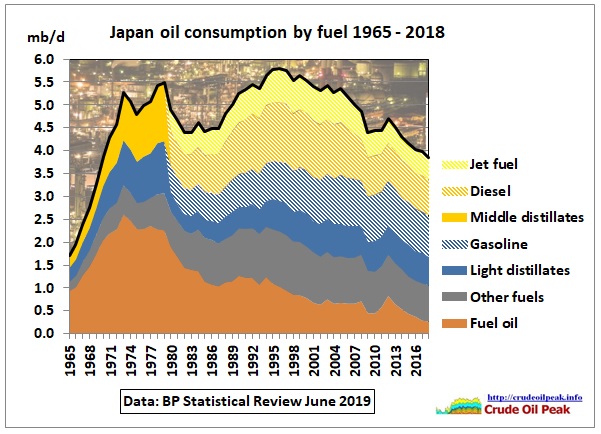 Fig 14: Use of fuel oil peaked in the 1970s (note the spike after the Fukushima accident)
Japan’s consumption peaked in the 1973 and 1979 oil crises and finally in 1996.
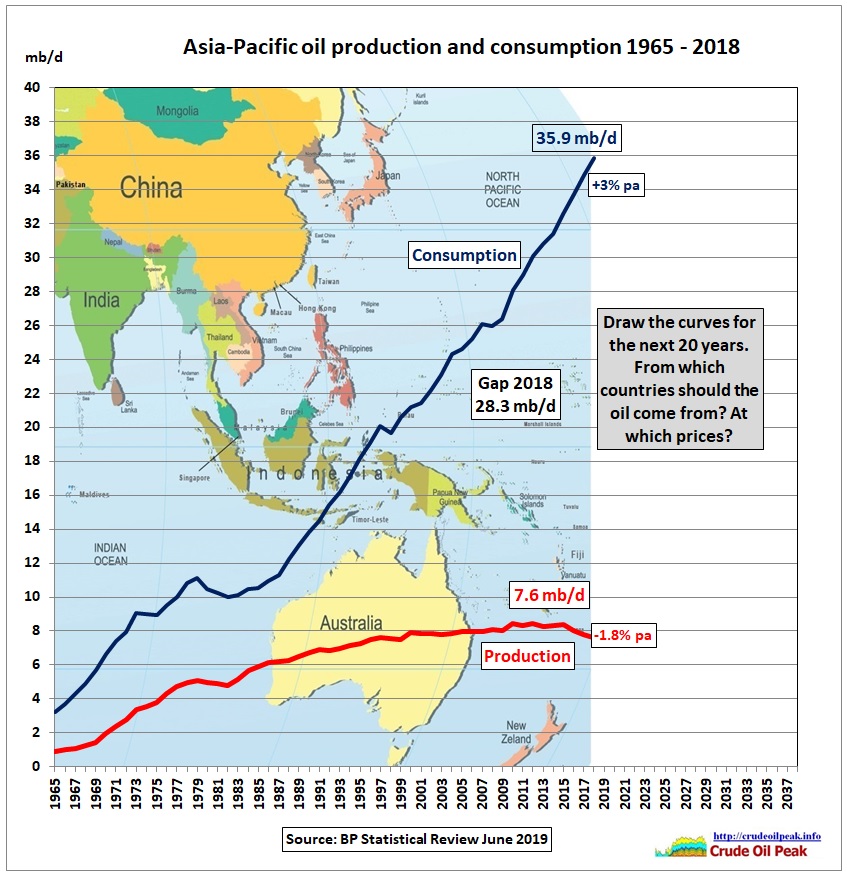 Fig 15: Homework for all governments who assume perpetual growth in Asia
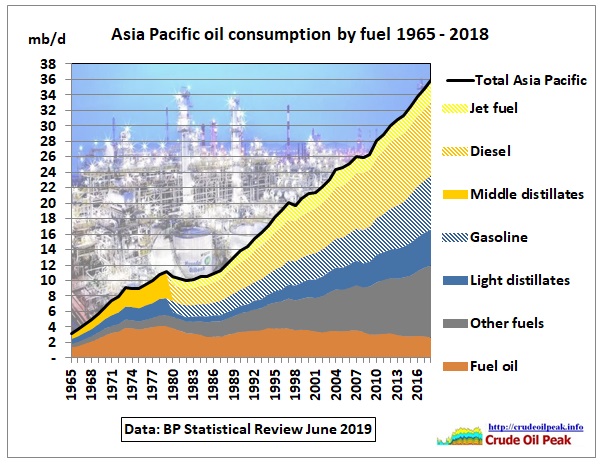 Fig 16: Dramatic events must happen to break this growth path
Note that jet fuel, diesel and gasoline data are not available before 1980.
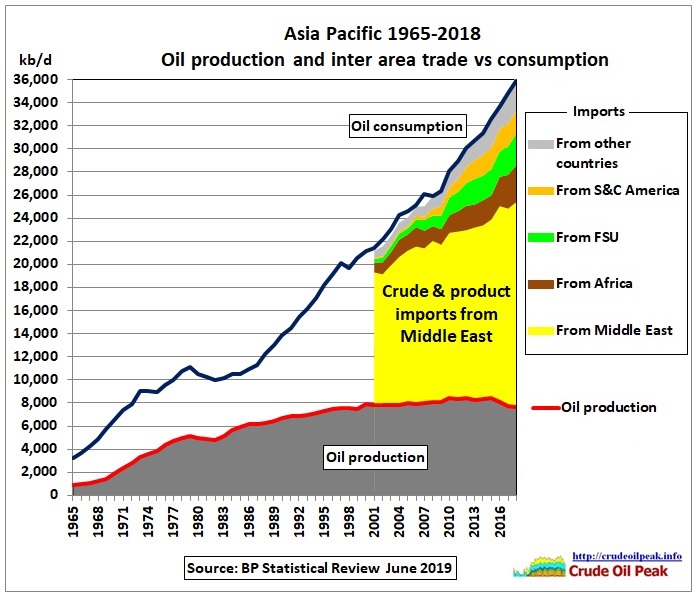 Fig 17: Stacked graph showing Asian oil production and imports
We can see that Asia diversified its oil imports to Africa, Russia and South/Central America, thereby reducing its Middle East dependency from 82% in 2005 to 62% in 2018. However, in absolute numbers, Asia’s oil imports from the Middle East still increased by 4.6 mb/d since 2005. Almost half of that increase, 2.2 mb/d, occurred after 2015, the year of China’s peak. See Fig 10 as to how that relates to Middle East oil exports.
Let’s have a look at production in the other regions where Asia imports oil from:
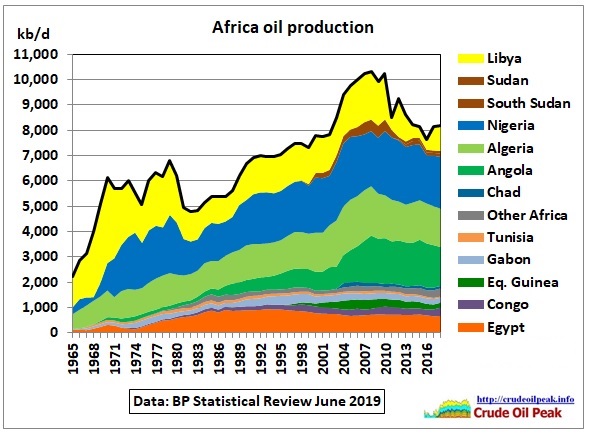 Fig 18: African oil production peaked 2007-2010
Egypt has peaked but production is basically flat. Algeria has peaked and production is on a modest decline. Angola’s peak is not yet established. Nigeria is on a bumpy plateau. Libya is a wild card.
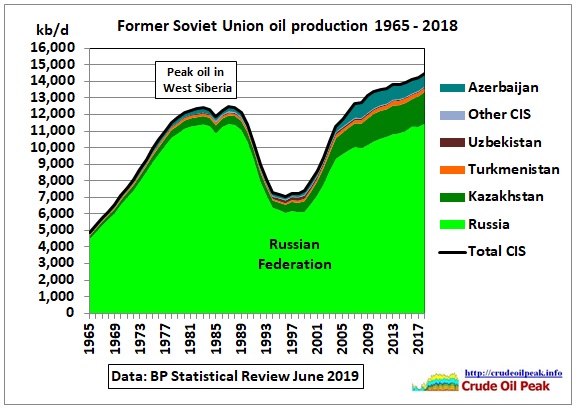 Fig 19: FSU oil production
In 2018, Russian oil production finally reached the same level as in 1983 and 1987 when the West Siberian oil fields peaked. In the mid 80s this peak and the Chernobyl nuclear accident in 1986 created a perfect energy crisis which brought down the Soviet Union. Since China’s oil peak in 2015 Russian oil production increased by 400 kb/d over 4 years, hardly enough for China. Nevertheless, new projects in East Siberia are at various stages of development and the geographical proximity will favour exports to China.
As far as other FSU countries are concerned, Azerbaijan has peaked in 2010 but Kazakhstan increased production by around 200 kb/d in the last 2 years after a bumpy plateau between 2010 and 2016.
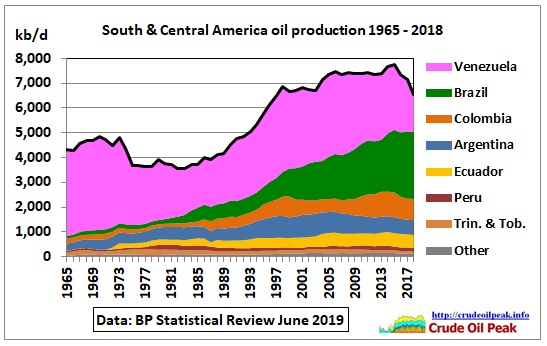 Fig 20: South and Central America
Venezuela’s conventional oil production has peaked (Maracaibo, Furrial) which has also reduced extra heavy oil production from the Orinoco belt as light oil is needed for blending/dilution. This has impacted on China’s Sinovensa which already suffers from debt repayment problems.
Although Brazil’s production in 2018 was slightly down from2017 this may not be the final peak which requires several years to get confirmed. The rest of South America is either at peakor already in decline (e.g. Argentina)
Conclusion:
Asia is utterly dependent on the Middle East. How long current diverging trends of growing consumption and declining production can continue peacefully is unknown. The militarization of the South China Sea, part of the Maritime Silk Road to secure China’s oil import routes, gives a hint how the future will look like. Chindia depends on Iranian oil while the US has put sanctions on Iranian oil exports. This conflict has lead to tensions in the Strait of Hormuz. A weak global economy with soft oil demand would be helpful to keep problems under control.
Related links:
4/11/2017
Former Prime Minister Howard assumes US shale oil will provide for China’s oil demand growth
http://crudeoilpeak.info/former-prime-minister-howard-assumes-us-shale-oil-will-provide-for-chinas-oil-demand-growth
Note on difference in measuring oil production and consumption
Oil consumption as shown in graphs above is inland demand for various fuels (oil products including biofuels and derivatives of coal and natural gas) plus international aviation and marine bunkers and refinery fuel and loss. Oil production is defined as coming from crude oil, shale oil, oil sands, condensates (both lease condensate and gas plant condensate) and NGLs (natural gas liquids – ethane, LPG and naptha separated from the production of natural gas).
In the BP Statistics, world oil consumption is around 5 mb/d higher than production. The BP report writes: “Differences between these world consumption figures and world production statistics are accounted for by stock changes, consumption of non-petroleum additives and substitute fuels, and unavoidable disparities in the definition, measurement or conversion of oil supply and demand data.”
It goes beyond the scope of this article to reconcile these differences country by country. So we need to keep these differences in mind. Nevertheless, the net oil import trends – defined in this post as the difference between consumption and production – remain unaffected by these definitional issues. Most likely the year in which a country turns into a net oil importer may change after a more detailed analysis.