South China Sea: ‘Leave immediately and keep far off’
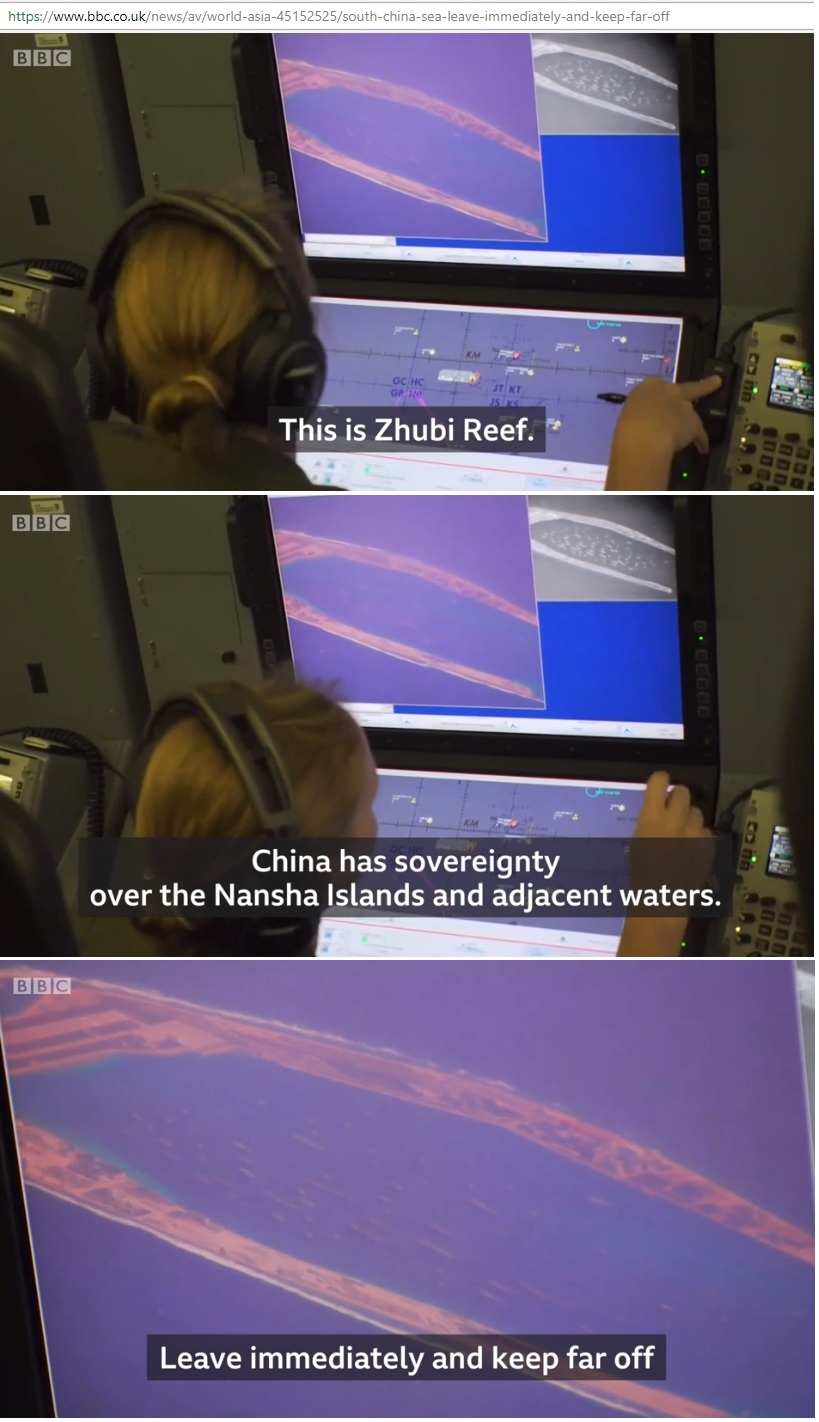 Fig 1: U.S. Navy P-8A Poseidon reconnaissance plane overflying disputed Spratly islands
11/8/2018
https://www.youtube.com/watch?v=dodbqgKn8js
https://www.bbc.co.uk/news/av/world-asia-45152525/south-china-sea-leave-immediately-and-keep-far-off
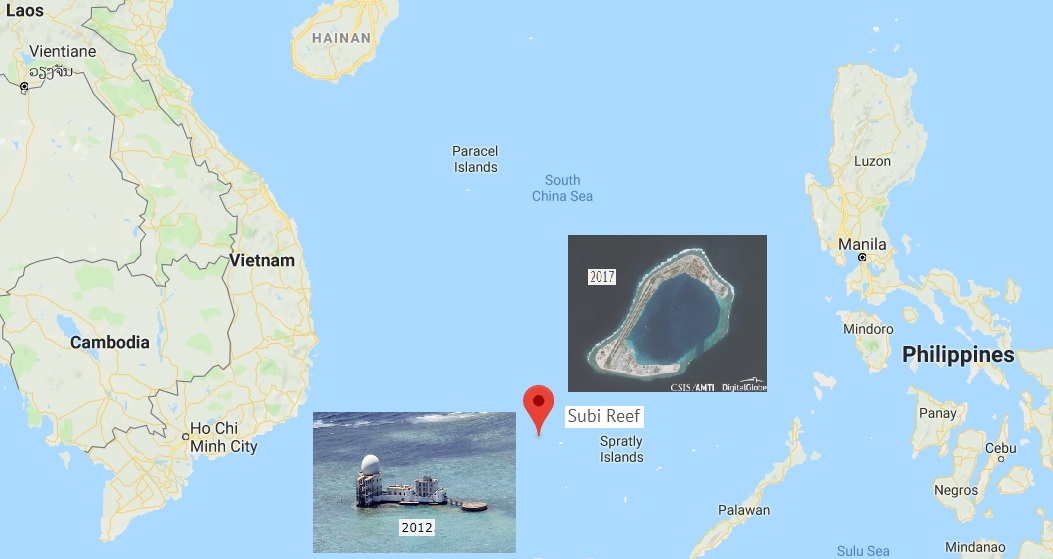 Fig 2: Subi reef location in the South China Sea
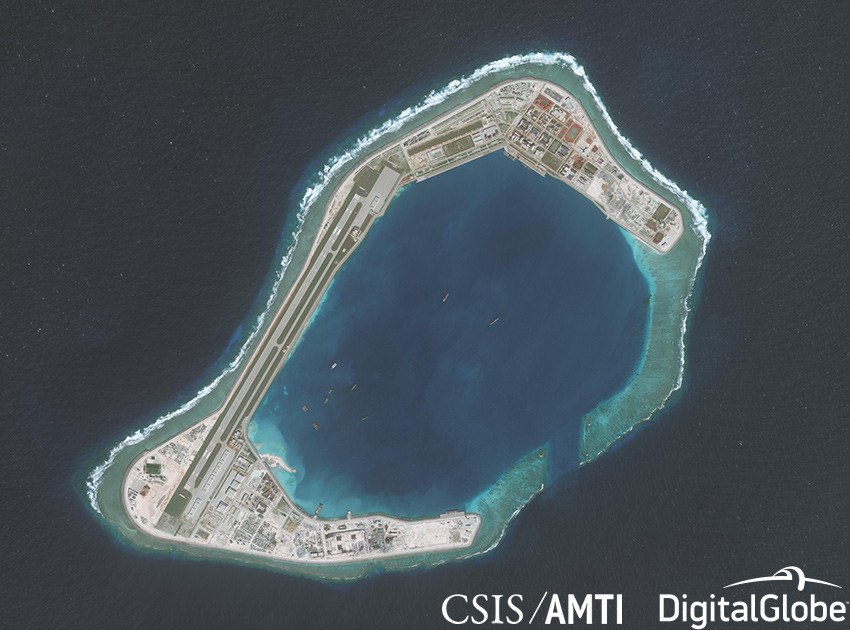 Fig 3: CSIS image of Subi reef low tide elevation (976 acres reclaimed)
https://amti.csis.org/subi-reef/
.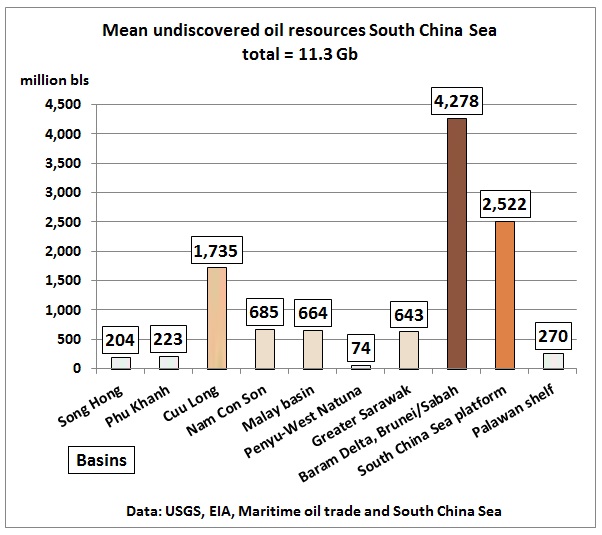 Fig 4: USGS 2010 assessment of undiscovered oil resources
https://pubs.usgs.gov/fs/2010/3015/pdf/FS10-3015.pdf
According the USGS there is not much oil in the South China Sea. China is securing its oil supply routes as future oil imports are going to increase after production peaked 2010-2015.
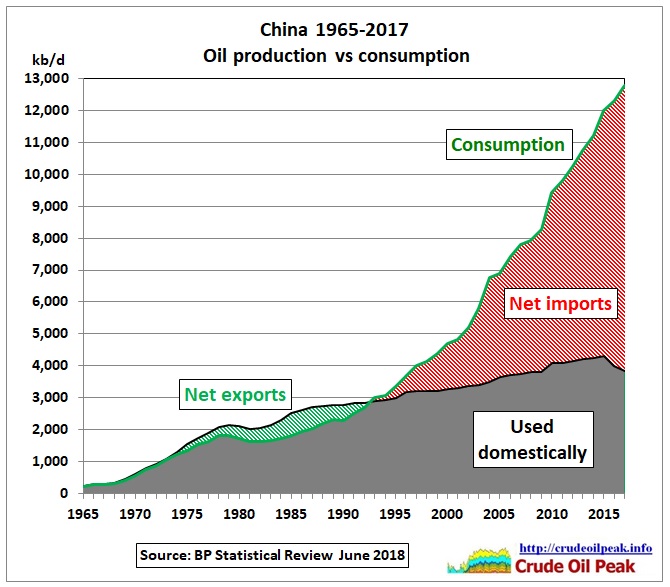 Fig 5: China oil consumption and net imports
On average, Chinese oil consumption grew exponentially (!) between 1982 and around 2010 at 6.5% pa. In some years, there were huge variations around this trend. For example in 2004 oil consumption increased by almost 1 million barrels/day, 500 kb/d above the long term trend. This spike was caused by additional fuel oil needed for back-up power generators as there were wide spread power shortages. In the following (Katrina) year 2005 consumption growth dropped to just 150 kb/d as fuel shortages started.
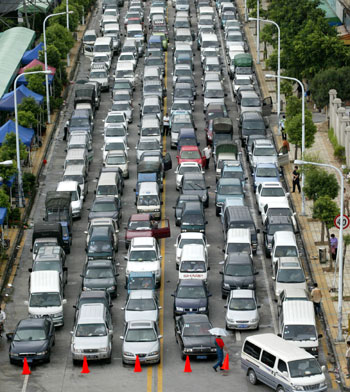 Fig 6: Petrol shortages August 2005 in Guangdong
http://www.newsgd.com/news/picstories/200508180019.htm
Smoke and Mirrors in China’s Oil Statistics
June 2008
In recent years, oil product shortages in China have frequently caught the attention of the world. In August 2005, China’s southern manufacturing heartland of Guandong was plagued by closed service stations, fuel rationing and hours-long gas queues, and authorities were forced to send thousands of police to petrol stations in Guangzhou to prevent massive social unrest as drivers scrambled to fill their tanks (Wall Street Journal, August 19, 2005). In May 2006, a diesel shortage hit Guangdong again and lasted for half a month until a 270,000 ton emergency stock of gasoline and diesel fuel were allocated to the local market by China National Petroleum Corporation (CNPC) and China Petroleum and Chemical Corporation (Sinopec) (Xinhua News Agency, May 23, 2006). Since then, not only has the frequency of oil shortages increased, but also the geographic coverage of such events, extending to Beijing, Shanghai, Yunnan, Xian, and Henan (International Herald Tribune, October 31, 2007; Henan Business Daily, October 30, 2007; China Daily, March 29). On May 12, a magnitude 8.0-earthquake struck southwest China with its epicenter at Wenchuan County in Sichuan province. The death toll so far has exceeded 40,000 with 248,000 injured and 32,000 missing. To speed its unprecedented disaster relief efforts, Beijing had to drain its strategic oil reserves (Xinhua News Agency, May 20). The constraint on China’s petroleum infrastructure by the earthquake coupled with China’s recent stockpiling of diesel fuel ahead of the 2008 Beijing Olympics Games have unsurprisingly raised anxiety about the stability of the international oil market (Wall Street Journal, May 19).
https://jamestown.org/program/smoke-and-mirrors-in-chinas-oil-statistics/
China is reducing subsidies
July 2008
George Bush: “ I was heartened by the fact that the Chinese the other day announced that they’re going to start reducing some of their subsidies, which all of a sudden you may have some, you know, demand-driven changes in the overall balance.”
https://georgewbush-whitehouse.archives.gov/news/releases/2008/07/20080715-1.html
These were the first signs that exponential growth can’t continue forever. So let’s do some curve fitting to find underlying trends. We start with 1982 (a minimum of oil consumption at the time), after the 1970s oil crises and 4 years after Deng’s reforms were announced.
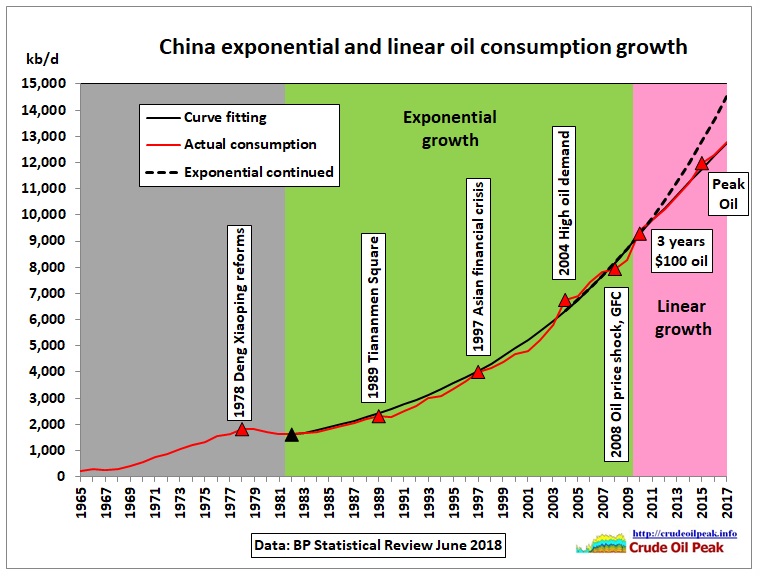 Fig 7: The curve which changes the world
We see that whenever oil consumption growth stagnated as a result of a crisis, it bounced back to the previous trend curve after a couple of years. The oil shock and financial crisis year 2008/09 was an exception. In 2010 the exponential trend ended and changed into a linear one. This was the period of $100 oil prices. If the exponential trend had continued, consumption in 2017 would have been 14.5 mb/d instead of 12.7 mb/d. A higher consumption of 1.8 mb/d in China could have meant very high oil prices for the rest of the world.
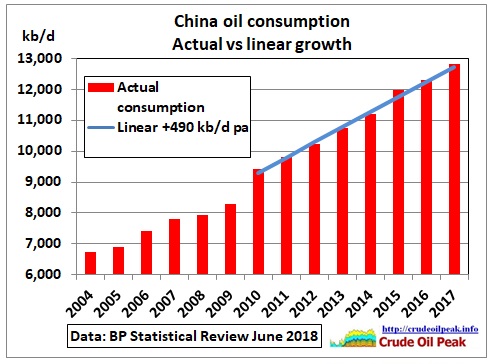 Fig 8: Actual consumption vs linear trend
The exceptional consumption growth in 2010 compensated for lower growth in the preceding years.
What impact had this on net oil imports?
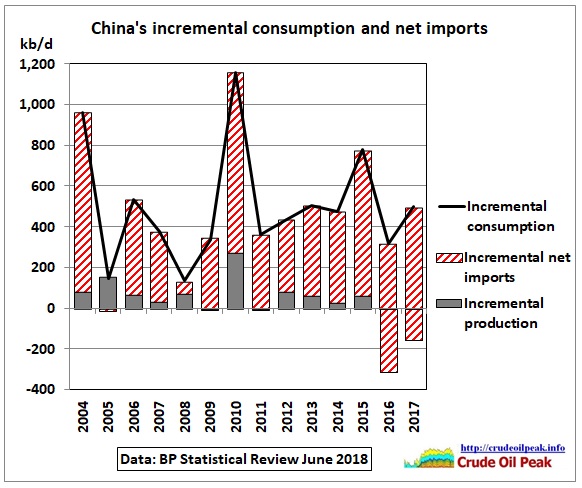 Fig 9: China’s incremental net imports
China’s crude oil production started to decline in 2016 so the columns no longer contain incremental production components (grey). If China wants to keep its current level of consumption growth it will have to increase net oil imports to offset decline.
The Federal Reserve Bank of San Francisco estimated China’s consumption 2015 in this August 2017 report “Forecasting China’s Role in World Oil Demand”
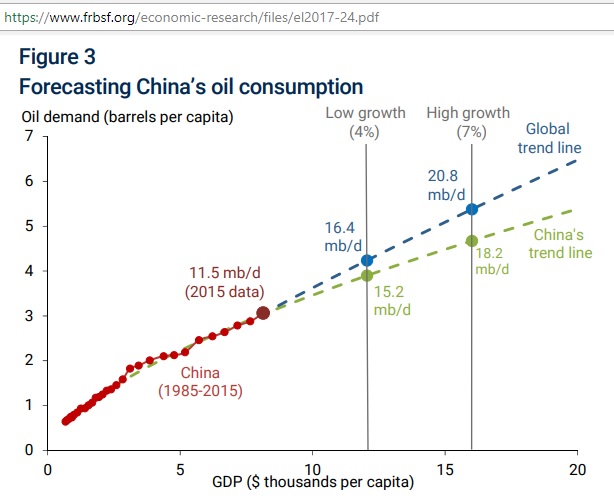 Fig 10: China oil consumption growth based on GDP per capita
https://www.frbsf.org/economic-research/files/el2017-24.pdf
The vertical lines represent the year 2025. On China’s trend line there would be following annual consumption growth:
Low GDP growth: +370 kb/d pa
High GDP growth: +670 kb/d pa
There will of course be limits to GDP growth.
Sizing Up China’s Debt Bubble: Bloomberg Economics
9/2/2018
In 2008, China’s total debt was about 141 percent of its gross domestic product. By mid-2017 that number had risen to 256 percent. Countries that take on such a large amount of debt in such a short period typically face a hard landing.
https://www.bloomberg.com/news/articles/2018-02-08/sizing-up-china-s-debt-bubble-bloomberg-economics
US, China announce newest round of tariffs as Trump’s trade war shows no sign of slowing down
9/8/2018
https://www.businessinsider.com.au/trump-tariffs-china-trade-war-chinese-goods-2018-8?r=US&IR=T
Australia is one country with its fortunes heavily dependent on what is happening in China. The media are nervously watching:
China’s economic growth slows to multi-decade lows across industrial, infrastructure and retail
14 June 2018
China’s economy appears to have hit a significant speed hump, with a number of key indicators across the industrial, construction and retail sectors slowing to either multi-year, multi-decade or record lows.
Fixed asset investment — a proxy for infrastructure spending — fell to 6.1 per cent growth in the first five months of the year, down from 7 per cent in April and below market forecasts.
It is the slowest pace of expansion since the National Bureau of Statistics started the series in 1996.
Industrial production slowed to a 22-year low, growing by 6.8 per cent over the year to May.
Retail sales also disappointed, tumbling from almost 10 per cent growth in April to 8.5 per cent in May, its slowest pace in around 15 years.
Although reduced, growth rates of 6.1% – 8.5% are still impressive. It remains to be seen how that will impact on oil demand.
Australia itself is in peak oil mode and needs increasing imports of oil:
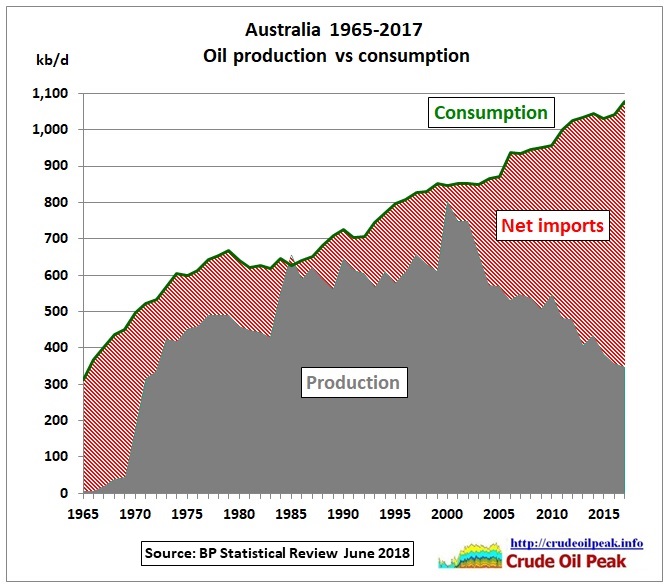 Fig 11: Australia’s increasing oil consumption vs production decline
Since 2004 Australia’s oil production declined by 40% or almost 3% pa while consumption increased by 25% or around 2% pa. As a result, net imports increased by a whopping 134% in this period or almost 10% pa. 3 local refineries have closed, causing fuel imports from Asia to skyrocket as shown in this post:
10/5/2018 Update on Australian oil import vulnerability May 2018
http://crudeoilpeak.info/update-on-australian-oil-import-vulnerability-may-2018
Any action by the Australian government? Oil import vulnerability is increased every day. New road tunnels are being built, a 2nd Sydney airport is planned and new oil consumers are imported by 100 Ks immigrants every year with population having reached 25 million last week, up from 20 million end 2003
Population clock
http://www.abs.gov.au/ausstats/abs@.nsf/0/1647509ef7e25faaca2568a900154b63?opendocument
The Australian government is in no hurry.
Liquid Fuel Security Review
The review will be completed by the end of 2018 and will contribute to a broader consideration of energy security across liquid fuel, electricity and gas supplies in the National Energy Security Assessment by mid-2019.
The assessment will also help inform Australia’s plan to return to compliance with the International Energy Agency’s emergency stockholding obligations by 2026.
This is a typical view:
4/11/2017
Former Prime Minister Howard assumes US shale oil will provide for China’s oil demand growth
http://crudeoilpeak.info/former-prime-minister-howard-assumes-us-shale-oil-will-provide-for-chinas-oil-demand-growth
Conclusion
Peak oil in China will change the world. We see the first signs but governments have not woken up yet to the competition for oil in the Asia Pacific region which is supposed to be the global growth engine
Previous post:
18/6/2018
Peak oil in Asia Pacific (part 1)
http://crudeoilpeak.info/peak-oil-in-asia-pacific-part-1