Feliz Navidad!
(1) Pre-Covid
..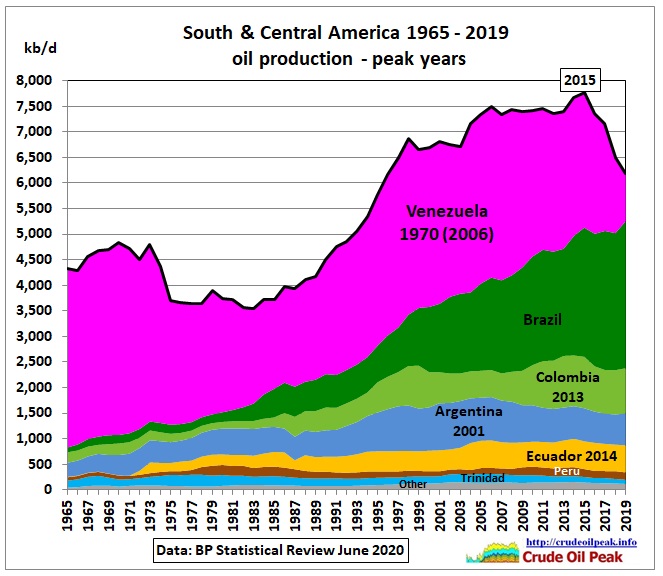 Fig 1: Oil production and peak years
Production peaked 2015 due to Venezuela’s production collapse. Brazil’s production has not yet peaked but is unlikely to offset Venezuela’s decline. All other countries together are on a bumpy production plateau for the last 20 years.
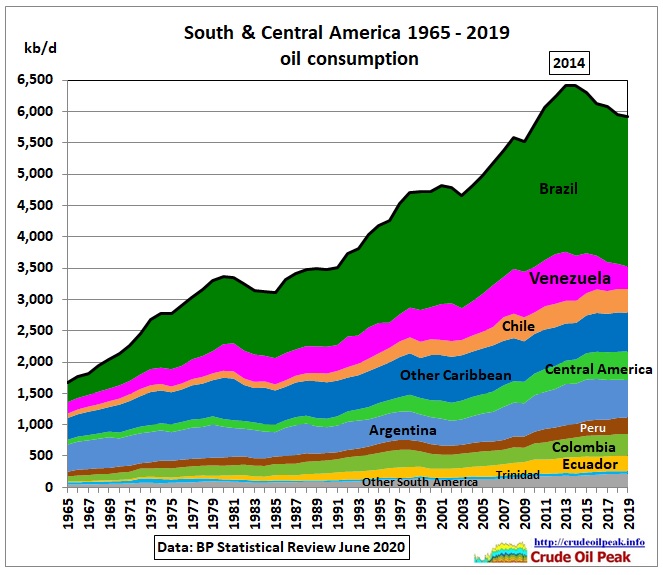 Fig 2: Oil consumption peaked 2014
Production vs. consumption
Sorted by net exports (difference between production and consumption)
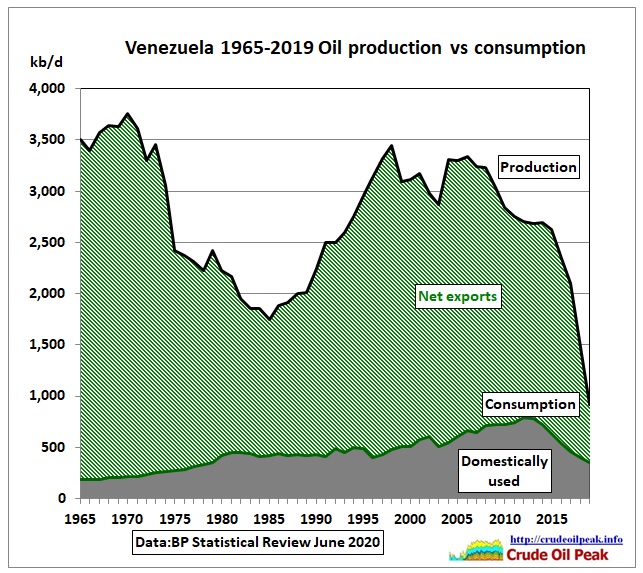 Fig 3: Venezuela last peak was in 2006, since then net exports are down to 560 kb/d
The US imposed sanctions on Venezuela since 2006 but the oil sector was most hit by E.O. 13808 (Aug 2017) and 13850 (Jan 2019) in which PdVSA properties under US jurisdiction were blocked and transactions prohibited. https://fas.org/sgp/crs/row/IF10715.pdf
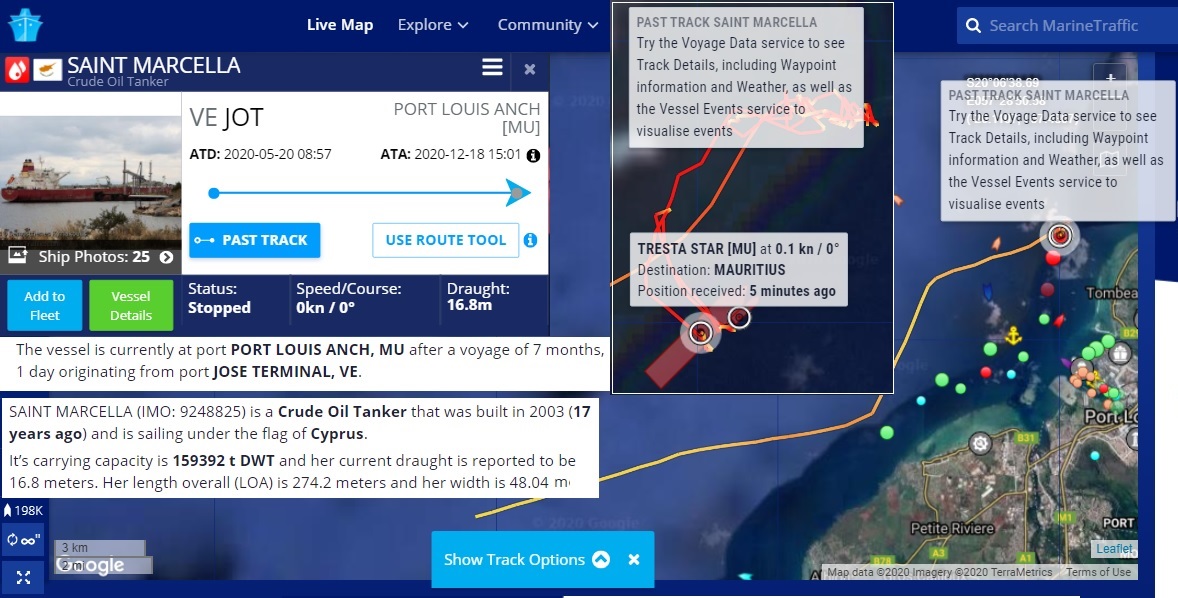 Fig 4: Venezuela’s oil passing through the Indian Ocean?
7 months after leaving the JOSE terminal in Venezuela, crude oil tanker SAINT MARCELLA appeared at anchorage outside PORT LOUIS Mauritius, for servicing/rebunkering by TRESTA STAR. The destination shown by Vesselfinder was S.LINGGI in Malaysia (Straits of Malacca)
This Reuters article reports:
27 Nov 2020
Exclusive: Venezuela resumes direct oil shipments to China despite U.S. sanctions
Venezuela has resumed direct shipments of oil to China after U.S. sanctions sent the trade underground for more than a year, according to Refinitiv Eikon vessel-tracking data and internal documents from state company Petroleos de Venezuela (PDVSA).
Chinese state companies China National Petroleum Corp (CNPC) and its listed subsidiary PetroChina – long among PDVSA’s top customers – stopped loading crude and fuel at Venezuelan ports in August 2019 after Washington extended its sanctions on PDVSA to include any companies trading with the Venezuelan state firm.
The imposition of the sanctions was part of a push by the Trump administration to oust Venezuelan President Nicolas Maduro, but they failed to completely halt the South American nation’s oil exports or to loosen Maduro’s grip on power.
PDVSA’s customers instead boosted shipments to Malaysia, where transfers of cargoes between vessels at sea have allowed most of Venezuela’s crude to continue flowing to China after changing hands and using trade intermediaries.
The direct shipments come ahead of January’s transition of power in the United States from Republican President Donald Trump to Democratic President-elect Joe Biden, whose advisers have said he would retain sanctions but shift the focus of U.S. strategy.
https://www.reuters.com/article/us-venezuela-oil-china-exclusive-idUSKBN28703I
The Venezuelan government sits on $19 bn debt it owes to China. This debt is supposed to be paid off by oil shipments (oil-for-loan). A grace period for $3bn runs out in December 2020, according to this Reuters article:
Exclusive: Venezuela wins grace period on China oil-for-loan deals, sources say
13 Aug 2020
https://www.reuters.com/article/us-venezuela-china-exclusive-idUSKCN2581UN
After this short excursion into geopolitical oil debt games we continue to look at other S&C America countries:
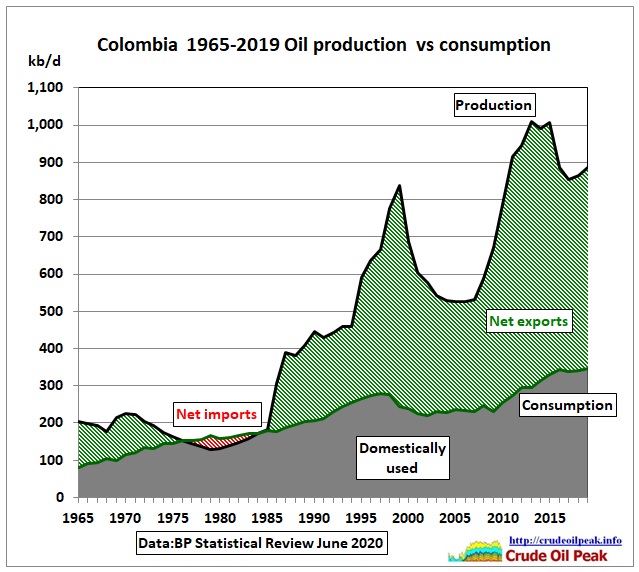 Fig 5: Colombia net exports 540 kb/d
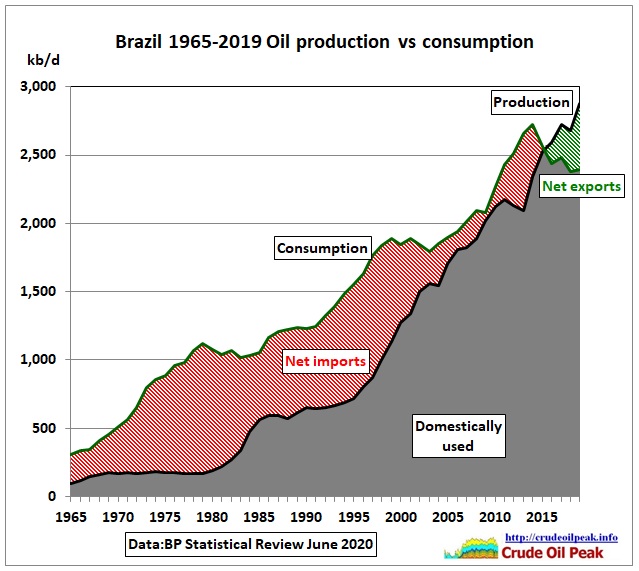 Fig 6: Brazil: net exports 480 kb/d
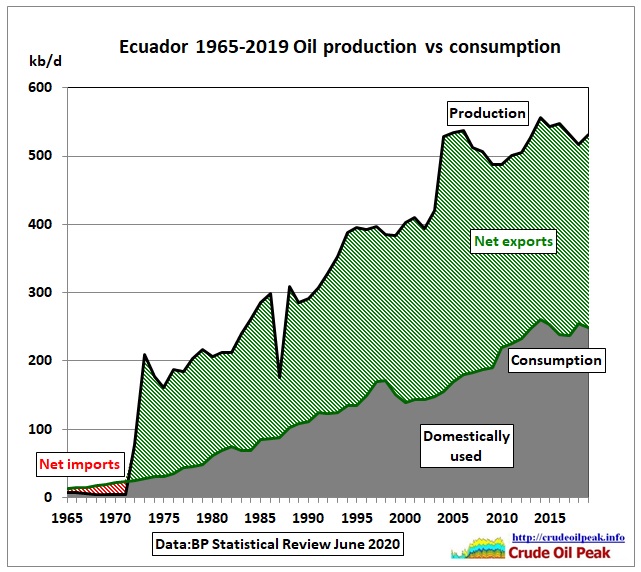 Fig 7: Ecuador 280 kb/d next exports
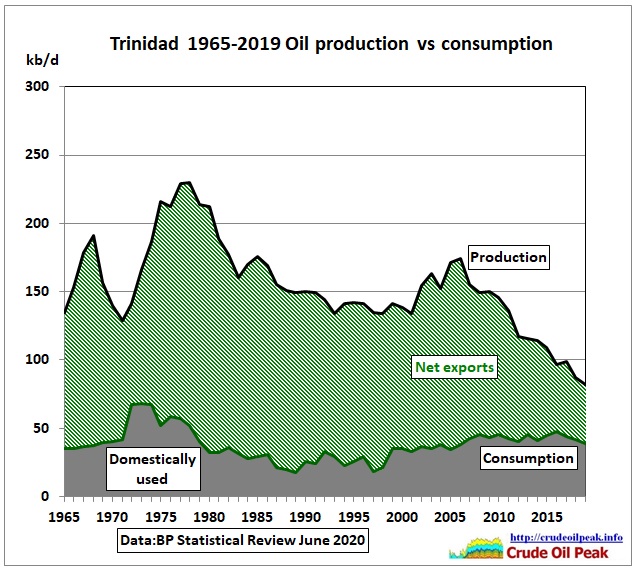 Fig 8: Trinidad & Tobago net exports 40 kb/d
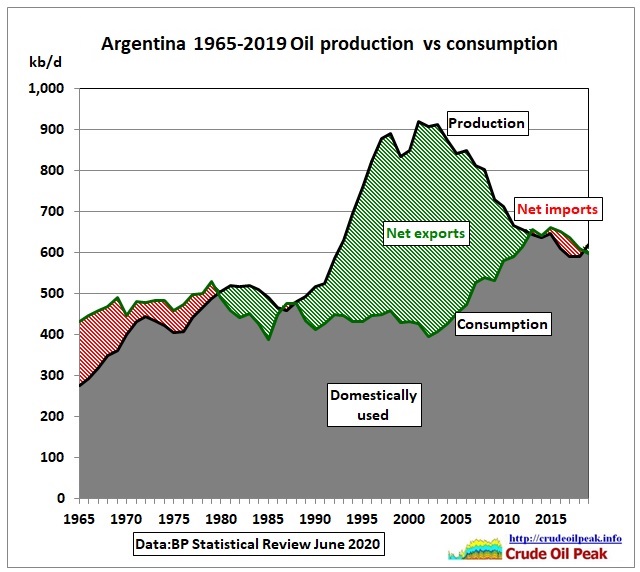 Fig 9: Argentina net importer
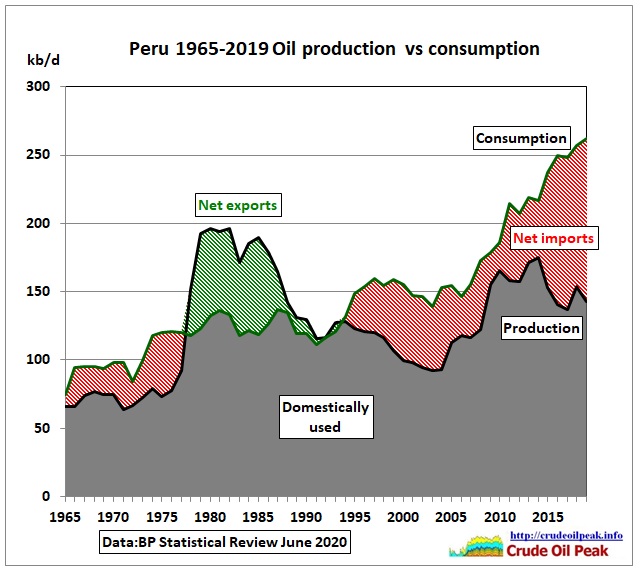 Fig 10: Peru net imports 120 kb/d
All together now
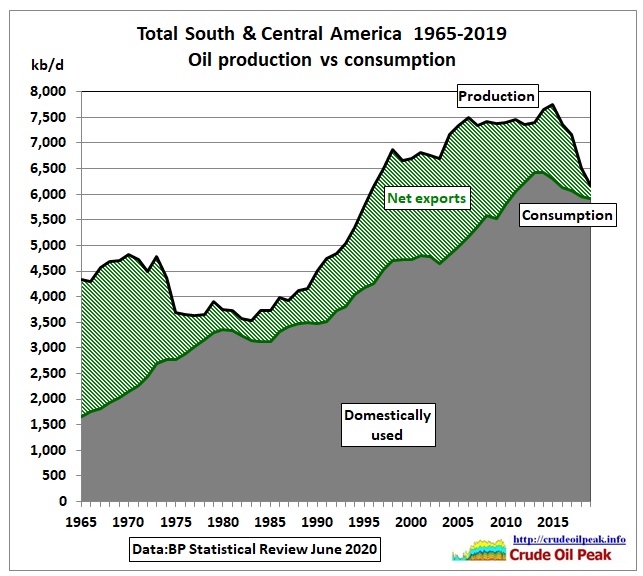 Fig 11: Oil production has come down to approach consumption
Latin America
Although statistically the EIA and the IEA count Mexico under “North America” Mexico is part of Latin America and needs to be mentioned here.
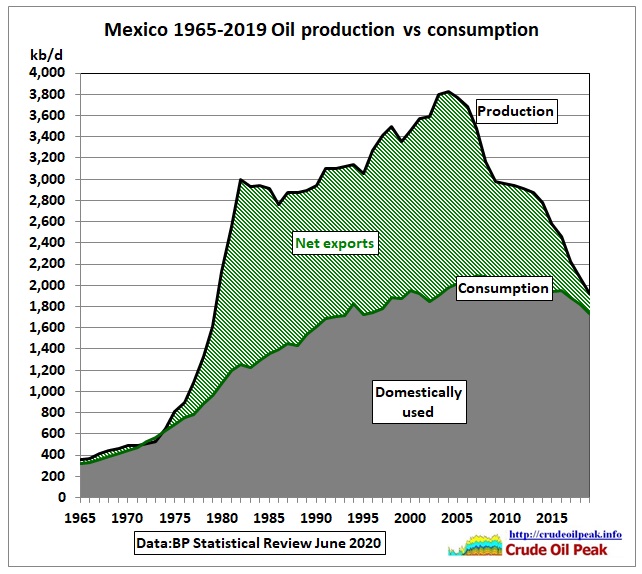 Fig 12: Mexico peaked in 2004
(2) Including 2020 Covid year
Using EIA data form the International Energy Statistics
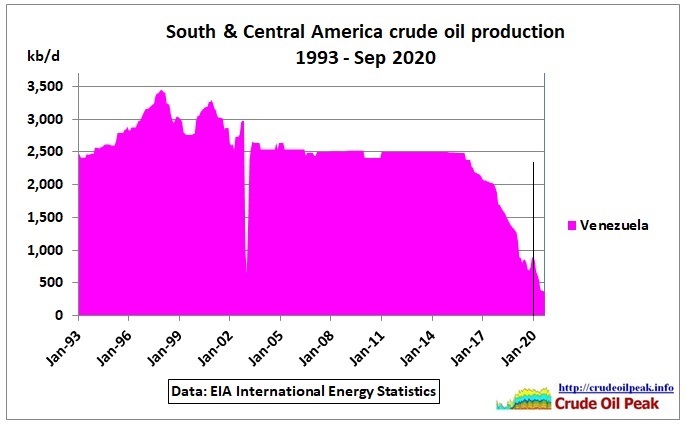 Fig 13: Venezuela’s downward trend since Jan 2016 continued in 2020
It is not clear why the EIA reported practically flat crude production at 2.5 mb/d after the 2003 strike until end 2015. Conventional crude production has actually peaked and the extra heavy Orinoco oil is not easy to produce. It needs blending with light oil or (imported) Naphta so it can be pumped through pipelines.
26/5/2018 Peak oil in Venezuela: El Furrial field (1998-2011)
http://crudeoilpeak.info/peak-oil-in-venezuela-el-furrial-oil-field
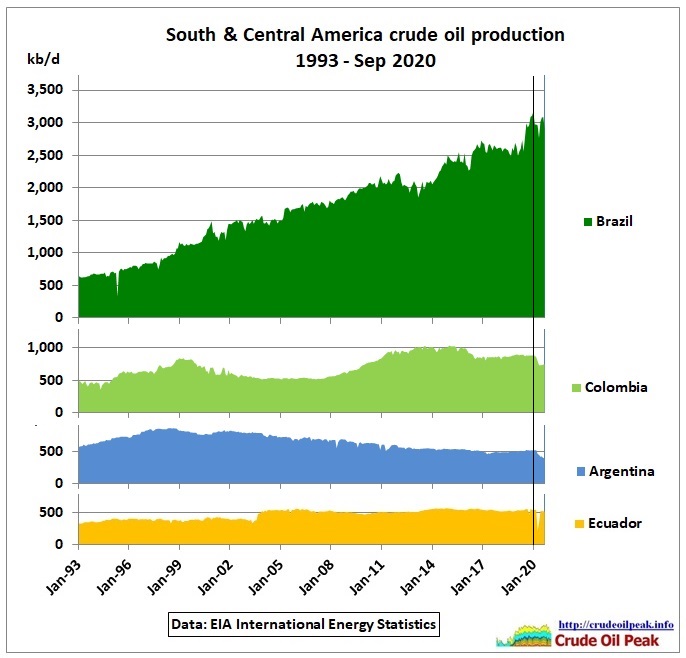 Fig 14: Covid 19 disturbed oil production in all countries
COVID 19 in Brazil : Impacts and Policy Responses
June 2020
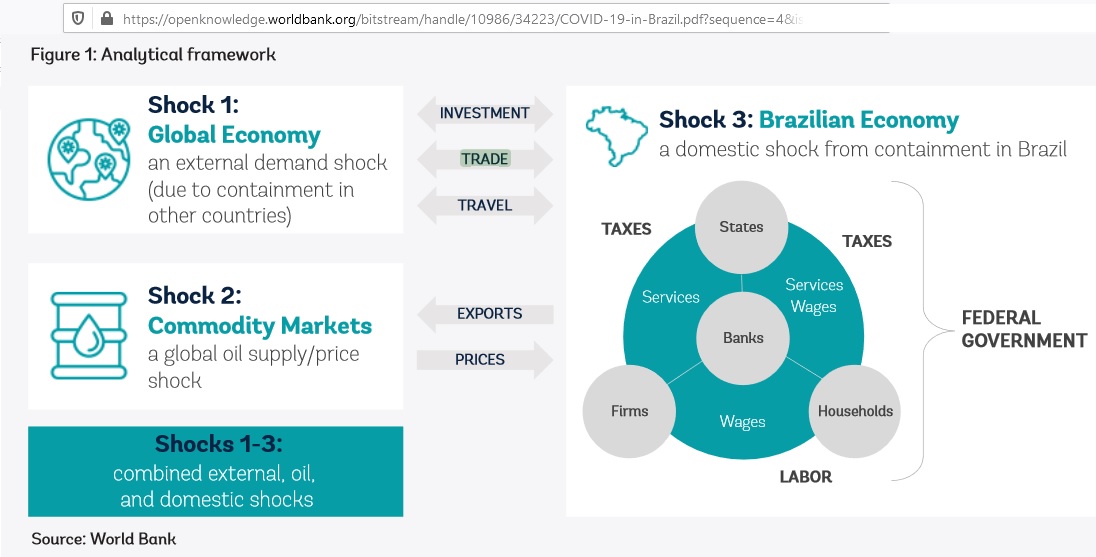 Fig 15: 3 shocks: Global economy, commodity markets, Brazilian economy
“In the energy sector, oil producers such as Petrobras have been strongly hit by the oil shock, with impacts on finances, jobs, and royalties paid to states. While consumers—including households, industry, transport and others—might, in principle, benefit from lower oil prices, pass-through tends to be low, not least due to administered prices, which reduce the net benefit of lower oil prices for consumers.”
https://openknowledge.worldbank.org/handle/10986/34223
Coronavirus tips Brazil into recession
1 Sep 2020
Brazil’s economy has officially entered a recession following the swingeing impact of the coronavirus crisis, which has so far killed more than 120,000 Brazilians and pushed millions into unemployment.
The economy contracted a record 9.7% as shutdowns took toll, but analysts believe the worst is over
https://www.ft.com/content/dc045f17-c90b-4098-bda1-4f7471699070
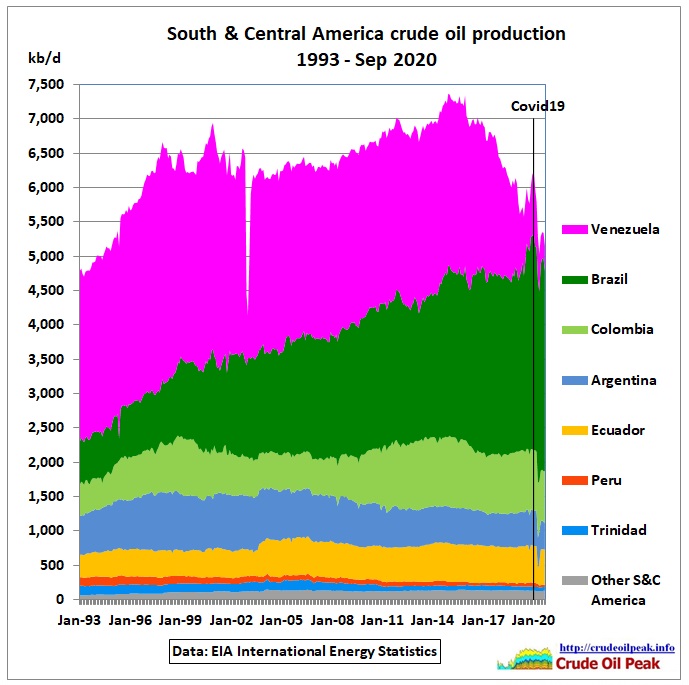 Fig 16: All S&C America countries stacked
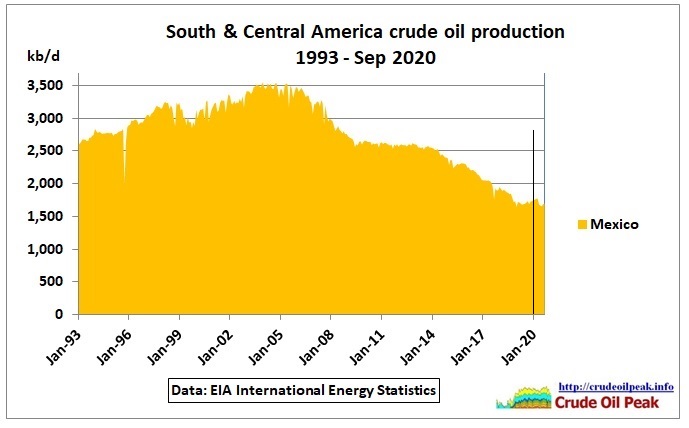 Fig 17: Mexico crude oil production
22 Sep 2020
In April, Mexico’s national oil company (NOC) Pemex reported USD 24 billion in quarterly losses. This dramatically accelerates the company’s pre-coronavirus trajectory: Pemex recorded a net loss of USD 18 billion for all of 2019 (equivalent to about 25 percent of its sales volume for the year). As April went on, COVID-19 cases started soaring across the country. Despite initial mixed messages, the government instituted a lockdown that lasted until mid-June.
https://resourcegovernance.org/blog/pandemic-pemex-mexico-energy-transition
(3) Net imports/exports
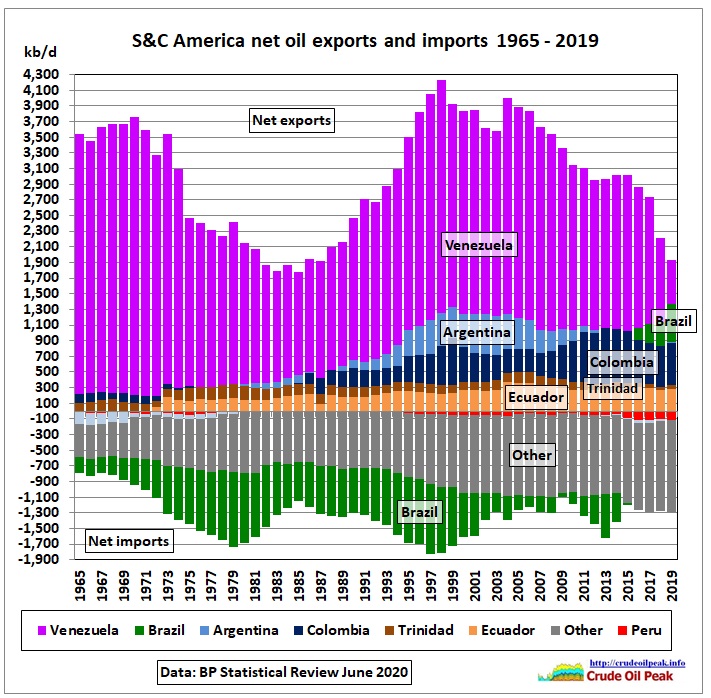 Fig 18: Net exports and imports
Net exports and imports have been calculated as the difference between oil production and consumption. Exports have halved in the last 20 years, mainly due to Venezuela’s decline. Argentina’s exports are gone. While imports from non-oil producing countries have increased. The only country against these trends is Brazil where imports have turned into recent exports.
What is Venezuela’s pain is Brazil’s gain:
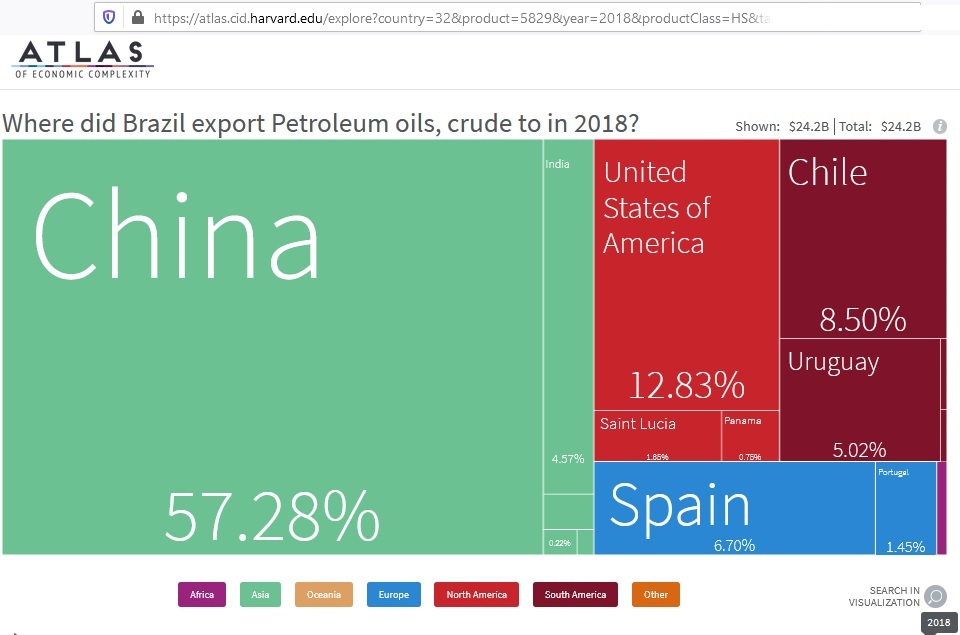 Fig 19: Brazil oil exports by destination 2018
Conclusion:
While China counts the cost of its Venezuelan investment adventure in one of the United States’ backyards it makes up for it by sucking up Brazil’s oil exports.
Addendum – oil reserve history
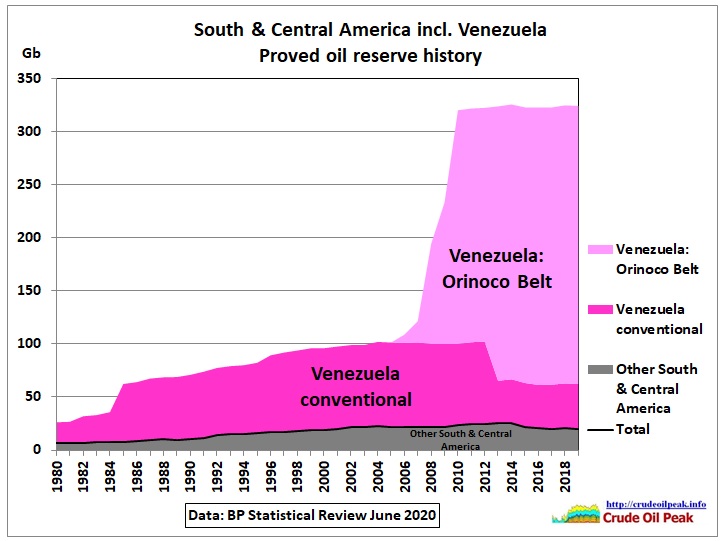 Fig 20: Oil reserve history all S&C America countries
Oil reserves are dominated by Venezuela and in particular the extra heavy oil of the Orinoco Belt.
 Fig 21: Chavez mostrando crudo extrapesado
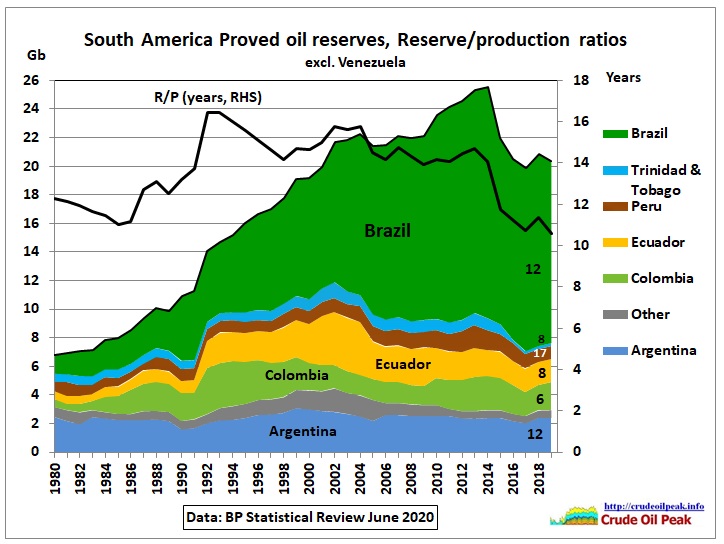
Fig 22: Oil reserve history in the rest of S&C America
The 2nd largest reserves are in Brazil but the R/P ratio is only 12 years. There was a peak in 2014.
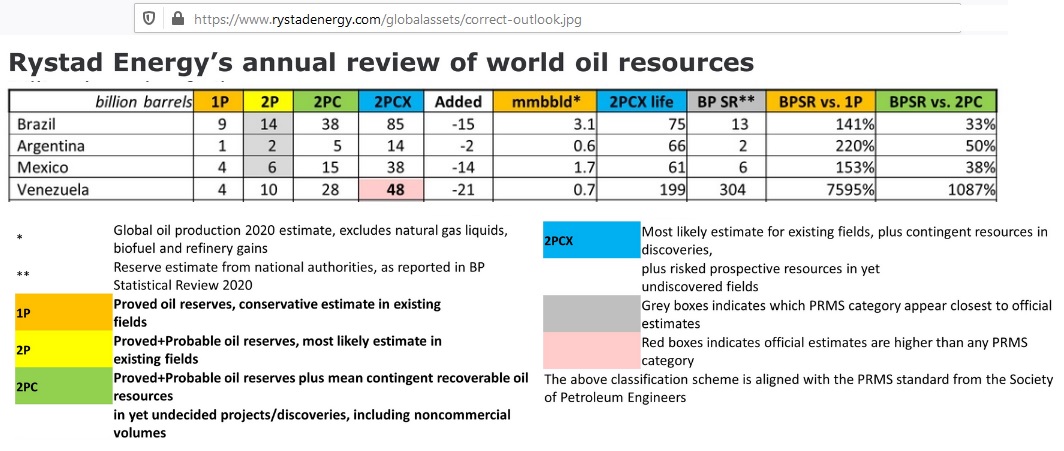 Fig 24: Rystad’s review of oil reserves/resources in the BP Statistical Review
The columns 1P – 2PCX are estimates by Rystad. The BP Statistical Review should show only 1P (proved) reserves but they are actually 2P (proved and probable) data (see grey boxes for Brazil, Argentina and Mexico). Usually resources are upgraded to 2P reserves so that the R/P ratio is around 10 years. But given the huge discrepancies in the above table it is not clear whether all 2PC – not to mention 2PCX – will ever be economically produced at current production rates. Note that Venezuela’s 2P reserves are given as 10 Gb, only 25% of conventional 1P reserves in the BP Statistical Review (Fig 20). So the uncertainties are considerable.