Categories
- Africa
- Algeria
- Angola
- Asia
- Australia
- Australia Budget
- Australia Transport
- Australian Mining
- Australian natural gas
- Australian rail
- Australian refineries
- Aviation
- BP
- BP Statistical Review
- Cars
- China
- Coal Seam Gas
- Crude oil analysis
- Debt
- Egypt
- Europe
- Feature1
- Global
- Hormuz
- India
- Iran
- Iraq
- Japan
- Korea
- Kuwait
- Latin America
- Libya
- Malaysia
- Middle East
- Motorways
- New South Wales
- North Sea
- OPEC
- Peaky Leaks
- Persian Gulf
- Power Supply
- Qatar
- Russia
- Saudi Arabia
- Shale gas
- Shell
- Shipping
- Singapore
- South East Asia
- Sudan
- Sydney
- Sydney Metros
- Syria
- Taiwan
- Tony Abbott Australian PM
- Ukraine
- United Arab Emirates
- United Kingdom
- United States
- Venezuela
- Vietnam
Sidebar menu
- Net oil importers
- Oil Exports
- Crude oil imports
- Downloads
- Latest Graphs
- Oil price analysis
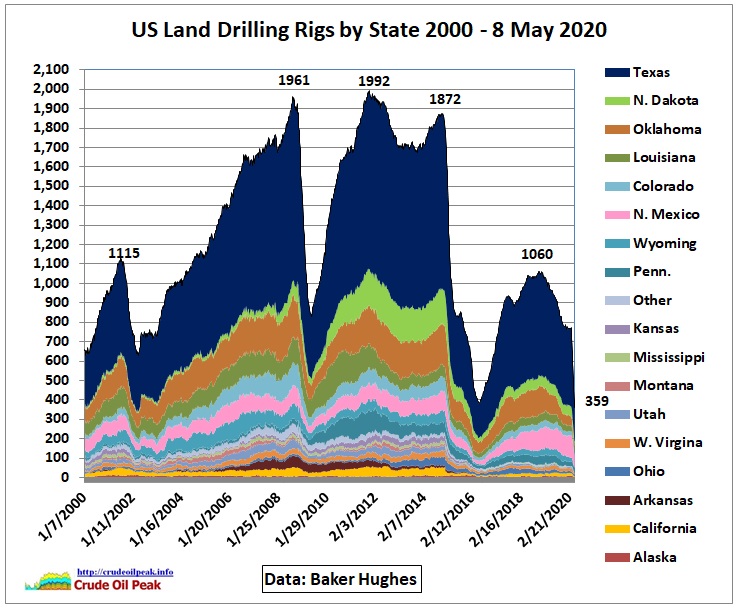 US drilling rig count
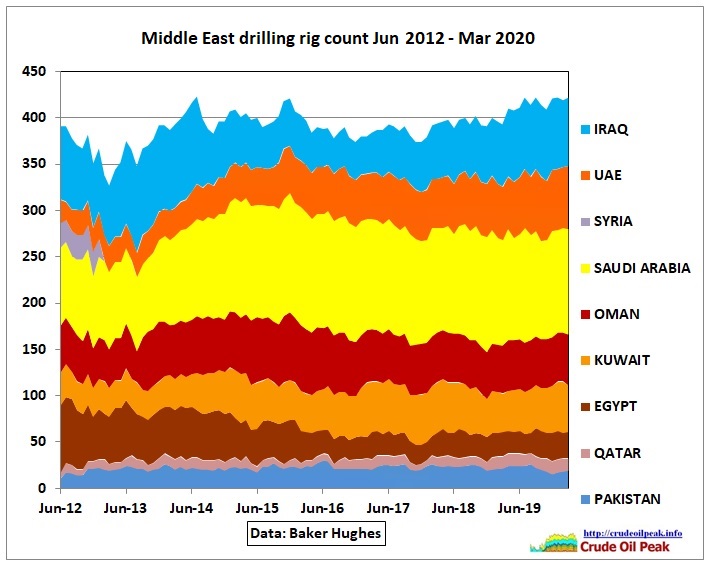 International drilling rig count
- Australian fuel prices
- Diary
- International oil companies
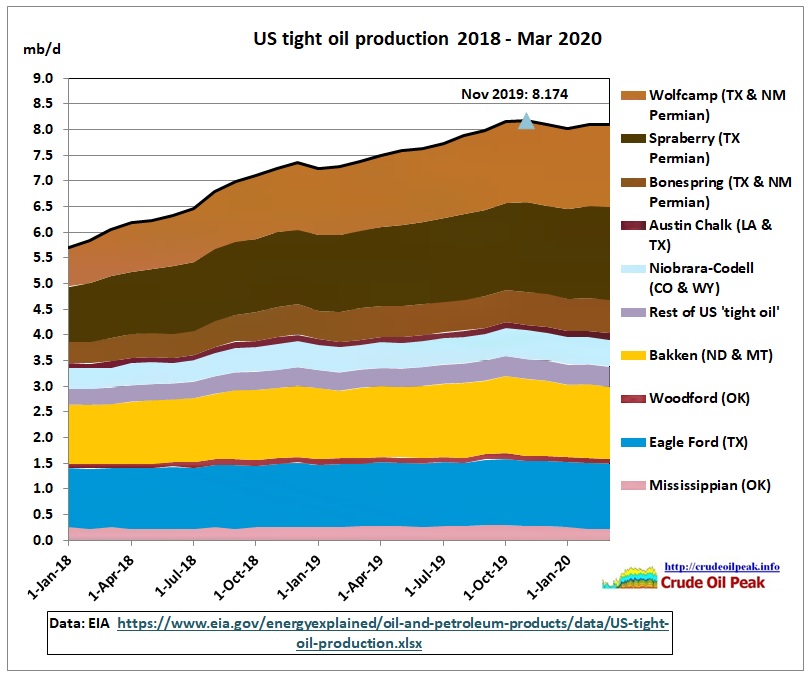 US tight oil production
 China peak oil
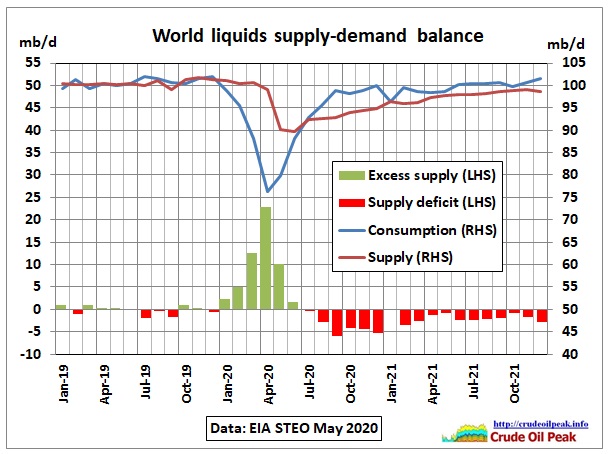 World liquids supply – demand balance
 Tankers arriving and departing in Sydney
 Australian oil and fuel imports
-
Canadian tar sands Archive
-
![This post is an update of a graph done in 2015: Fig 1: Conventional oil production on bumpy plateau 2005-2014 In http://crudeoilpeak.info/latest-graphs When adding the new data for 2015-2018 it […]](https://crudeoilpeak.info/wp-content/uploads/World_conv-crude_plateau_2005-2018-115x115.jpg "2005-2018 Conventional crude production on a bumpy plateau – with a little help from Iraq")
2005-2018 Conventional crude production on a bumpy plateau – with a little help from Iraq
Posted on August 26, 2019 | No CommentsThis post is an update of a graph done in 2015: Fig 1: Conventional oil production on bumpy plateau 2005-2014 In http://crudeoilpeak.info/latest-graphs When adding the new data for 2015-2018 it […] -
![In the year 2005, the global crude production curve shows a definitive kink, going horizontal for several years. This caused the 2008 oil price shock and the following financial crisis […]](https://crudeoilpeak.info/wp-content/uploads/World_crude_production_1994-Dec2018-115x115.jpg "World crude production outside US and Iraq is flat since 2005")
World crude production outside US and Iraq is flat since 2005
Posted on June 10, 2019 | No CommentsIn the year 2005, the global crude production curve shows a definitive kink, going horizontal for several years. This caused the 2008 oil price shock and the following financial crisis […] -
![The IEA (in Paris) proudly announced in its latest September 2018 Monthly Oil Market Report that global supplies (of liquids) have reached 100 mb/d in August, an impressive figure. What […]](https://crudeoilpeak.info/wp-content/uploads/World_crude_production_1994-May2018-1-115x115.jpg "What happened to crude oil production after the first peak in 2005?")
What happened to crude oil production after the first peak in 2005?
Posted on September 18, 2018 | No CommentsThe IEA (in Paris) proudly announced in its latest September 2018 Monthly Oil Market Report that global supplies (of liquids) have reached 100 mb/d in August, an impressive figure. What […] -
![OPEC Fig 1: OPEC’s incremental crude oil production Incremental production for each country is the production above the minimum production for the period Jan 2000 – May 2016 (the latest […]](https://crudeoilpeak.info/wp-content/uploads/World_Incremental_crude_production_2000-May2016-115x115.jpg "Incremental crude production update August 2016")
Incremental crude production update August 2016
Posted on September 11, 2016 | No CommentsOPEC Fig 1: OPEC’s incremental crude oil production Incremental production for each country is the production above the minimum production for the period Jan 2000 – May 2016 (the latest […] -
![In part 3 of this series on the impact of US tight oil, we look at US crude oil imports from Non-OPEC countries. Excluding Canada – which is a special […]](https://crudeoilpeak.info/wp-content/uploads/2014/12/US_crude_imports_Non_OPEC_1973_2013_excl-Canada-115x115.jpg "US crude imports from Non-OPEC countries peaked 10 years before tight oil boom")
US crude imports from Non-OPEC countries peaked 10 years before tight oil boom
Posted on December 2, 2014 | No CommentsIn part 3 of this series on the impact of US tight oil, we look at US crude oil imports from Non-OPEC countries. Excluding Canada – which is a special […] -
![Summary: Oil reserves as reported in the Statistical Review have experienced a phenomenal growth but are not all proven (1P) reserves as claimed. The reserve tables provided contain a mixture […]](https://crudeoilpeak.info/wp-content/uploads/2012/08/Chavez_heavy_oil-115x115.jpg "BP Statistical Review 2012 The incredible growth of oil(y) resources")
BP Statistical Review 2012 The incredible growth of oil(y) resources
Posted on August 12, 2012 | No CommentsSummary: Oil reserves as reported in the Statistical Review have experienced a phenomenal growth but are not all proven (1P) reserves as claimed. The reserve tables provided contain a mixture […]