OPEC
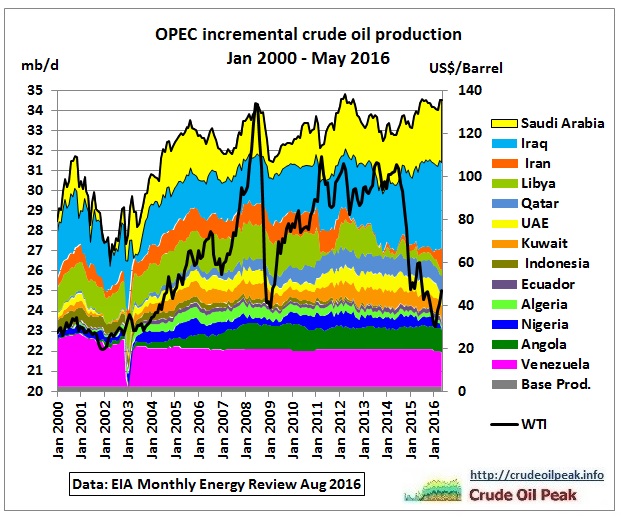
Fig 1: OPEC’s incremental crude oil production
Incremental production for each country is the production above the minimum production for the period Jan 2000 – May 2016 (the latest data available in August 2016). The sum of the minimum production is the base production.
OPEC oil production in 2016 is practically on the same level as in 2012, peak production just 1 mb/d higher than in 2005. Increasing production in Iraq only compensated losses in Libya (civil war) and Iran (sanctions). Now we see production drops in Venezuela (low oil prices) and Nigeria (Niger Delta conflict). OPEC suffers from continuously changing problems which do not seem to go away and reflect the fights for oil reserves which are less than generally assumed. In summary these conflicts limit production.
Venezuela
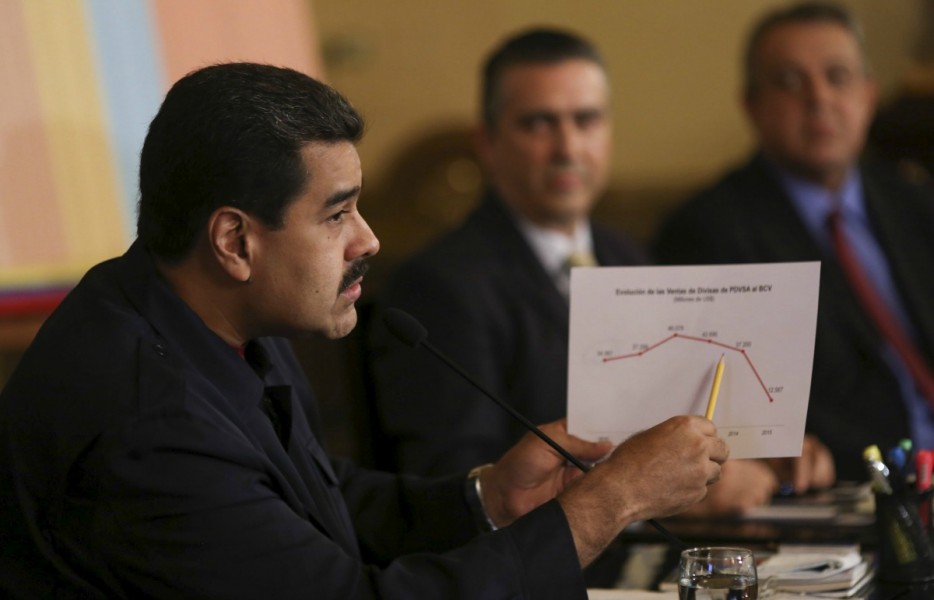
Fig 2: Presidente Maduro muestra caída de la producción petrolera
Can you imagine the Australian Prime Minister showing oil decline in his country? And the media informing the public about it?
Iraq
13 years after the Iraq war:
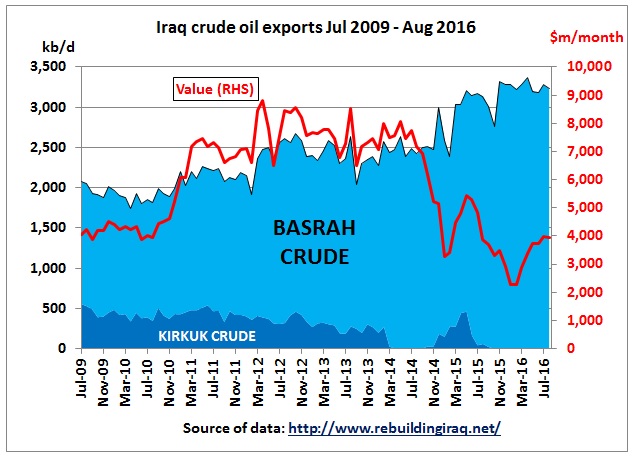
Fig 3: Iraq crude oil exports
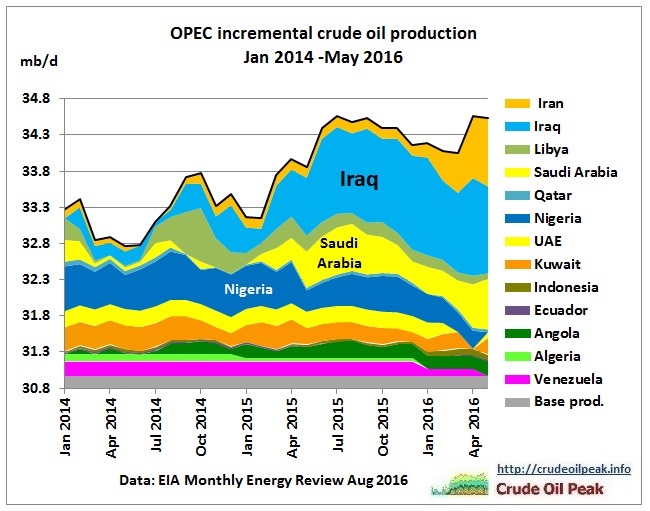
Fig 4: OPEC incremental crude production since Jan 2014
OPEC’s crude production increased by around 1 mb/d since the 2nd half of 2014, when oil prices dropped. Note that the increase mainly came from Iraq – mission only partially accomplished and 10 years too late. The recent surge was from Iran after the lifting of sanctions. Remember that during summer, Saudi Arabia needs more oil domestically to drive power plants for air conditioning.
Non-OPEC
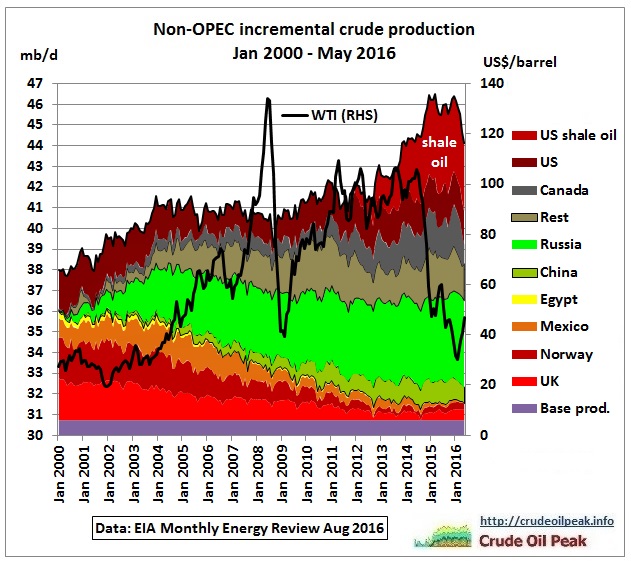
Fig 5: Non-OPEC’s incremental crude production
The decline in the North Sea and Mexico would have caused an oil crisis on its own. But Russia rescued Europe with oil not produced after the collapse of the Soviet Union.
United States
US tight oil production has peaked in 2015
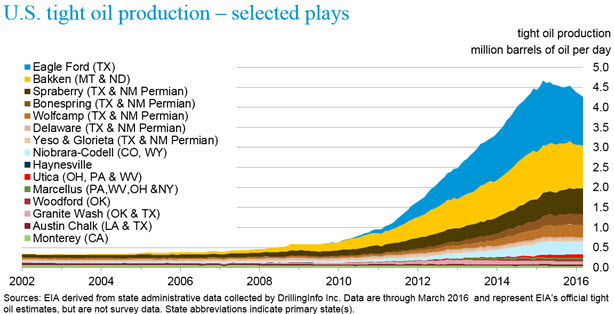
Fig 6: US tight oil production
10/8/2016 http://www.eia.gov/energy_in_brief/article/shale_in_the_united_states.cfm
Canada
Wild fires in Fort McMurray threatened Alberta tar sand production
6 May 2016
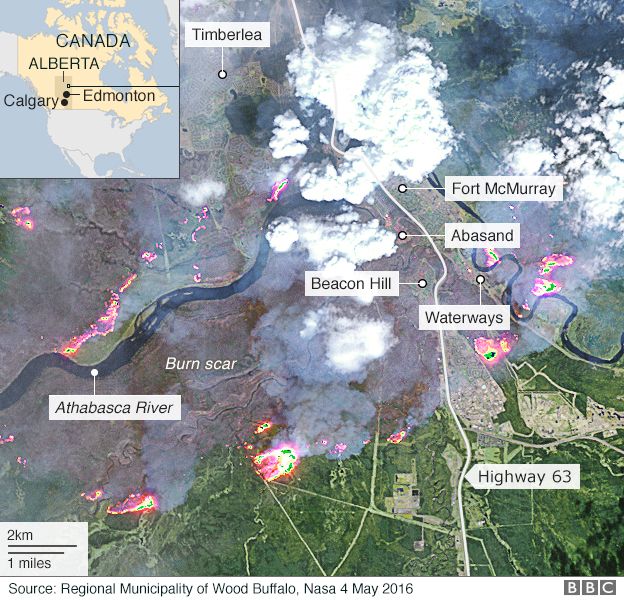
Fig 7: Revenge of Gaia: damage around Alberta’s tar sand area
http://www.bbc.com/news/world-us-canada-36224767
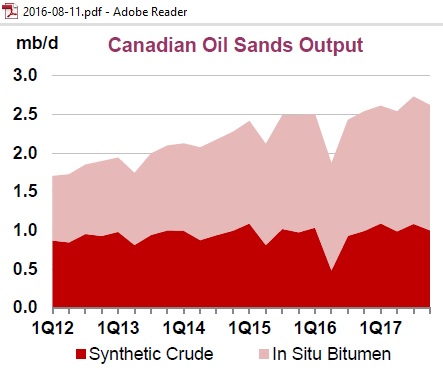
Fig 8: Production has come back to previous levels
North Sea
North Sea production has somehow stabilized but in the next 10 years a massive decommissioning job is ahead for UK oil infrastructure, according to Oil & Gas UK:
1,224 wells to be plugged
321 Topside modules to be removed (370 Kt)
79 platforms to be removed (150 Kt)
777 pipelines to be decommissioned (5,600 kms)
More details are in this report:
Decommissioning Insight 2015
The industry is forecast to spend a total of £16.9 billion over the next decade on the decommissioning of offshore oil and gas installations, wells, pipelines and other subsea infrastructure on the UK Continental Shelf.
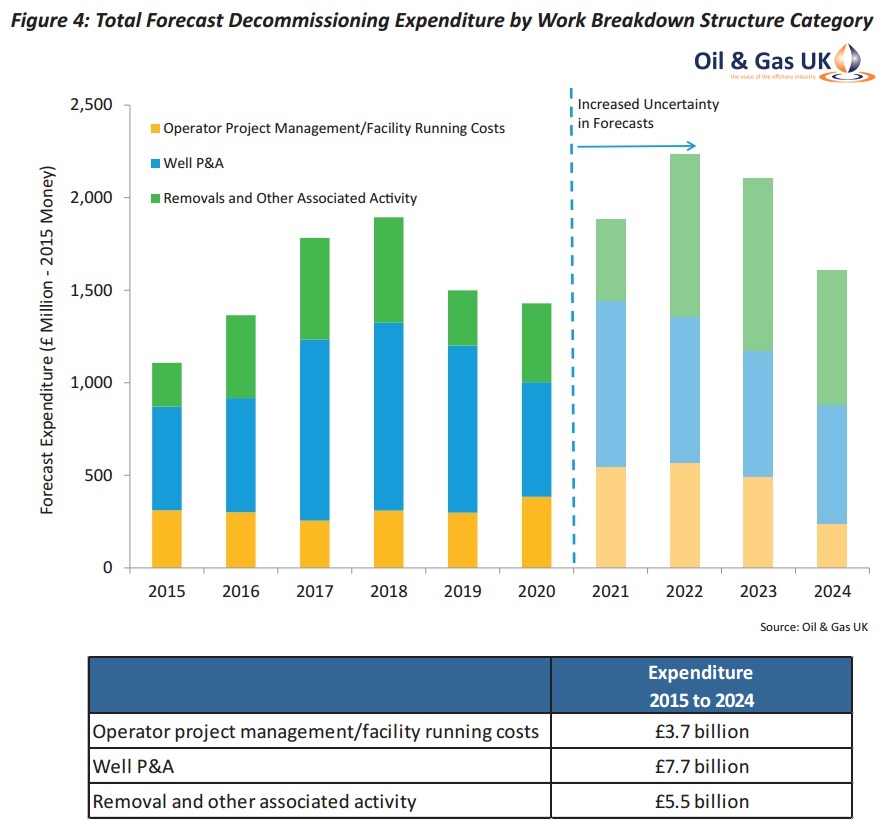
Fig 9: UK decommissioning expenditure
Similarly, Norway needs to do the same:
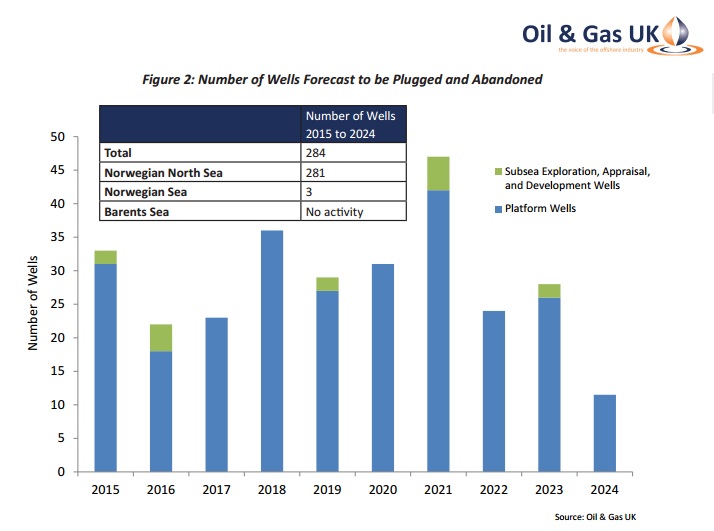
Fig 10: Plugging of wells in Norway
China
The Wall Street Journal reported:
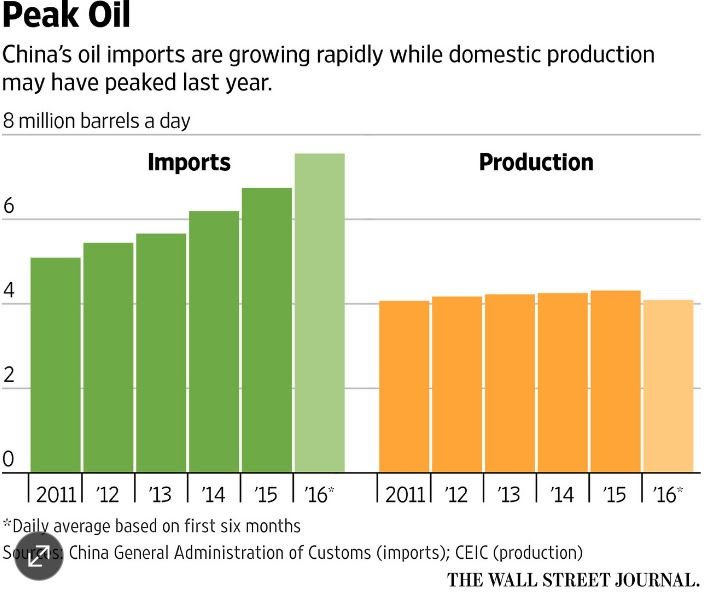
Fig 11: Peak oil in China
China’s Decline in Oil Production Echoes Globally
http://www.wsj.com/articles/chinas-decline-in-oil-production-echoes-globally-1472122393
Does it also echo in Australian State and Federal governments?
Russia
In the short-term the IEA forecasts flat production
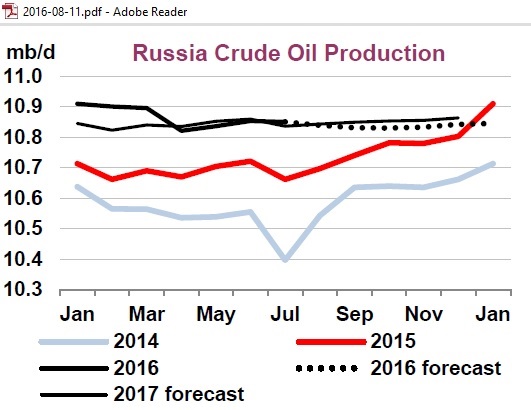
Fig 12: Russia crude oil production 2014 – 2017 forecast
But for the long-term the Russian channel RT reported earlier in the year:
Russia may be running out of oil
9/3/2016
Oil production in Russia will inevitably decline by 2035 according to an Energy Ministry report seen by the Vedomosti business daily. The different scenarios predict an output drop from 1.2 percent up to 46 percent two decades from now.
In the best case for oil producers, short-term growth remains possible only until 2020, according to the report. After that, production will contract. The figures vary from 1.2 percent to 46 percent, depending on prices, taxation and whether or not anti-Russian sanctions will be in force.
To counter the decline in oil production, the Energy Ministry proposes giving private companies access to the Arctic shelf, to soften the tax regime and support for small and medium-sized independent companies.
The Ministry also suggests promoting the processing of high-sulfur and super viscous heavy oil with the introduction of preferential rates of excise duties on fuel produced from such oil.
https://www.rt.com/business/334970-russia-oil-reserves-depletion-2035/
Rest
EIA data used to come from the International Energy Statistics
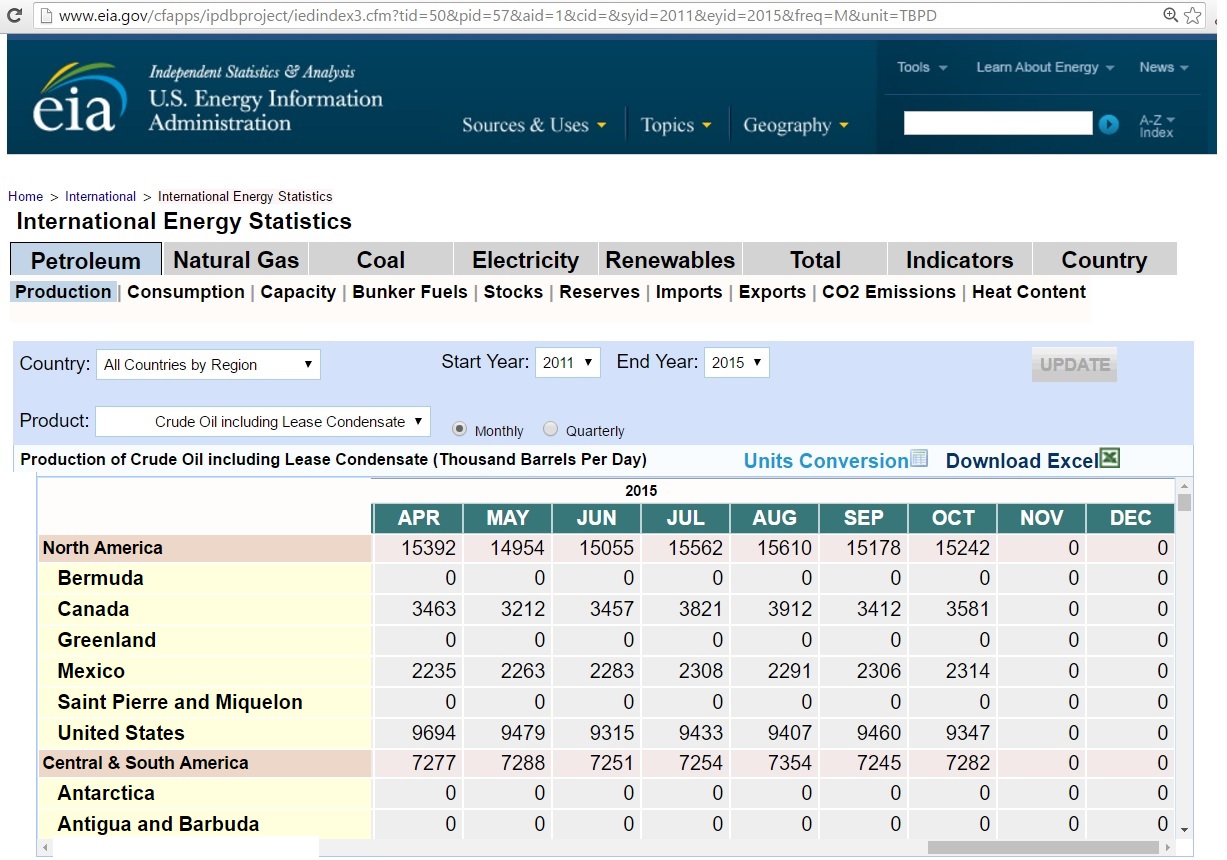
Fig 13 EIA website captured on 2/9/2016
No more. It stopped updating in October 2015. We had this before:
1/5/2011 EIA terminates updates of International Energy Statistics
http://crudeoilpeak.info/eia-terminates-updates-to-international-energy-statistics
Data are now in table 11 in the Monthly Energy Review (MER)
http://www.eia.gov/totalenergy/data/monthly/#international
The problem now is that for around 12 mb/d the MER does not show any country specific data. The following graph shows this:
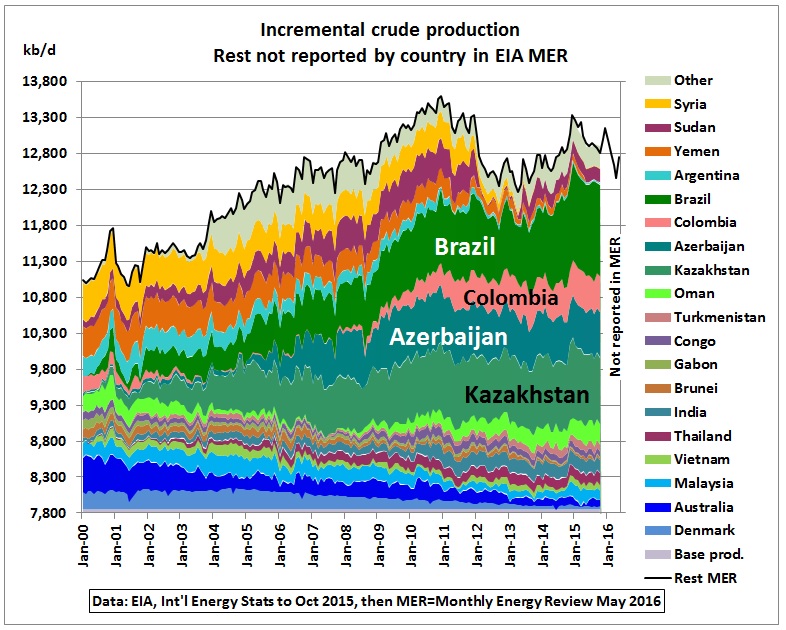
Fig 14: Rest of countries from Fig 4
We see that very important suppliers like Brazil, Colombia, Azerbaijan and Kazakhstan are no longer reported separately in the MER. Even India and many Asian countries are in this group.
The graph also shows that the 1st peak resulted from civil wars in Syria, Yemen and Sudan. A recent rebound came from Brazil. It remains to be seen how long pre-salt production can grow at current oil prices. In any event, Brazil is a net importer of oil:
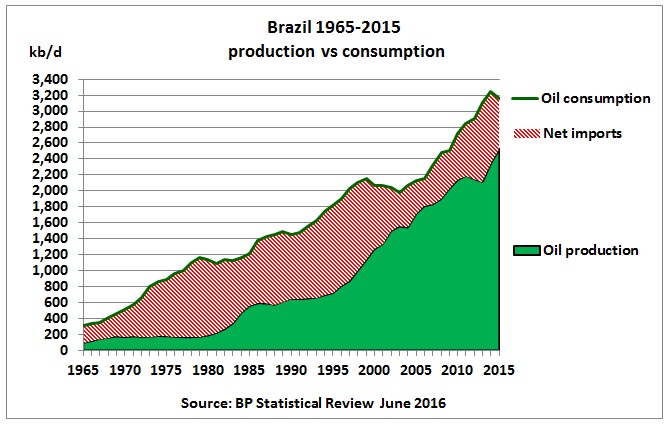
Fig 15: Brazil oil production and consumption
Therefore, on a net basis, the world would only see Brazil’s oil if production were to exceed consumption.
All together now
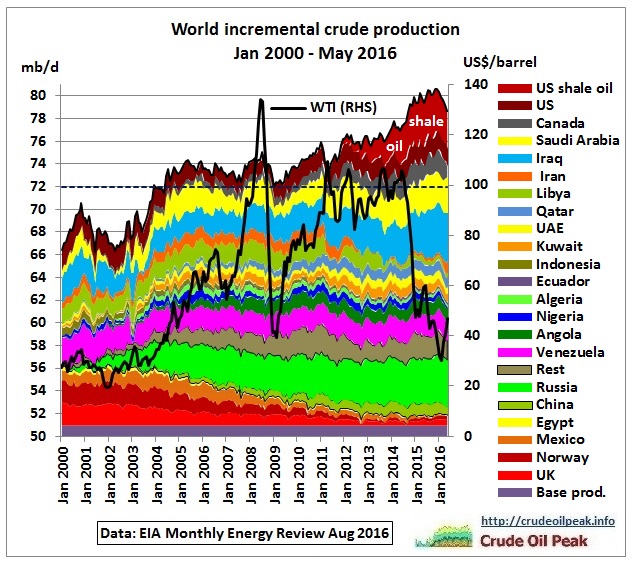
Fig 16: Incremental crude production for both OPEC and Non-OPEC
The stacking order in Fig 16 is: declining North Sea and Mexico, growing Russia, rest at peak, OPEC and on top Canada and the US. The dashed horizontal line is the 2005 production level outside Canada and the US.
Conclusion:
The world outside the US and Canada does not produce much more crude oil than in 2005 The growth came from unconventional oil. There is no evidence to suggest that OPEC is flooding the world market.
Comment
Art Berman commented that there is now a Beta version (for public testing and comment) of EIA’s new International Energy Statistics browser available here:
http://www.eia.gov/beta/international/
The complete web link to crude oil data is too unwieldy to publish here, but this is the latest graph of the group “Rest”, until Mar 2016
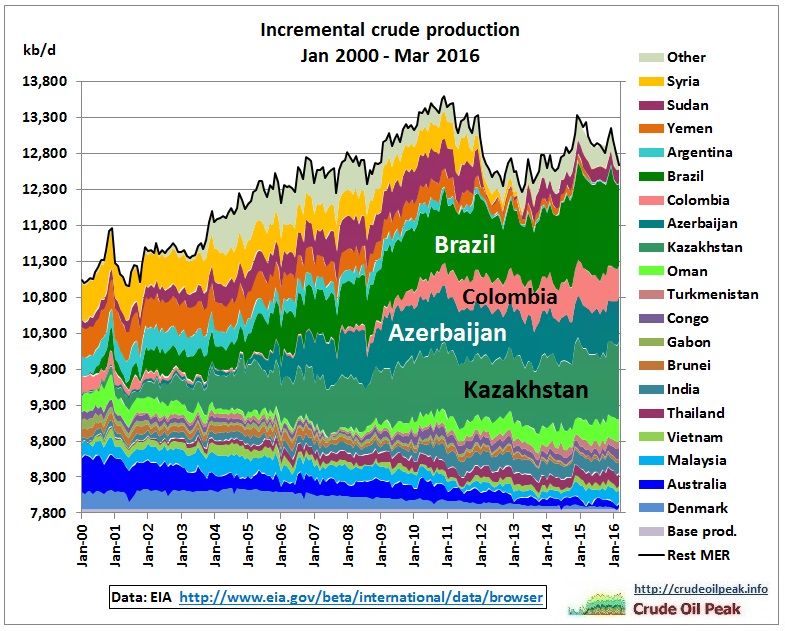
Fig 14a: Rest of countries until March 2016