Categories
- Africa
- Algeria
- Angola
- Asia
- Australia
- Australia Budget
- Australia Transport
- Australian Mining
- Australian natural gas
- Australian rail
- Australian refineries
- Aviation
- BP
- BP Statistical Review
- Cars
- China
- Coal Seam Gas
- Crude oil analysis
- Debt
- Egypt
- Europe
- Feature1
- Global
- Hormuz
- India
- Iran
- Iraq
- Japan
- Korea
- Kuwait
- Latin America
- Libya
- Malaysia
- Middle East
- Motorways
- New South Wales
- North Sea
- OPEC
- Peaky Leaks
- Persian Gulf
- Power Supply
- Qatar
- Red Sea
- Russia
- Saudi Arabia
- Shale gas
- Shell
- Shipping
- Singapore
- South East Asia
- Sudan
- Sydney
- Sydney Metros
- Syria
- Taiwan
- Tony Abbott Australian PM
- Ukraine
- United Arab Emirates
- United Kingdom
- United States
- Venezuela
- Vietnam
Sidebar menu
- Net oil importers
- Oil Exports
- Crude oil imports
- Downloads
- Latest Graphs
- Oil price analysis
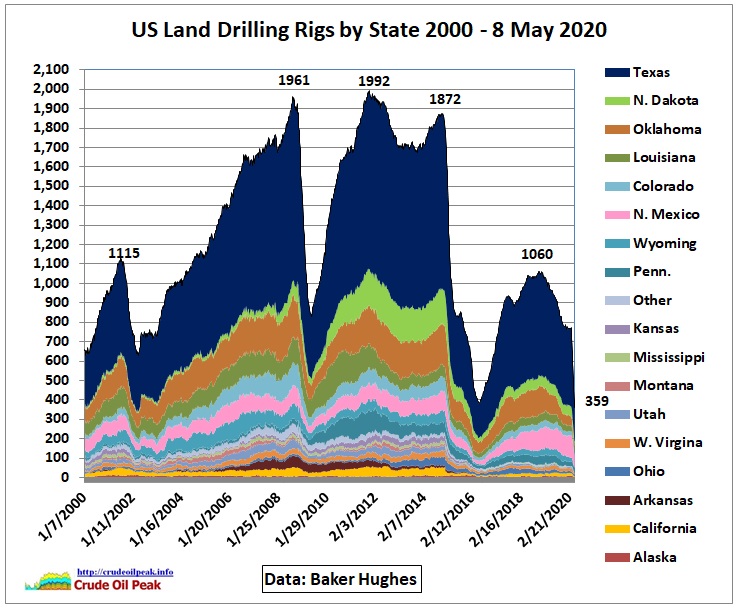 US drilling rig count
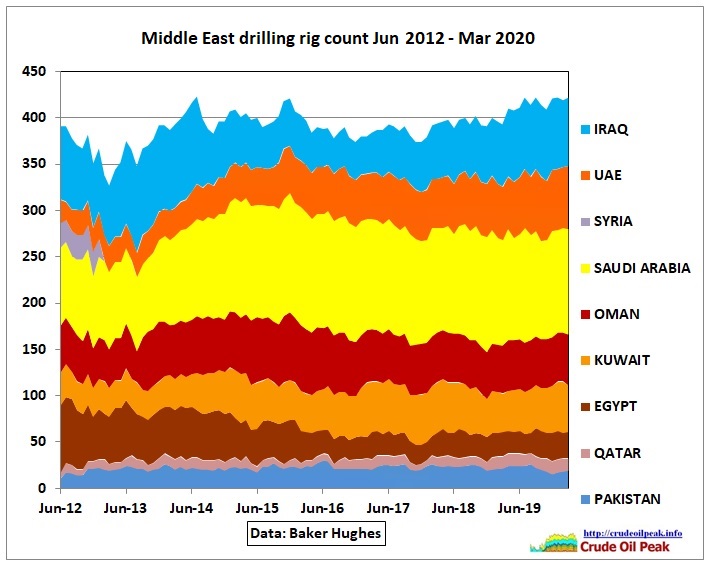 International drilling rig count
- Australian fuel prices
- Diary
- International oil companies
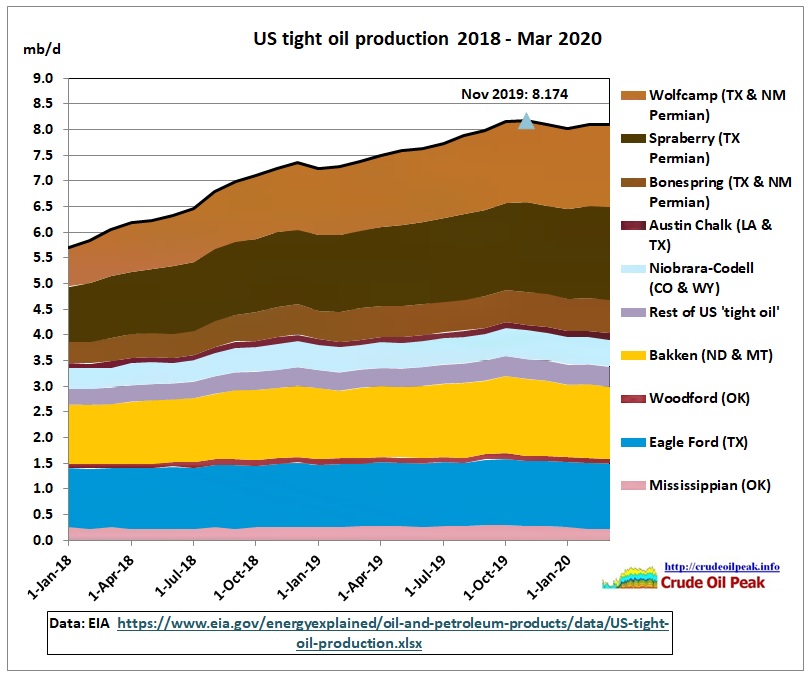 US tight oil production
 China peak oil
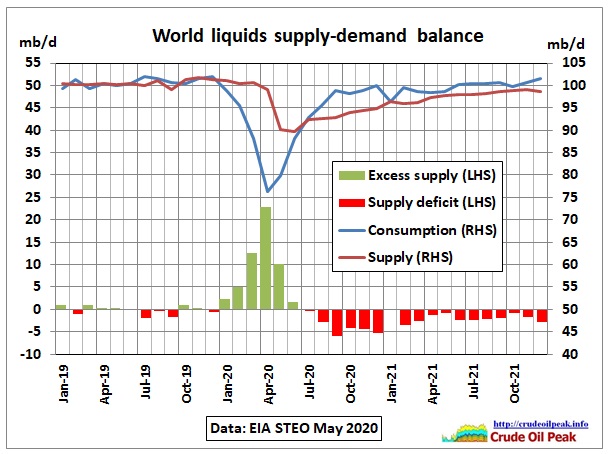 World liquids supply – demand balance
 Tankers arriving and departing in Sydney
 Australian oil and fuel imports
-
Incremental crude oil graphs Archive
-
![OPEC Fig 1: OPEC’s incremental crude oil production Incremental production for each country is the production above the minimum production for the period Jan 2000 – May 2016 (the latest […]](https://crudeoilpeak.info/wp-content/uploads/World_Incremental_crude_production_2000-May2016-115x115.jpg "Incremental crude production update August 2016")
Incremental crude production update August 2016
Posted on September 11, 2016 | No CommentsOPEC Fig 1: OPEC’s incremental crude oil production Incremental production for each country is the production above the minimum production for the period Jan 2000 – May 2016 (the latest […] -
![Currently lower oil prices due to a combination of increasing oil supplies and subdued demand come at a high cost to the environment and the climate. Additional oil supplies are […]](https://crudeoilpeak.info/wp-content/uploads/2014/12/Incremental_crude_world_US_shale_oil_Canada_tar_sands_on_top_2001_Aug2014-115x115.jpg "World on drip of unconventional oil")
World on drip of unconventional oil
Posted on December 11, 2014 | No CommentsCurrently lower oil prices due to a combination of increasing oil supplies and subdued demand come at a high cost to the environment and the climate. Additional oil supplies are […] -
![We use the period starting with January 2010 when crude production had come back to 2005 levels after the exceptional year of 2009 Fig 1: US crude oil vs crude […]](https://crudeoilpeak.info/wp-content/uploads/2014/09/US_crude_oil_growth_vs_rest_of_world_Jan_2010_May2014-115x115.jpg "US shale oil growth covers up production drop in rest-of-world")
US shale oil growth covers up production drop in rest-of-world
Posted on September 15, 2014 | No CommentsWe use the period starting with January 2010 when crude production had come back to 2005 levels after the exceptional year of 2009 Fig 1: US crude oil vs crude […] -
![Unnoticed by the mainstream media, US shale oil covers up a recent decline of crude oil production of 1.5 mb/d in the rest of world (using data up to Oct […]](https://crudeoilpeak.info/wp-content/uploads/2014/03/Incremental_World_Crude_Oil_Jan2001-Oct2013-115x115.jpg "World crude production 2013 without shale oil is back to 2005 levels")
World crude production 2013 without shale oil is back to 2005 levels
Posted on March 13, 2014 | No CommentsUnnoticed by the mainstream media, US shale oil covers up a recent decline of crude oil production of 1.5 mb/d in the rest of world (using data up to Oct […] -
![Latest figures for the 4th quarter of 2013 show that for a 7.5% increase of traffic over 3 years after an additional 3rd lane was opened, the cost to motorists […]](https://crudeoilpeak.info/wp-content/uploads/2014/01/M2_Westbound_607X_18Dec2013-115x115.jpg "Unsustainable Sydney: cost of using M2 toll-way grows 4 times faster than traffic")
Unsustainable Sydney: cost of using M2 toll-way grows 4 times faster than traffic
Posted on January 16, 2014 | No CommentsLatest figures for the 4th quarter of 2013 show that for a 7.5% increase of traffic over 3 years after an additional 3rd lane was opened, the cost to motorists […] -
![The following graph shows the changes in global crude oil production since January 2001. The data source is the EIA International Energy Statistics downloaded in December 2012 http://www.eia.gov/cfapps/ipdbproject/iedindex3.cfm Countries have […]](https://crudeoilpeak.info/wp-content/uploads/2013/01/Incremental_crude_World_2001_Sep2012-115x115.jpg "75 pct of global crude production in 2012 was not higher than in 2005")
75 pct of global crude production in 2012 was not higher than in 2005
Posted on January 2, 2013 | No CommentsThe following graph shows the changes in global crude oil production since January 2001. The data source is the EIA International Energy Statistics downloaded in December 2012 http://www.eia.gov/cfapps/ipdbproject/iedindex3.cfm Countries have […] -
![(1) By continent (1.1) North America Growing Canadian production from tar sand syn crude could not offset Mexican decline. The US was able to increase production after the last hurricane […]](https://crudeoilpeak.info/wp-content/uploads/2011/12/Incremental_crude_World_2001_Aug2011-115x115.jpg "Incremental crude oil production August 2011")
Incremental crude oil production August 2011
Posted on December 26, 2011 | No Comments(1) By continent (1.1) North America Growing Canadian production from tar sand syn crude could not offset Mexican decline. The US was able to increase production after the last hurricane […]