This is a joint post with Art Berman, a geological consultant based in Houston, Texas, and may be seen also on his website http://www.artberman.com/
U.S. crude oil storage is filling up with unaccounted-for oil. There is a lot more oil in storage than the amount that can be accounted for by domestic production and imports.
That’s a big problem since oil prices move up or down based on the U.S. crude oil storage report. That is because oil stocks in inventory represent surplus supply. Increasing or decreasing inventory levels generally push prices lower or higher because they indicate trends toward longer term oversupply or undersupply.
Why Inventories Matter
Inventory levels have reached record highs since the oil price collapse in 2014. This surplus supply is a major factor keeping oil prices low.
Current inventories are 45 million barrels higher than 2015 levels which were more than 100 million barrels higher than the average from 2010 through 2014 (Figure 1). Until the present surplus is reduced by almost 150 million barrels down to the 2010-2014 average, there is little technical possibility of a sustained oil price recovery.
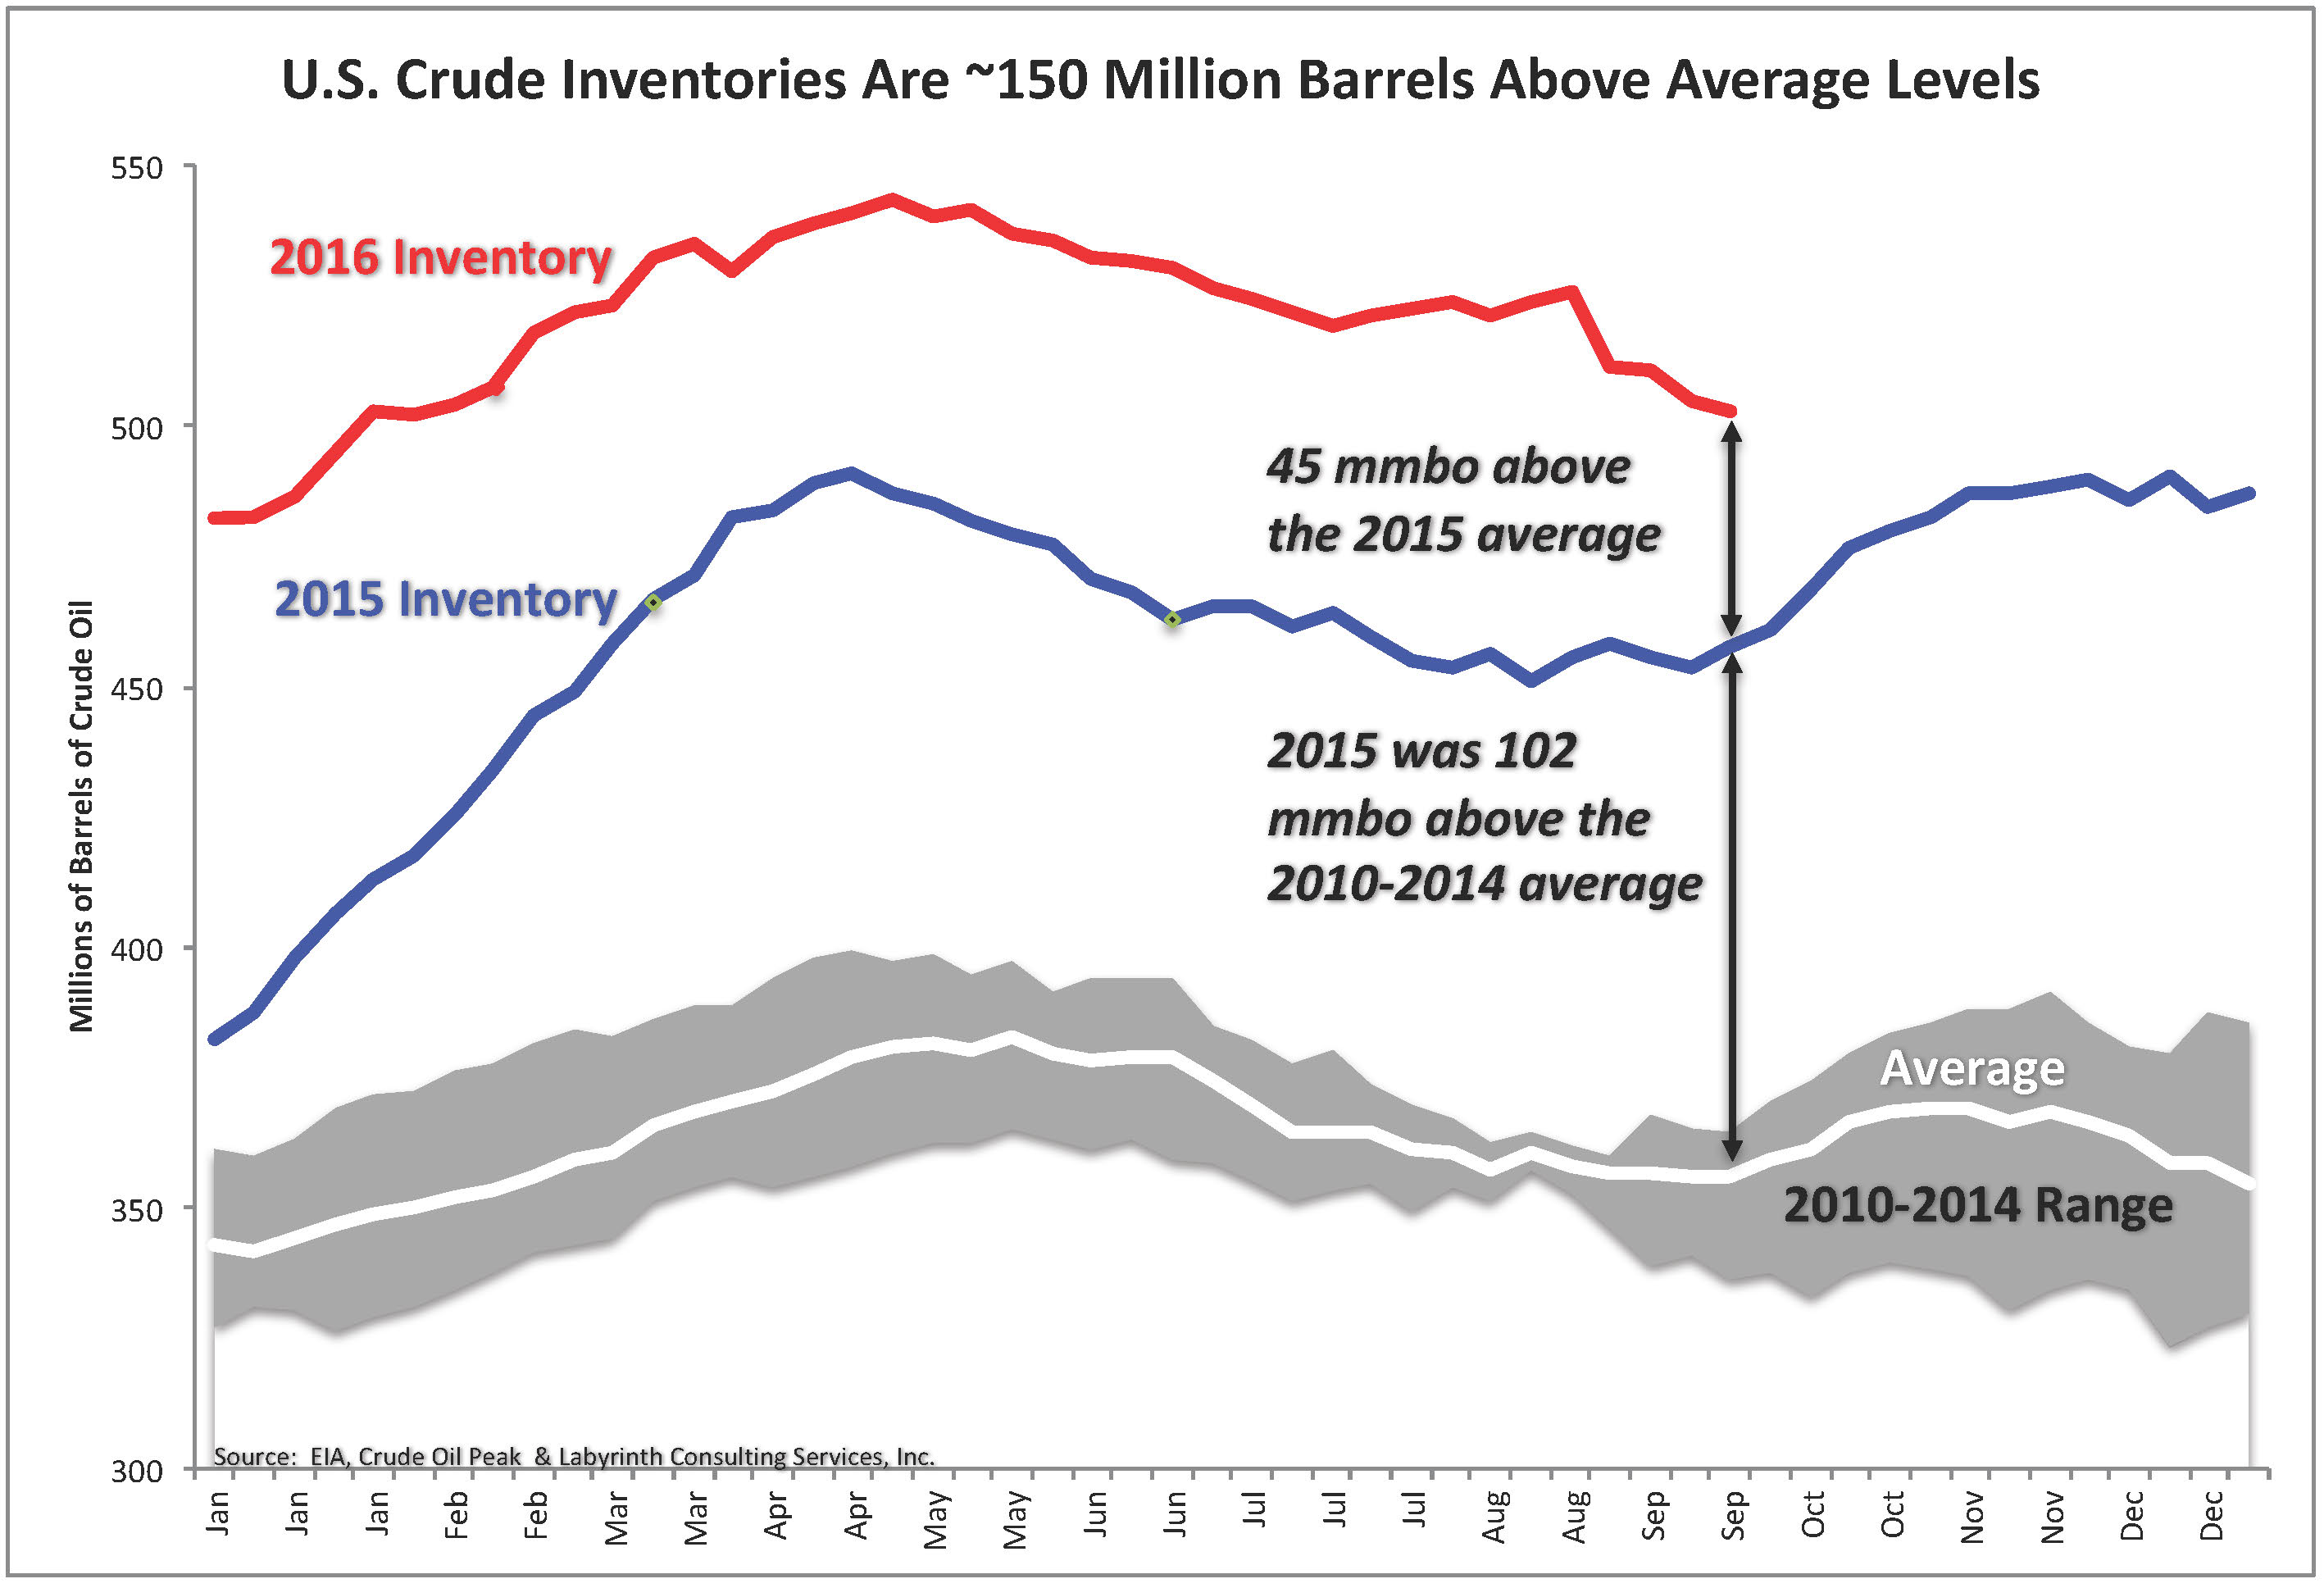
Figure 1. U.S. Crude Inventories Are ~150 Million Barrels Above Average Levels. Source: EIA, Crude Oil Peak and Labyrinth Consulting Services, Inc.
U.S. inventories are critical because stock levels are published every week by the U.S. EIA (Energy Information Administration). The IEA (International Energy Agency) publishes OECD inventories but that data is only published monthly and it measures liquids but not crude oil. It also largely parallels U.S. stock levels that account for almost half of its volume. Inventories for the rest of the world are more speculative.
Understanding U.S. Stock Levels
Understanding U.S. stock levels should be straightforward. Every Wednesday, EIA publishes the Weekly Petroleum Status Report which includes a table similar to Figure 2.
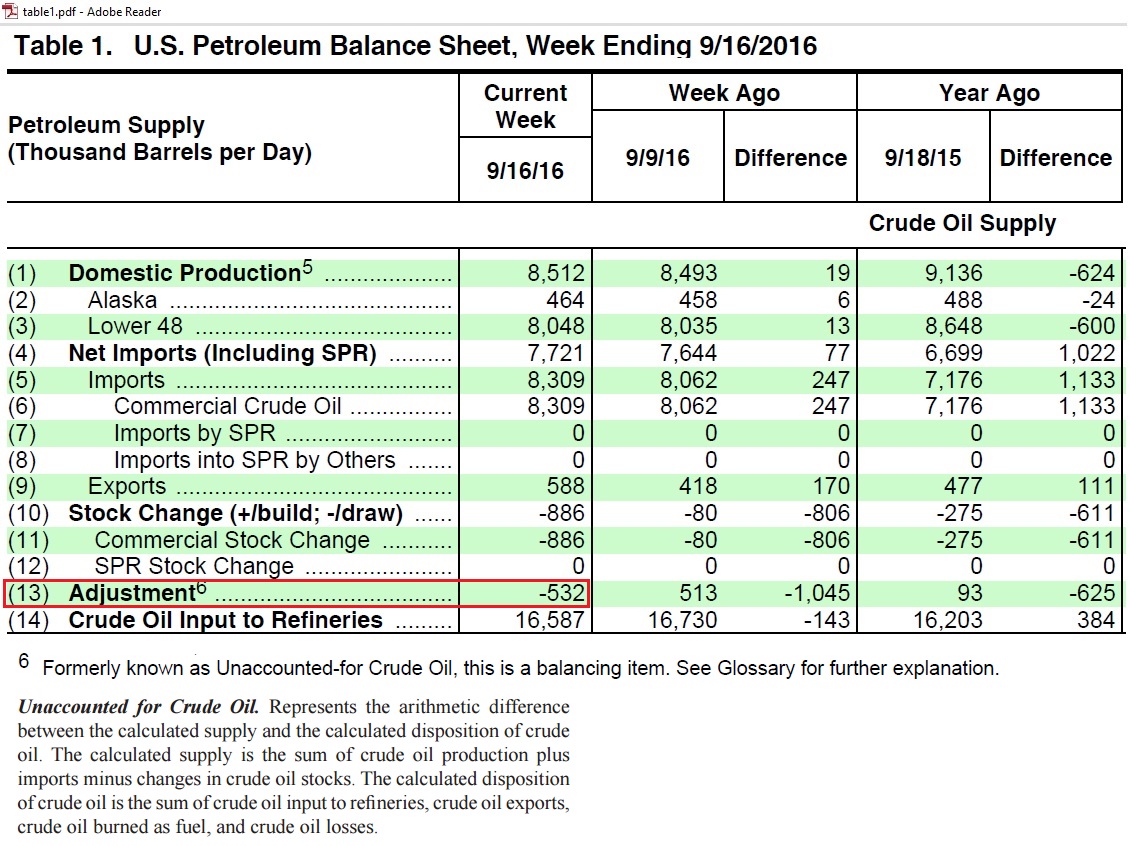
Figure 2. EIA publishes adjustments and defines them as “Unaccounted-for Oil.” Source: EIA U.S. Petroleum Status Weekly (Week Ending September 16, 2016), Crude Oil Peak and Labyrinth Consulting Services, Inc.
The calculation to determine the expected weekly stock change is fairly simple:
Stock Change = Domestic Production + Net Imports – Crude Oil Input to Refineries
Domestic production and net imports account for crude oil supply and refinery inputs account for the volume of oil that is refined into petroleum products. If there is a surplus, it should show up as an addition to inventory and a deficit, as a withdrawal from inventory.
But that’s not how it works because EIA uses an adjustment in order to balance the books (Table 1).
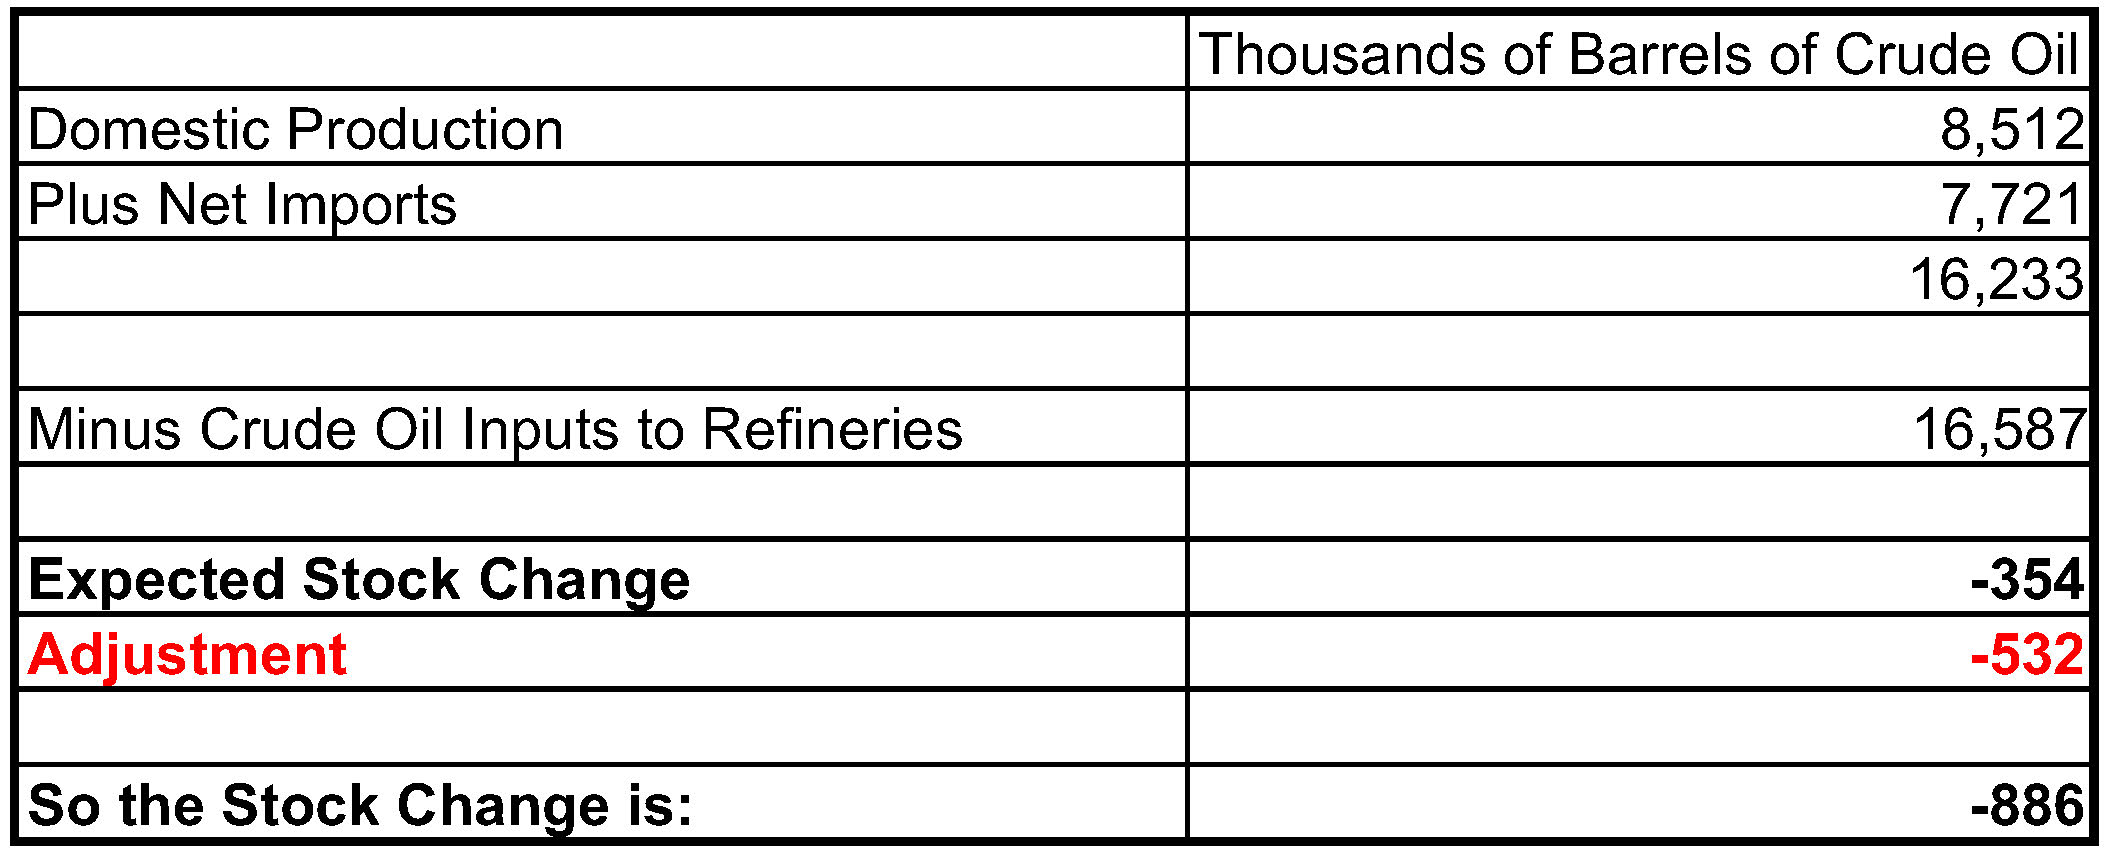
Table 1. Calculation of Crude Oil Stock Change. Source: EIA Petroleum Status Weekly, Crude Oil Peak and Labyrinth Consulting Services, Inc.
The logic is that estimated stock levels in tank farms and underground storage are relatively dependable and that any imbalance must be from less reliable production, net import or refinery intake data.
There is nothing wrong with adjustment factors if they are small in comparison to what is to be balanced. In the Table 1 example from September 2016, however, the adjustment is 60% of the stock change–a bit too much.
A one-off perhaps? No, it’s a permanent problem that has gotten worse during the last several years.
Figure 3 shows that crude oil supply and refinery intake of oil vary considerably on a weekly basis. The balance is cumulatively negative over time beginning with a zero balance in January 1983. That suggests that crude oil stocks should be falling over time but instead, they have been rising.
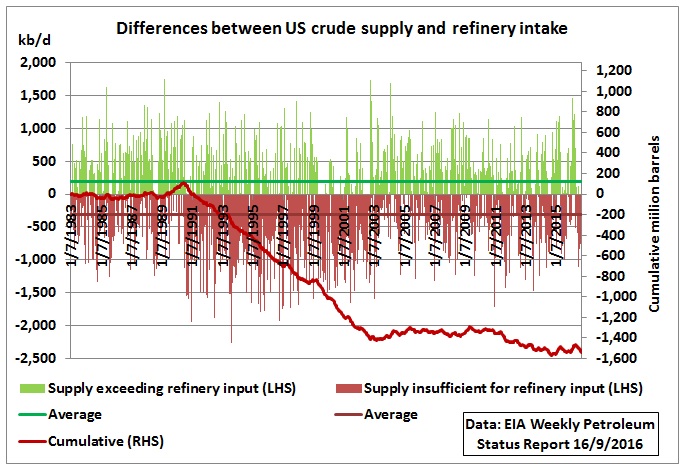
Figure 3. Difference between U.S. crude oil supply and refinery intake. Source: EIA Petroleum Status Weekly.
The vertical bars show the weekly crude supply from production and net imports either exceeding the refinery input requirements (positive, green) or not reaching these requirements (negative, red). The solid red line is the cumulative. Between 1991 and 2002, the deficit increased to a whopping 1.3 billion barrels.
Looking at only recent history, an additional gap of nearly 200 million barrels developed as refinery intake exceeded crude oil supply for most of 2010 through 2014 (Figure 4).
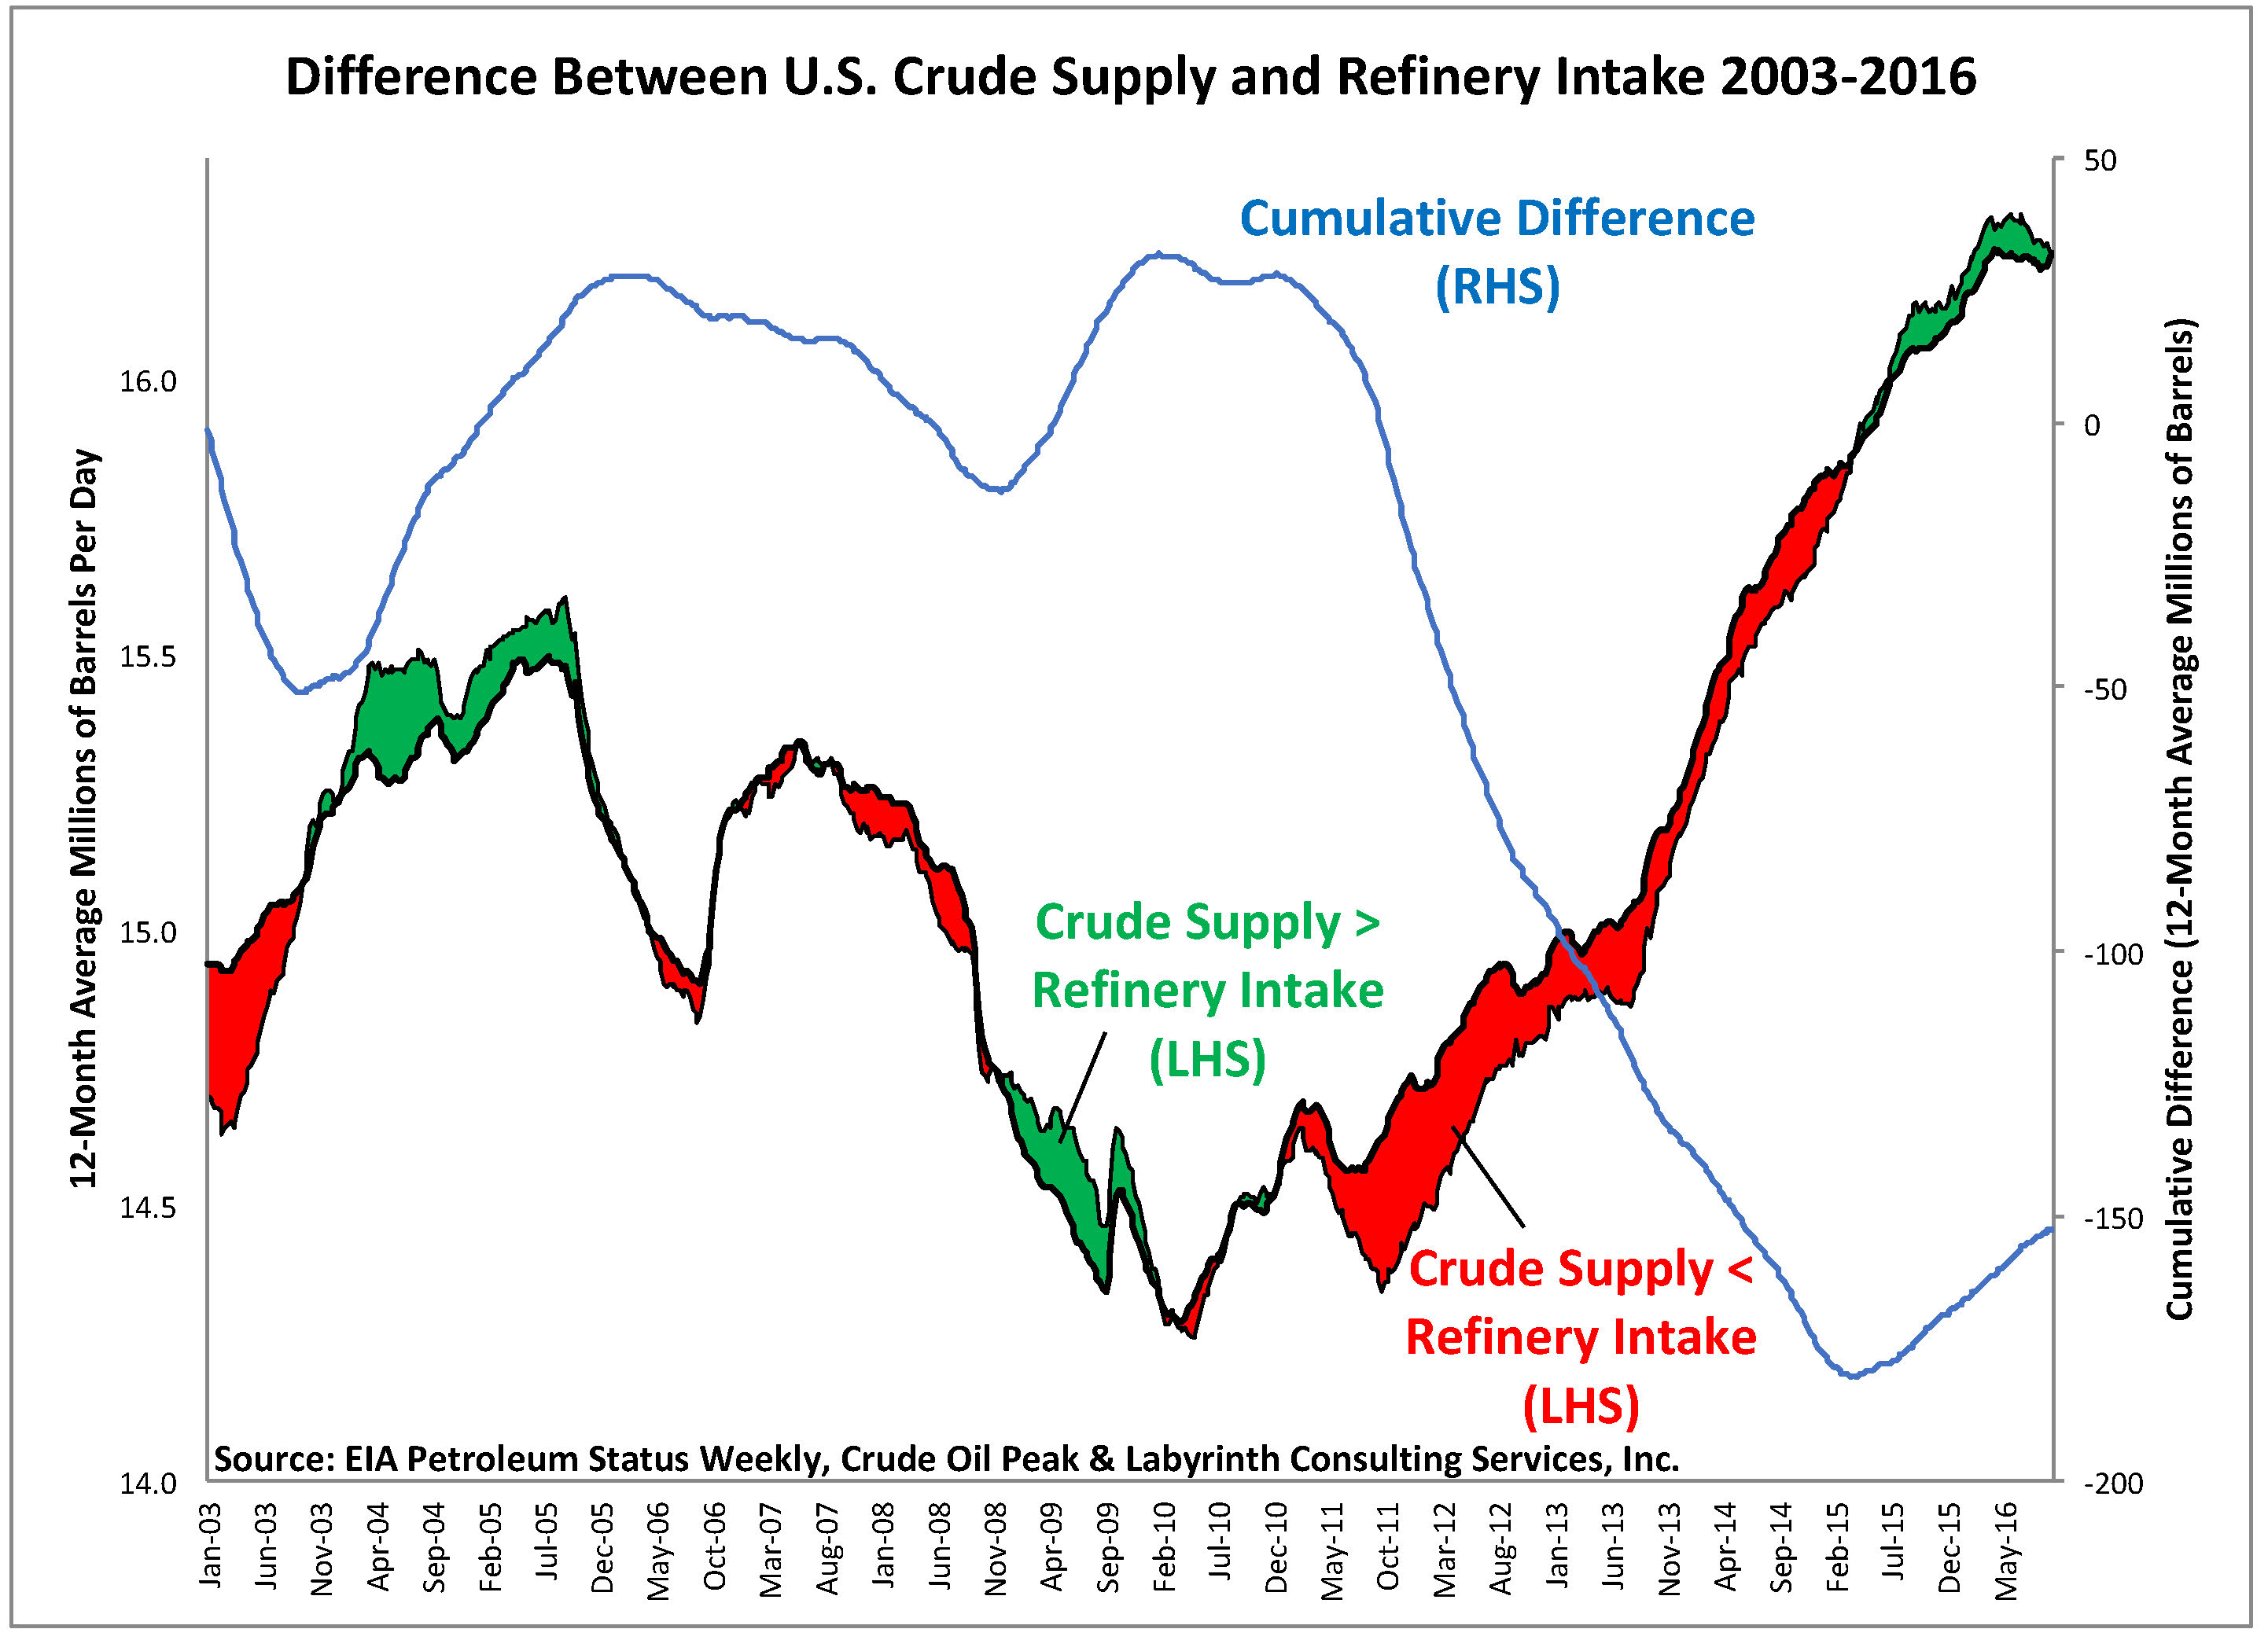
Figure 4. Difference between U.S. crude oil supply and refinery intake 2002-2016 (12month moving average values). Source: EIA Petroleum Status Weekly, Crude Oil Peak and Labyrinth Consulting Services, Inc.
Adjustments were introduced in late 2001 so let’s look at the period starting January 2002 (Figure 5).
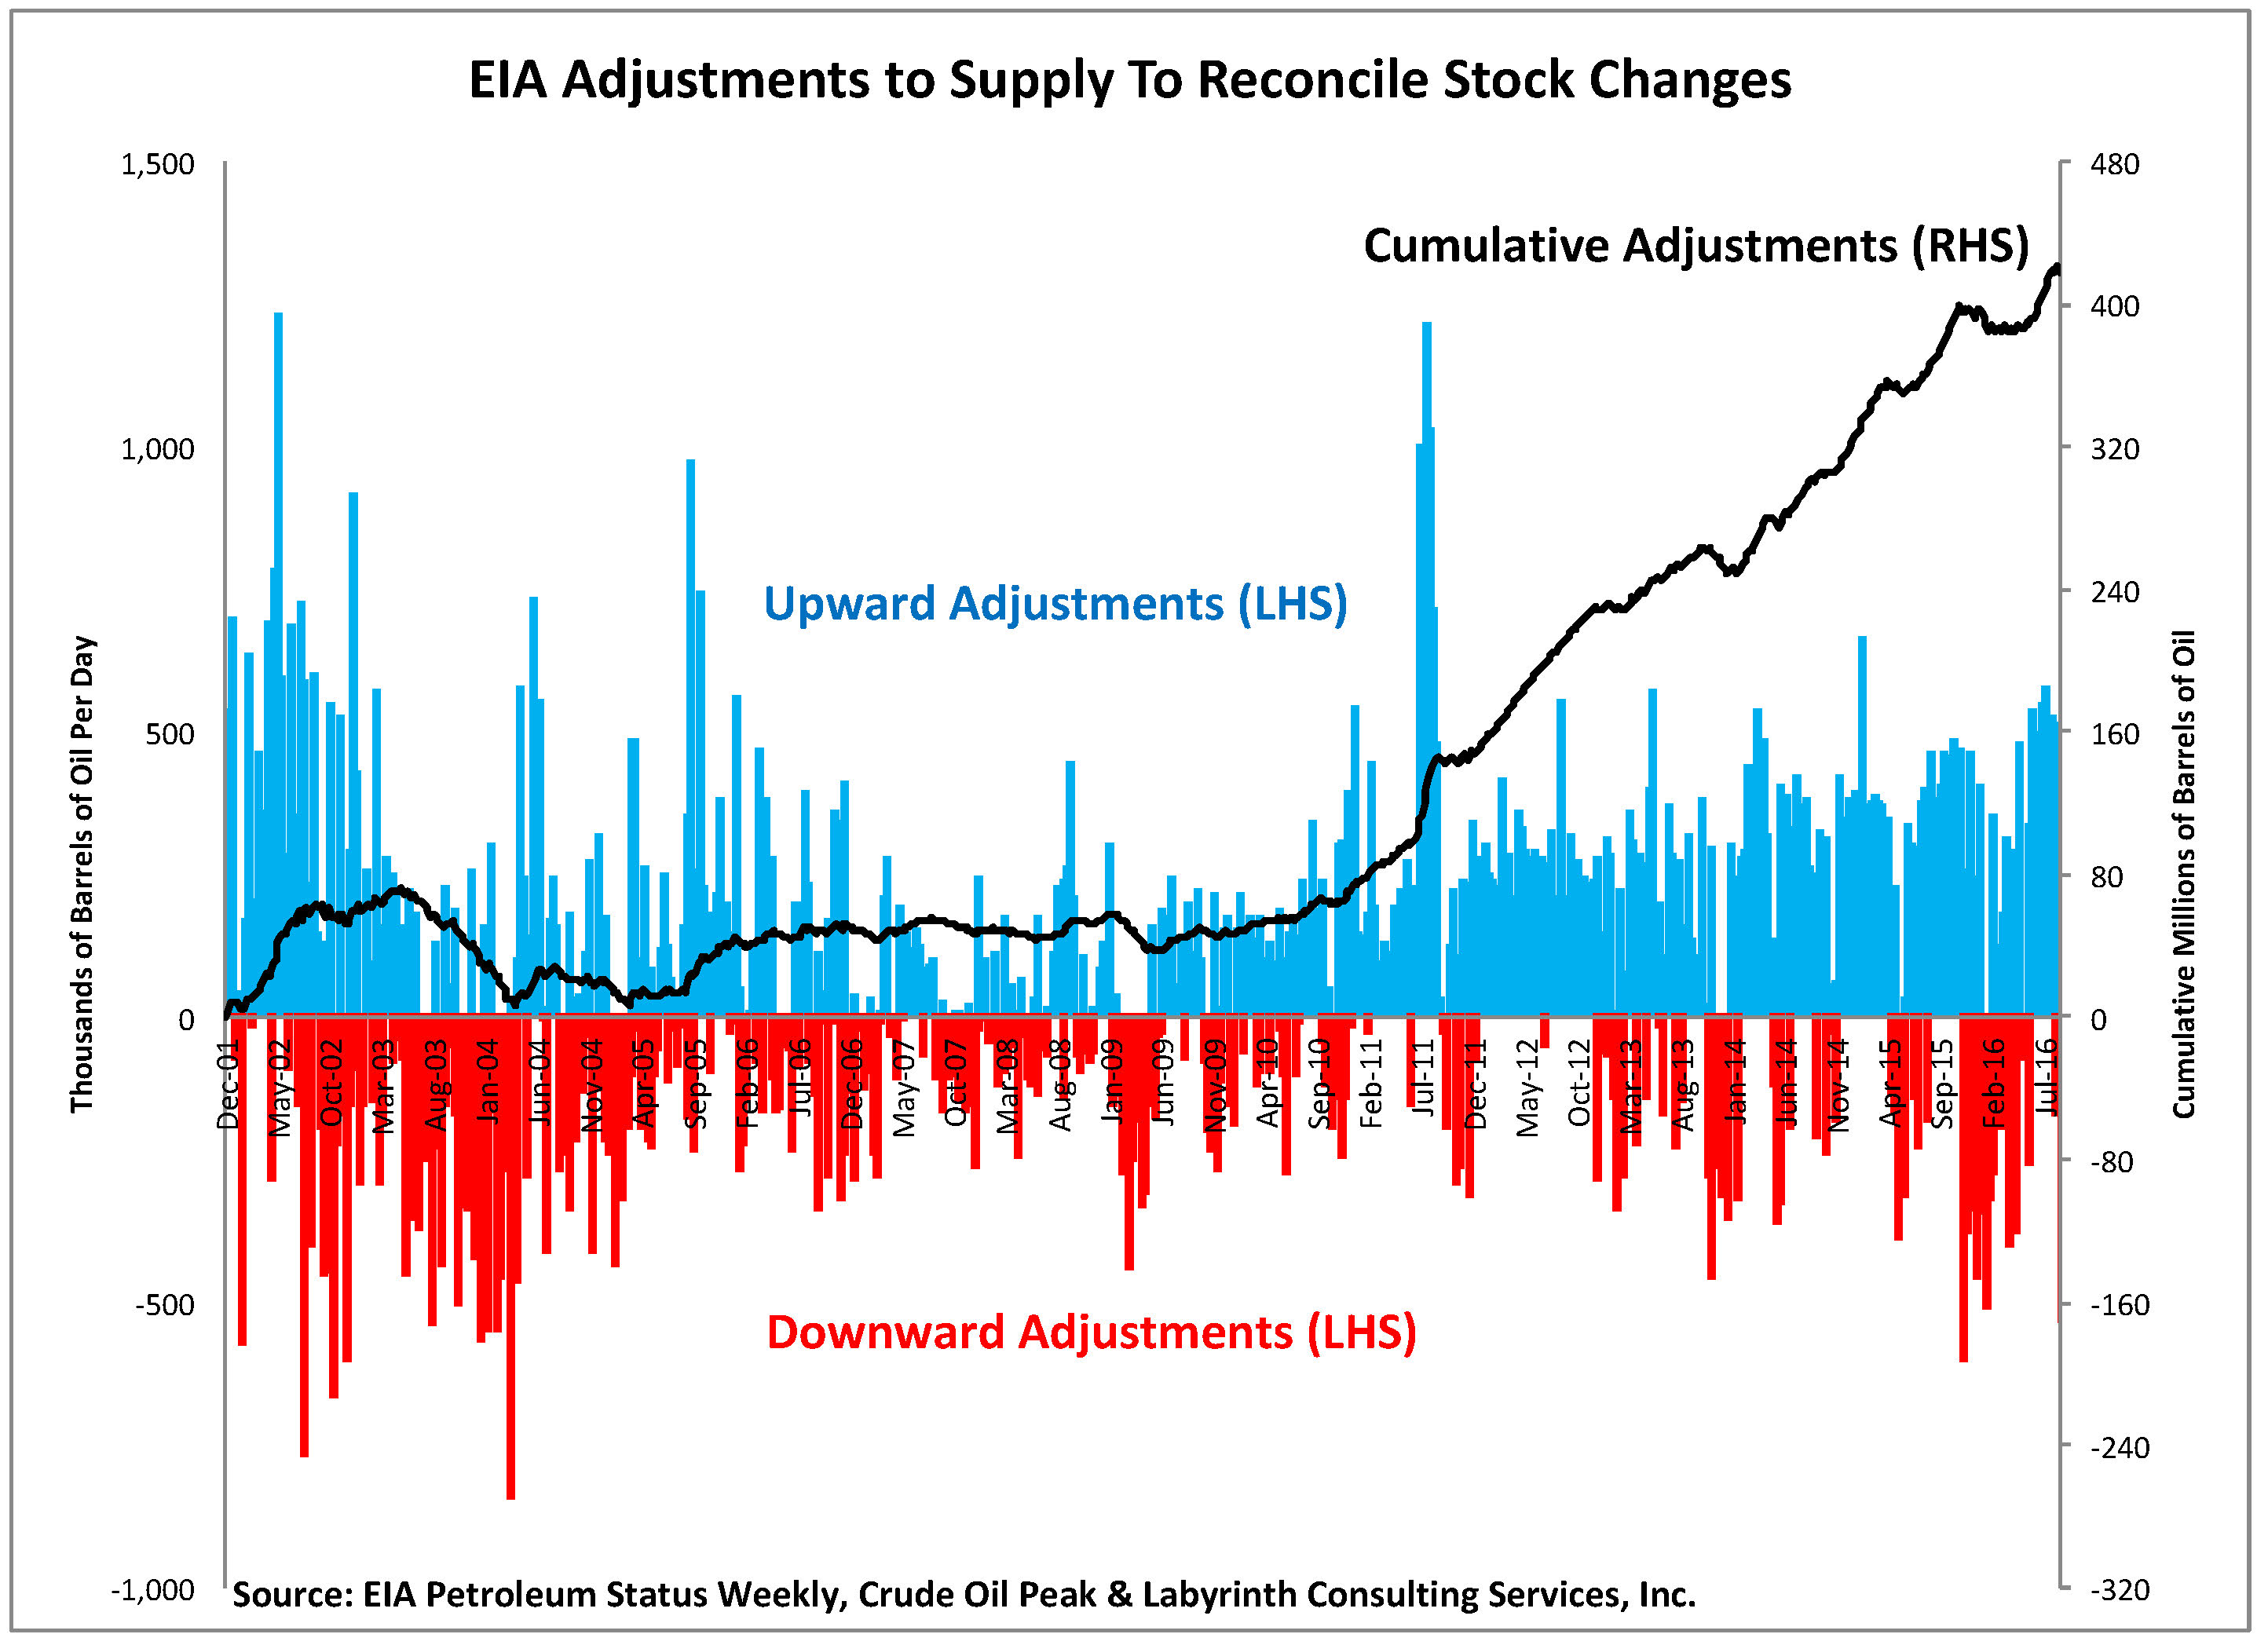
Figure 5. EIA adjustments to supply to reconcile stock changes. Source: EIA Petroleum Status Weekly, Crude Oil Peak and Labyrinth Consulting Services, Inc.
There are both upward (blue) and downward (red) adjustments. The upward adjustments contributed to an increase in stocks which added up to around 420 million barrels over the period January 2002 through September 2016.
All together now
Expected or implied stock changes calculated from weekly crude oil balance indicate falling inventories. Yet, EIA makes adjustments to that balance in order to match observed inventory levels. Rising inventories result after those adjustments are added to the physical balance or implied stock changes (Figure 6).
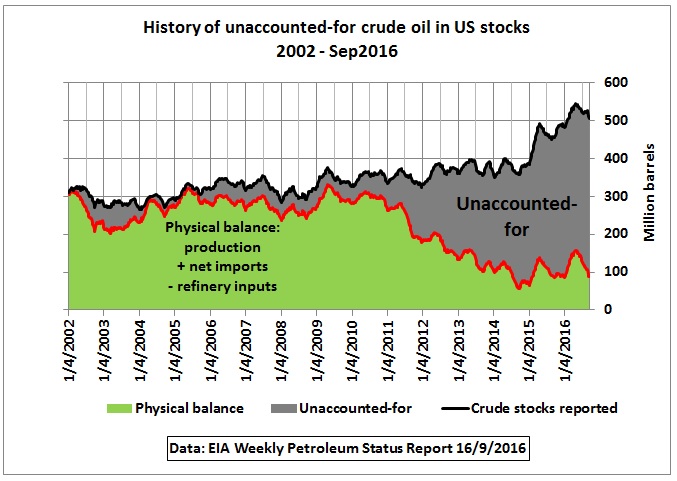
Figure 6. Unaccounted-for oil in U.S. storage: the result of adjustments to the supply balance. Source: EIA Petroleum Status Weekly, Crude Oil Peak and Labyrinth Consulting Services, Inc.
The green area represents the physical balance (crude production plus net crude imports minus crude refinery intake). The gray area shows the unaccounted-for (adjusted) stocks.
The adjustment for unaccounted-for oil averaged about 15% from 2002 through 2010. In 2016, almost 80% of reported stocks are from unaccounted-for oil.
When You Have Eliminated The Impossible
There is no obvious solution for the mystery of unaccounted-for oil in U.S. inventories. Possible explanations, however, include:
1. Crude field production is underestimated
2. Net crude oil imports are underestimated
3. Refinery inputs are overreported
4. Crude oil stocks are overreported
or any combination of those possibilities.
Production, imports and refinery inputs are taxable transactions. It is likely that reporting errors would be largely self-correcting over time because of the financial incentive for government to collect its due.
State regulatory agencies are the source of production data. Their principal objective is to assess production taxes. It is highly unlikely that states would consistently underestimate production and forego substantial tax revenue. Also, producers must state crude oil production in their SEC (U.S. Securities and Exchange Commission) filings and pay federal income tax on revenues from oil sales. It seems improbable that the SEC and U.S. Treasury would consistently accept underreported production and associated tax payments.
Crude oil imports are subject to both tariffs and excise taxes so it seems unlikely that the U.S. government would consistently fail to identify underpayment of those revenues.
Similarly, taxes are involved when refiners buy crude oil and sell refined products. It seems improbable that they would overstate these transactions and consistently overpay associated taxes.
The principal components of supply balance—production, imports and refinery intake—are shown in Figure 7. In a general way, increased production and decreased imports tend to cancel each other out. Refinery intake has increased since about 2010.
The physical balance components support the observation that implied stocks (in light blue) are substantially less than reported stocks (in gray) as we have described above.
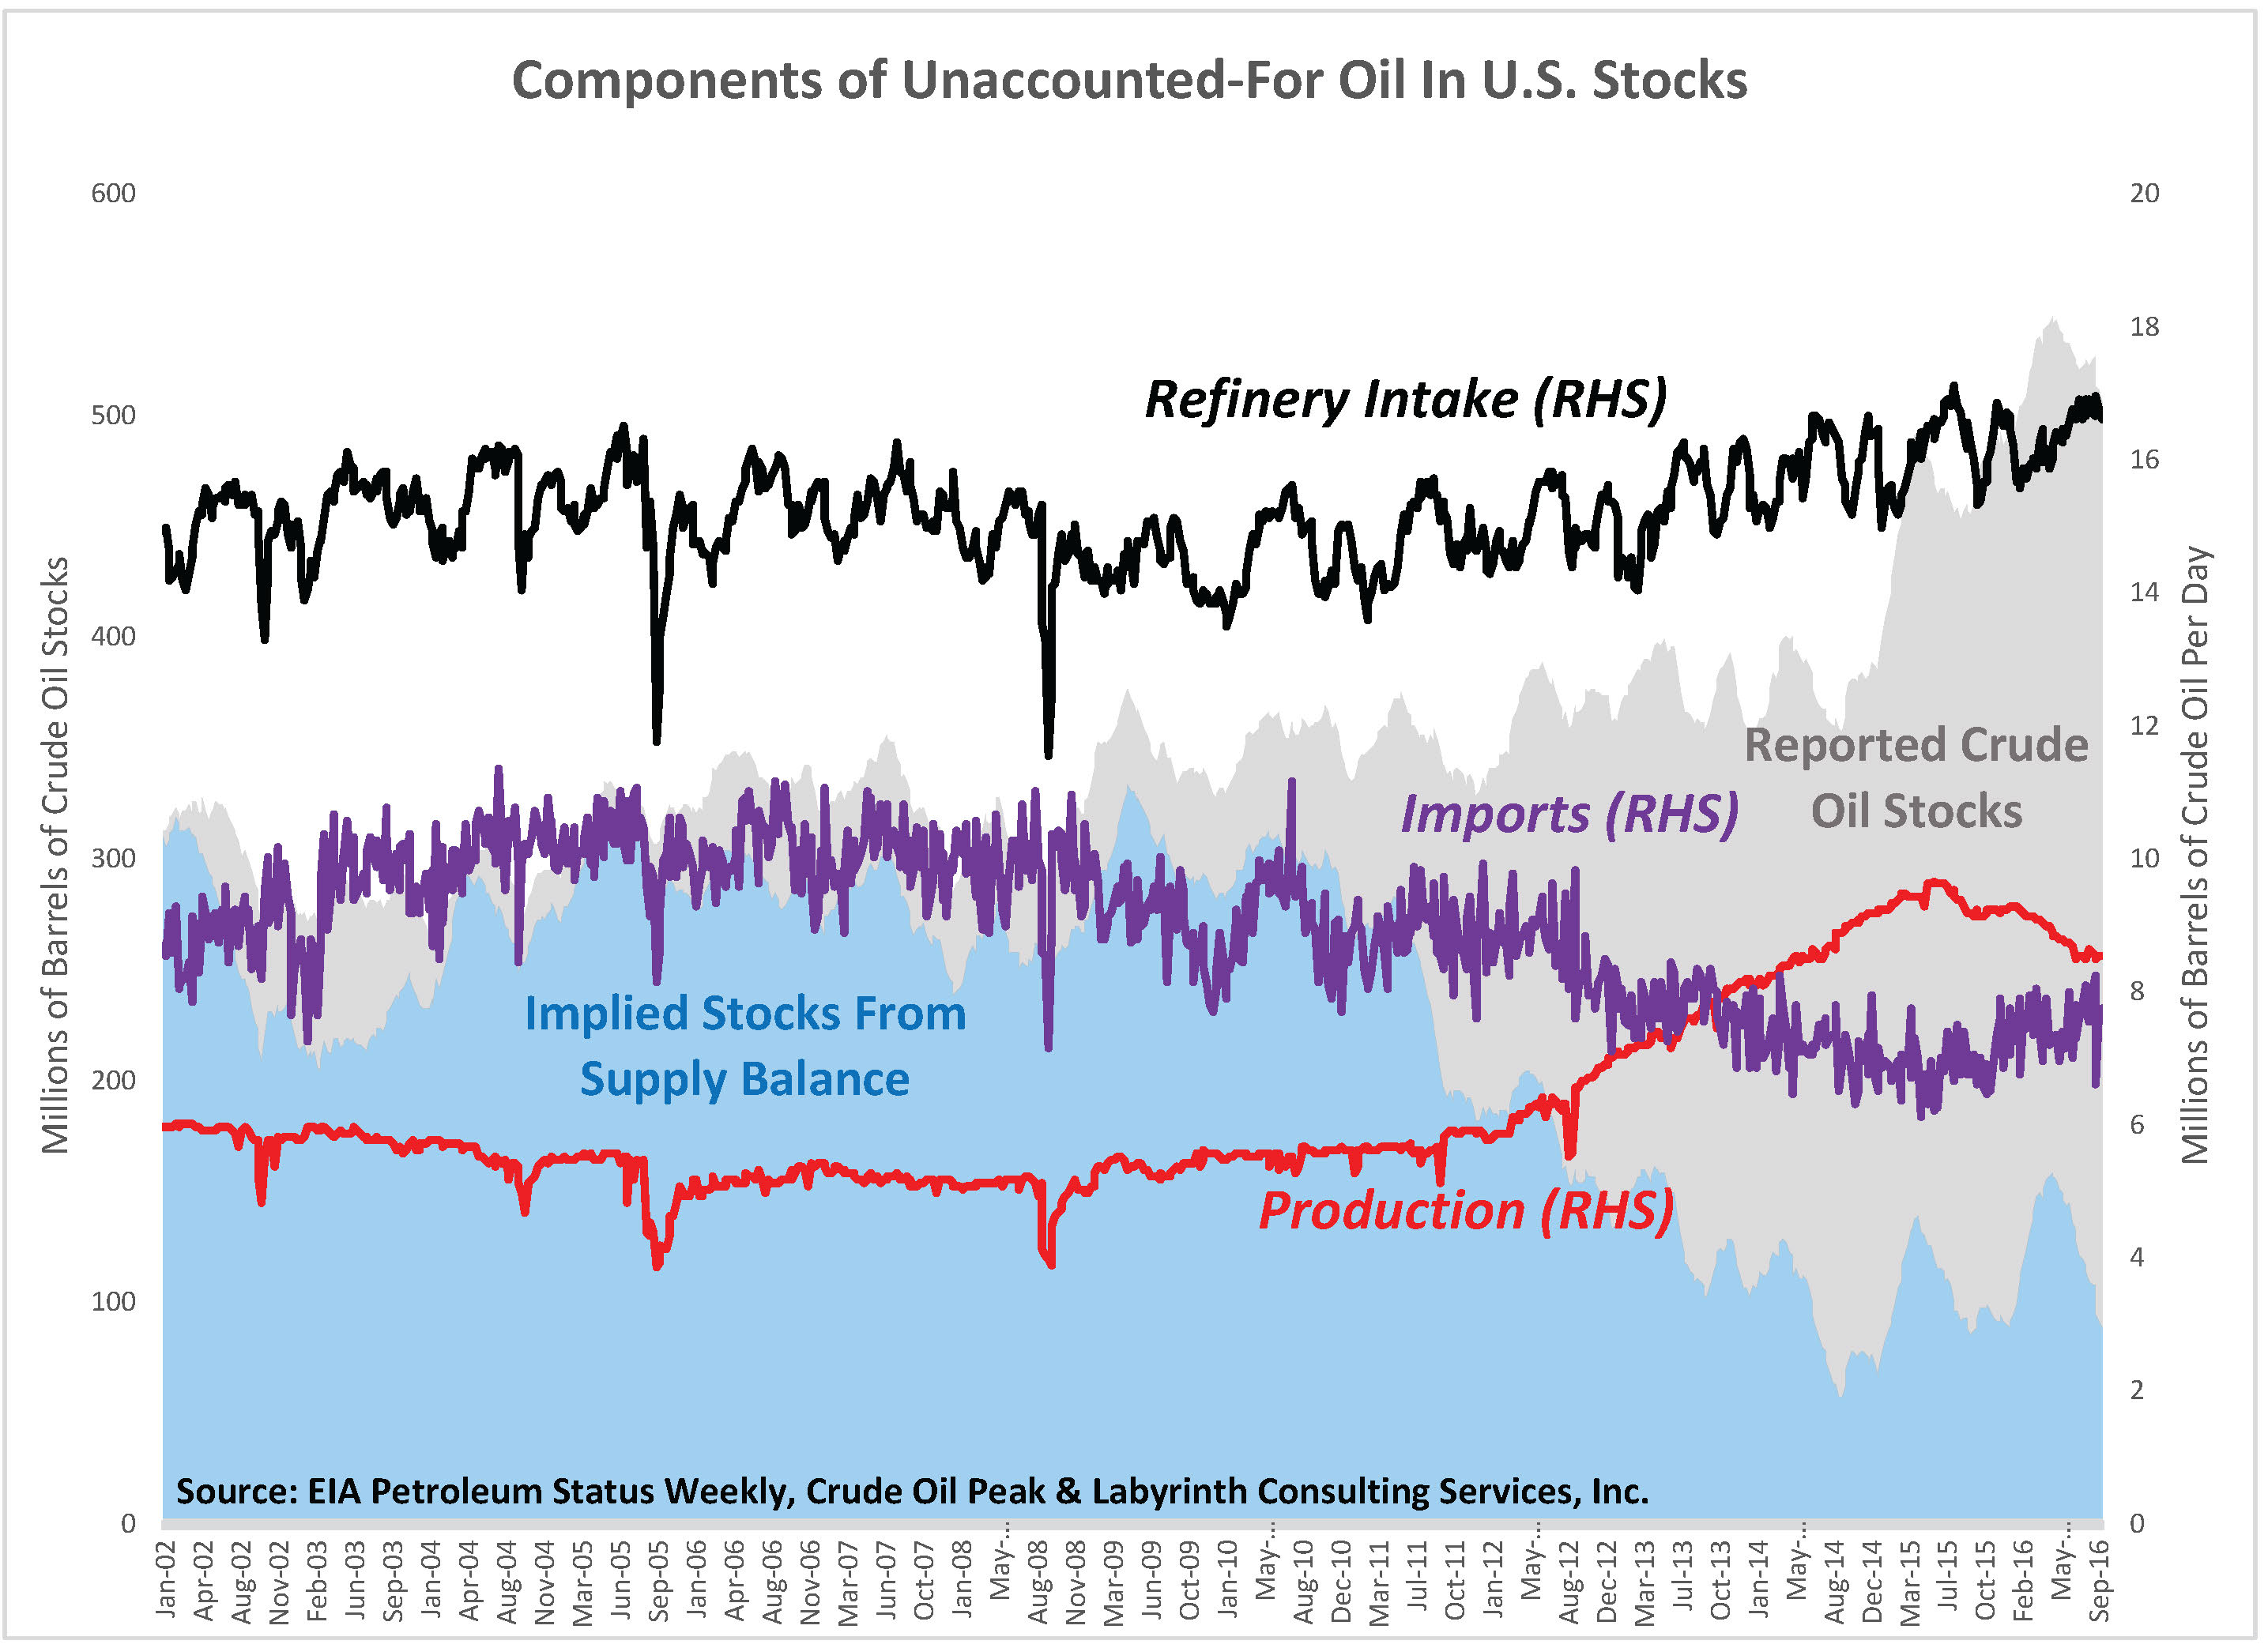
Figure 7. Components of unaccounted-for oil in U.S. storage. Source: EIA Petroleum Status Weekly, Crude Oil Peak and Labyrinth Consulting Services, Inc.
It would be speculation to blame anyone for this apparent statistical disaster. Nonetheless, there is a problem with major implications for oil price and the reliability of reported data.
In several Sherlock Holmes mystery stories, author Arthur Conan Doyle wrote, “When you have eliminated the impossible, whatever remains, however improbable, must be the truth.”
We have not eliminated any impossible explanations. We have, however, eliminated the three most improbable explanations for unaccounted-for oil. Therefore, the most likely explanation—however improbable—is that inventories are not as high as they are reported.
Addendum
Some readers noted that EIA Weekly Petroleum Status Report (PSW) data that we used in our evaluation includes estimates of production, net imports and refinery inputs. They questioned whether EIA monthly Supply and Deposition data might resolve the disparity between implied and reported stocks described in this post.
Figure 8 shows the monthly averaged data from the PSW and implied stocks calculated from monthly Supply and Disposition data (the red line). The difference between implied and reported stocks before 2010 is less than in our original evaluation. The difference from 2010 through 2012 is approximately the same, and for 2013 through the present, the differences are actually greater.
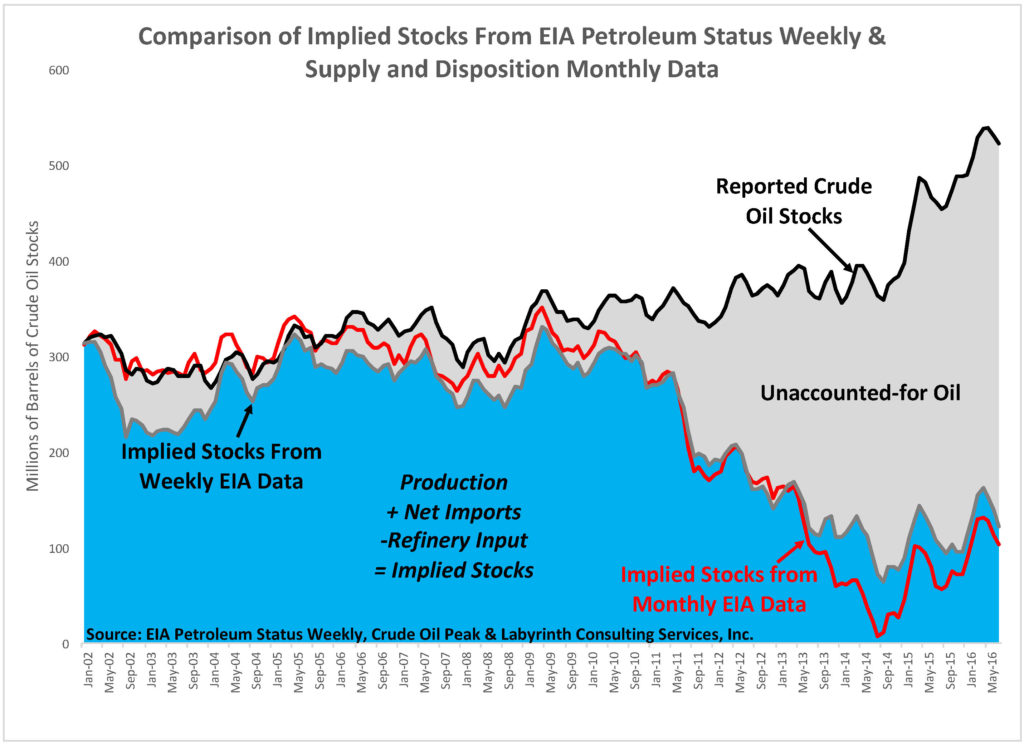
Figure 8. Comparison of Implied Stocks From EIA Petroleum Status Weekly & Supply and Disposition Monthly Data. Source: EIA Petroleum Status Weekly, EIA Supply and Deposition, Crude Oil Peak and Labyrinth Consulting Services, Inc.