The world has returned to business as usual after the Saudis assured oil markets that production will be back soon and as oil prices have returned to pre-attack levels and even lower, indicating that oil traders focus on a weak global economic outlook.
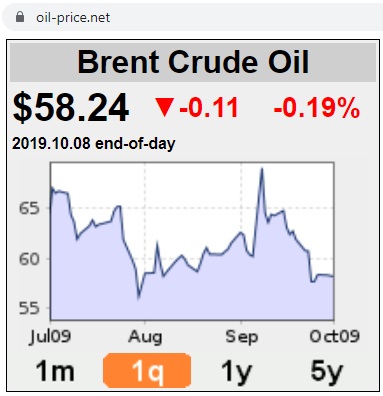
Fig 1: Abqaiq’s oil price spike
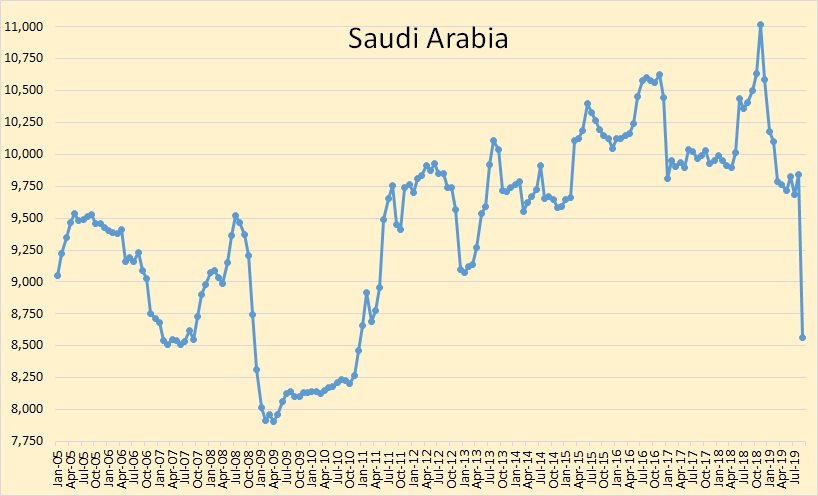
Fig2: Saudi crude oil production drop after the Abqaiq attack
The peak oil barrel blog monitors OPEC’s oil production and published the above graph for September 2019, using data from OPEC’s Monthly Oil Market Report. The drop from around 9,800 kb/d to 8,500 kb/d translates into an approximate loss in September of 40 mb Arab Light. Saudi oil stocks were 180 mb before the attack. Maybe tanks are filled with partially processed oil with a high sulfur content.
Iran’s oil exports
From the IEA Monthly Oil Market Report dated 12/9/2019 (2 days before the Abqaiq attack):
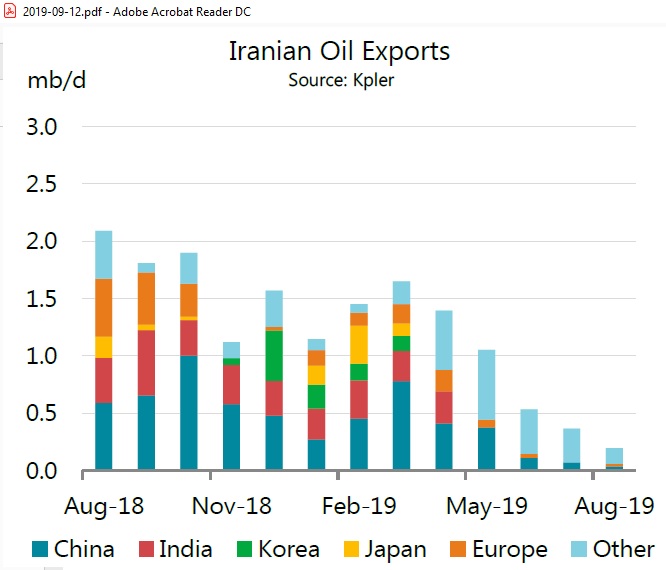
Fig 3: US ended sanction waivers in May 2019
https://www.iea.org/media/omrreports/fullissues/2019-09-12.pdf
The data on Iranian oil exports are fuzzy. On 13 Sep 2019 S&P Global Platts reported 424 kb/d in August (mainly to China and Syria) but warns that Iranian storage is filling up quickly, including 50 mb on tankers (mostly condensate). During the last round of sanctions in 2016 storage reached 55-60 mb.
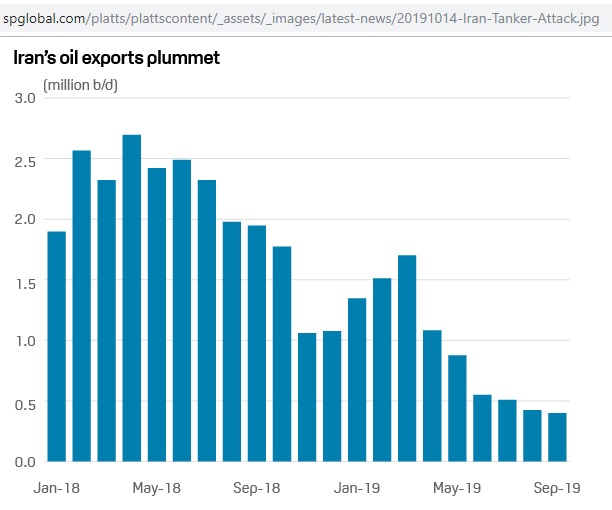
Fig 4: Iranian oil exports by Platts
In July 2019 the Atlantic Council calculated in an article entitled
Iran’s Crude Oil Exports: What Minimum Is Enough to Stay Afloat?
that Iran needs to export 1.5 mb/d to balance the budget and 720 Kb/d as an absolute minimum in survival mode (withdrawals from the National Development Fund, foreign exchange and gold reserves)
Changed balance of power in Middle East
As Iranian oil exports have dropped below these thresholds, attacks have intensified:
12 May: Fujairah, UAE, 4 tankers damaged in Gulf of Oman by limpet mines
14 May: Saudi pumping stations 8 and 9 on East-West pipeline attacked by drones originating in Iraq
13 June: In the Strait of Hormuz, tankers Kokuka Courageous and Front Altair (sustaining fire damage) attacked by limpet mine and/or flying objects
20 June: Al-Shuqaiq desal plant on the Red Sea coast attacked by Houthis
8 August: Abha airport hit by Houthi missiles
17 August: Houthis drone attack sparks fire at Shaybah gas field near UAE border
25 August: Houthis fired 10 Badr-1 ballistic missiles at Jizan airport
14 September: Abqaiq processing plant and Khurais oil field attacked with drones and missiles
Whatever the oil markets think, nothing can change the fact that we live now in a different Middle East where Iran’s cruise missile capabilities have changed the military balance.
U.S. Deploys Troops, Fighter Jets to Beef Up Saudi Arabia Defense Against Iran
11 Oct 2019
Pakistan tries to mediate between Saudi Arabia and Iran
13 Oct 2019
But if US sanctions on Iran are not lifted more attacks are very likely.
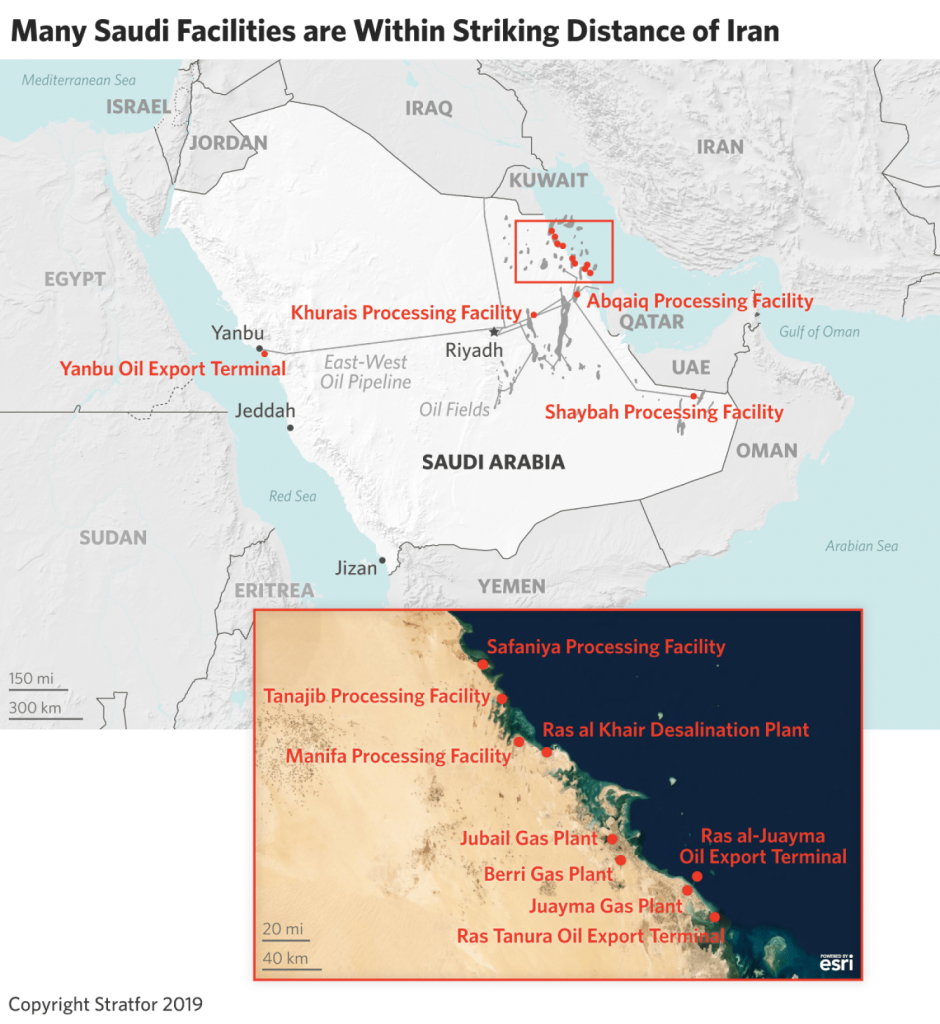
Fig 5: Saudi vulnerabilities
https://worldview.stratfor.com/article/saudi-oil-infrastructure-iran-attack-missiles-drones
Iran’s Zarif: Either all Gulf states have security, or all will be deprived of it
10/10/2019
DUBAI (Reuters) – Either all Gulf countries enjoy security, “or they will all be deprived of it,” Iranian Foreign Minister Mohammad Javad Zarif said on Thursday in an opinion piece in the Kuwaiti Al Rai newspaper.
According to the IMF’s World Economic Outlook published 15/10/2019 Iran’s GDP went down by 4.8% in 2018 and is projected to fall by another 9.5% in 2019:
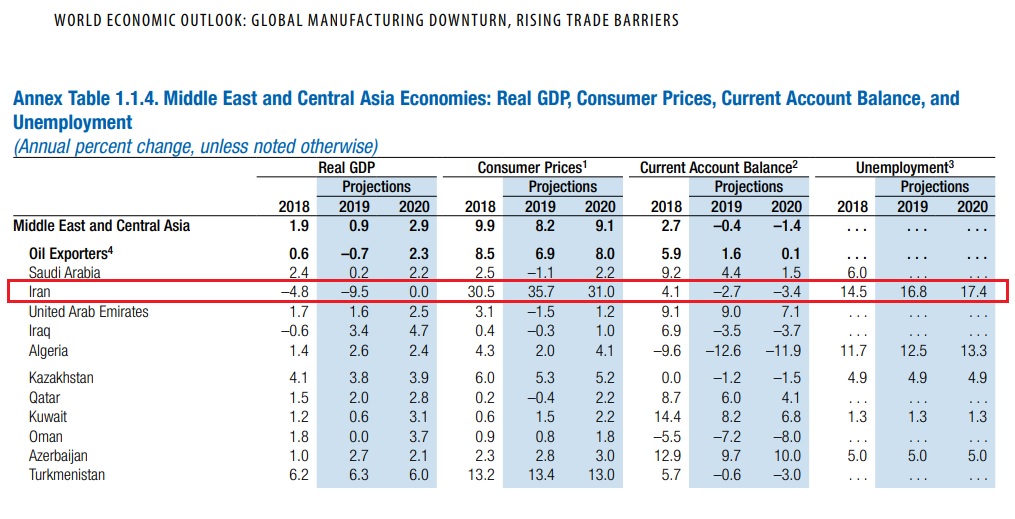
Fig 6: Economic indicators in the Middle East
https://www.imf.org/en/Publications/WEO/Issues/2019/10/01/world-economic-outlook-october-2019
Israel fears that its Dimona nuclear reactor in the Negev desert could be a target.
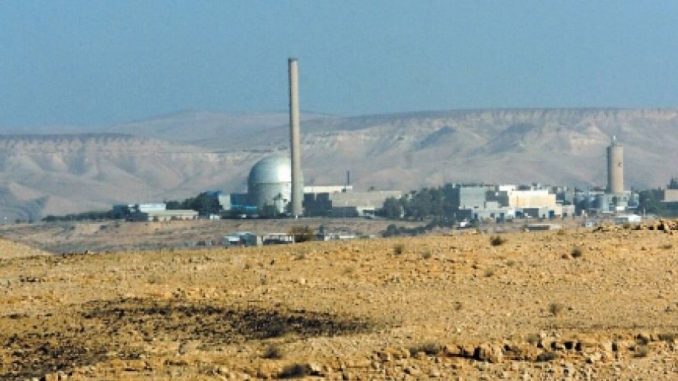
Fig 7: Dimona reactor in the Negev desert
There are many scenarios here as the Iranian regime has declared to wipe Israel from the map.
Top Iran general says destroying Israel ‘achievable goal’
1 Oct 2019
It is prudent to think the unthinkable and look how much oil there is without the Middle East.
Oil reserve history
Using the BP Statistical Review June 2019 we find the world’s safe oil reserves outside the Middle East are only 890 Gb, around half of the total of 1,730 Gb. We need to keep in mind that these reserves are supposedly proven but in reality they are a mixture of proved, probable and possible reserves and even resources, depending on the reporting country.
The following graph shows the oil reserve history since 1980.
The upper curve in Fig 5 includes Middle East reserves, the stacked areas show all other reserves of 890 Gb. They contain 160 Gb tar sands in Canada and 260 Gb extra heavy oil in Venezuela both of which are slow to produce compared to conventional oil. See below for more details.
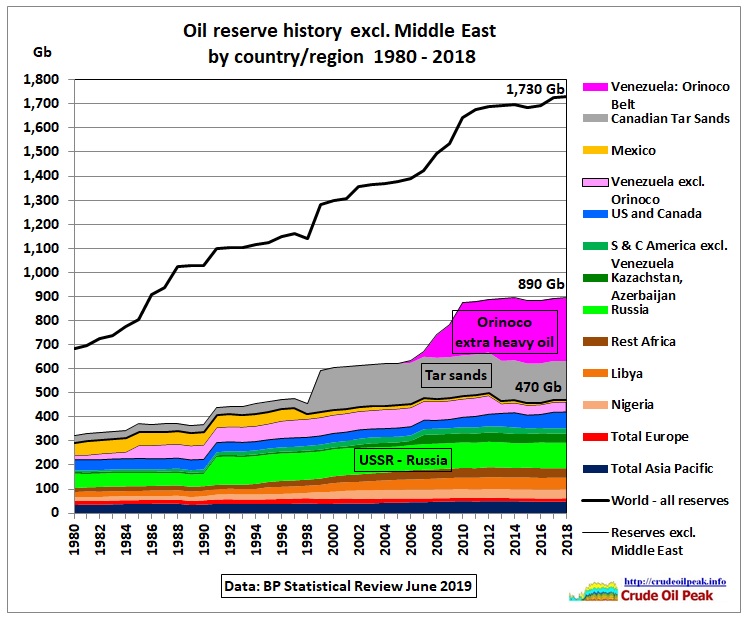
Fig 8: Oil reserve history
How much oil these reserves produce on an annual basis is shown in the next graph
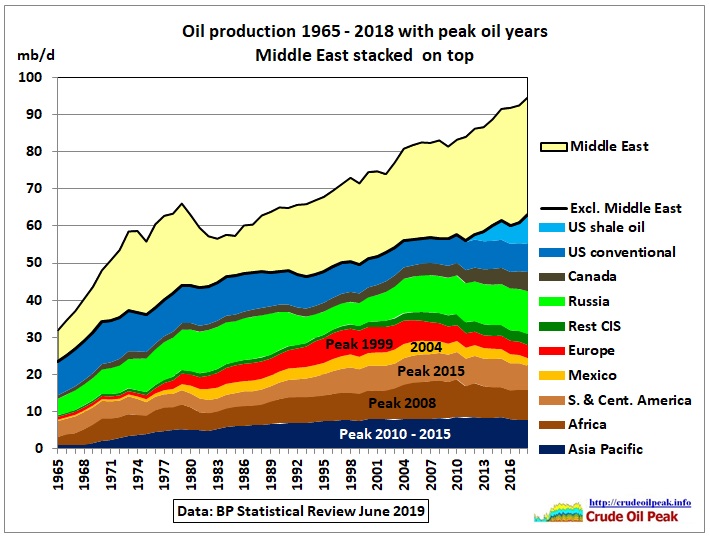
Fig 9: Oil production by region with focus outside the Middle East
In 2018 it was 63 mb/d (23 Gb pa) including extra heavy oil, tar sands and shale oil (which is also unconventional). That would be 67% of the total production of 94.7 mb/d. We see that there is a group of 4 regions where oil production has peaked in 2005 at 34.7 mb/d – now only 28 mb/d – with a decline rate of 500 kb/d pa.
The other regions are still growing but can hardly offset the decline. Only US shale oil brought growth. But that is very light or extra light oil which many refineries can only use as blending component but not as a bulk refinery input.
The annual production of 23 Gb would be 2.6 % pa of 890 Gb. But this average depletion rate with an R/P value of almost 40 years is meaningless.
Extra heavy oil and tar sands
Venezuela produces around 600 Kb/d extra heavy oil from the Orinoco belt which is less than 0.1% pa of the Orinoco reserves.
The Canada Energy Regulator estimated in “Canada’s Energy Futures 2018 Supplement: Oil Sands Production” that production (half of which is a mining operation based on 20% of the resource base) would be reaching around 4.5 mb/d by 2040 which is 1% pa of reserves.
https://www.cer-rec.gc.ca/nrg/ntgrtd/ftr/2018lsnds/index-eng.html
We also have to consider that tar sand production is threatened by wild fires as already happened around Fort McMurray in 2016, when a quarter of the production was put offline. NASA climatologist James Hansen warned in 2013 that if tar sands are produced to a significant extent, the global warming problem becomes unsolvable.
Conventional reserves outside the Middle East
If we take out extra heavy oil and tar sands for the purpose of calculating production rates as a percentage of reserves and R/P values (in years) we have only 470 Gb producing 59 mb/d (21.7 Gb pa or 4.6% pa), a reasonable percentage with a R/P value of 21 years. But there are huge differences between the regions as shown in the next chart.
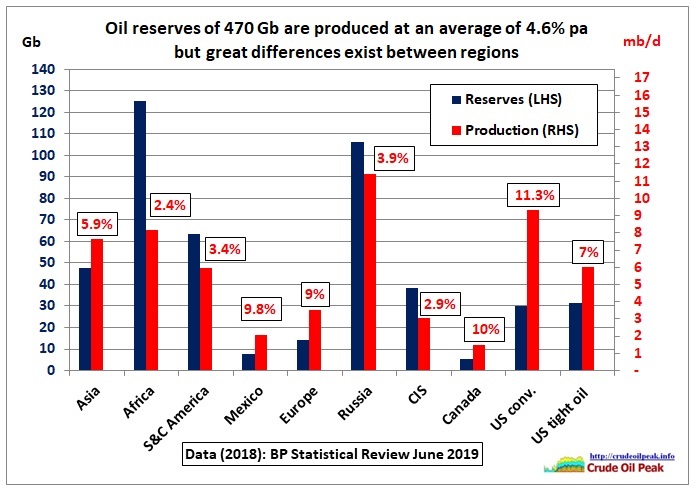
Fig 10: Reserves, production and annual production rates
In Asia, more than half of the reserves are in China (26 Gb) and therefore not available for the global oil market. In Africa annual production rates are low because most of the reserves are in Libya (48 Gb) and in Nigeria (37 Gb) where there are known production problems due to civil unrest. Whether these reserves are correct is another question. Reserves in South and Central America contain Venezuelan conventional reserves of 42 Gb, mainly in the mature Maracaibo and eastern areas. Production in Furrial, Santa Barbara and Carito (reserves 7.4 Gb) has peaked in 2007 at 1.275 mb/d and is now down to 575 kb/d and not just because of Chavez and Maduro. Mexico and the North Sea are beyond peak production and have high depletion rates. The world will depend on Russia and the CIS (Kazakhstan).
US reserves
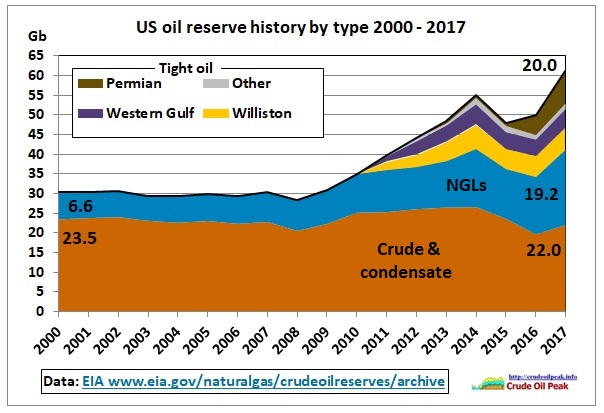
Fig 11: US reserves by type
US proved reserves are subject to strict SEC rules. They contain crude & condensate (22 Gb), natural gas liquids (19.2 Gb) and unconventional tight oil (20 Gb). Crude and condensate reserves have remained around 20 Gb for many years. This means that discoveries, field extensions and revisions have basically been used up in production – from hand to mouth. Natural gas liquid reserves (19.2 Gb) have increased due to higher gas production. Tight oil reserves (20 Gb) have come into the picture only after 2010. The legendary Permian has only 8.3 Gb. As Fig 10 shows, these reserves are produced aggressively at 8-11 % pa.
There are also probable and contingent reserves/resources (+70 Gb, see table at the Rystad link below)
Alternative calculations
Reserves in the BP Statistical Review are not all proven. Rystad Energy compared BP reserves with their own assessment based on the Petroleum Resource Management System of the Society of Petroleum Engineers
1P Proved oil reserves, conservative estimate in existing fields
2P Proved plus probable oil reserves, most likely estimate in existing fields
2PC Proved plus probable oil reserves plus mean contingent recoverable oil resources in yet undecided projects/discoveries, including non-commercial volumes
2PCX As 2PC plus risked prospective resources in yet undiscovered fields
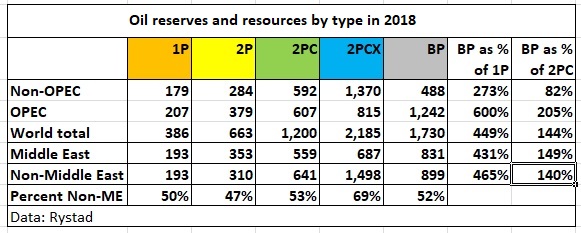
Fig 12: Extract from Rystad’s oil reserve table
We see that BP’s so-called proved reserves are somewhere between 2PC and 2CPX reserves/resources. The Non-Middle East share of all reserve types 1P, 2P and 2PC is around 50%. The 641 Gb of 2PC reserves are higher than the 470 Gb above mainly because of higher 2PC reserves in the US, Canada and Brazil. Note that 641 Gb are only 37% of BP’s mixed bag of 1,730 Gb.
This supply situation warrants further analysis.
Tanker war 2019 continues
In the meantime, another tanker was holed, this time an Iranian tanker (SABITI)
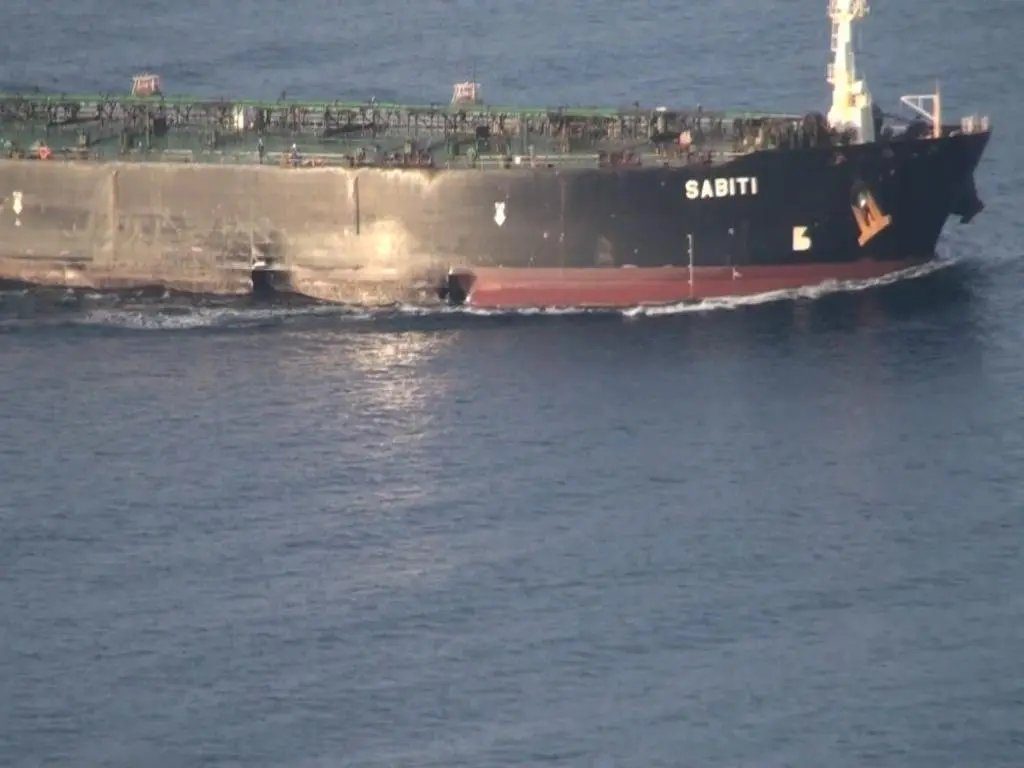
Fig 12: SABITI hull damage
https://www.gulf-times.com/story/644208/Iran-decries-cowardly-attack-on-oil-tanker

Fig 13: SABITI oil spill in the Red Sea
Conclusion:
At present, the Middle East is practically left to its own devices as the US seems to disengage itself form this part of the world. Just pulling out 2,000 US troops from Syria is leading to a new war in which Turkey is invading Syria. We have no idea what will happen in the Middle East next. We better get prepared to live with much less oil than we take for granted.