Australia comes up with yet another grand energy policy in which gas is supposed to deliver dispatchable (peak) power. From the Prime Minister’s website:
NATIONAL ENERGY GUARANTEE TO DELIVER AFFORDABLE, RELIABLE ELECTRICITY
17/10/2017
“….delivering more gas for Australians before it’s shipped offshore”
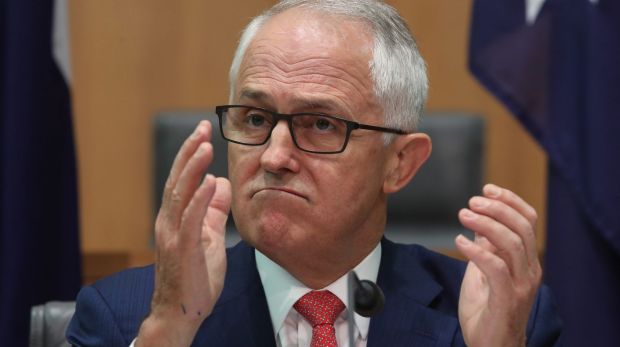
Fig 1: Turnbull’s game changer and level playing field. Convincing?
https://www.pm.gov.au/media/2017-10-17/national-energy-guarantee-deliver-affordable-reliable-electricity
Let’s see how this miracle was achieved. The year 2017 didn’t start well. In February NSW had load shedding of 300 MW for a couple of peak hrs during which an aluminium smelter had to be partially turned off.
14 Feb 2017 NSW’s privatized giveaway coal plant causes load shedding in extreme weather
http://crudeoilpeak.info/nsws-privatized-giveaway-coal-plant-causes-load-shedding-in-extreme-weather
Turnbull’s gas walks to Canossa
Historical context: Prime Minister Turnbull, as Environment Minister under Howard, approved massive LNG export projects from Western Australia without a national domgas policy in place including imposing on the gas industry a condition to build a pipeline to the east, where conventional gas reserves were already known to be limited, as described in this excerpt from Howard’s energy white paper 2004:
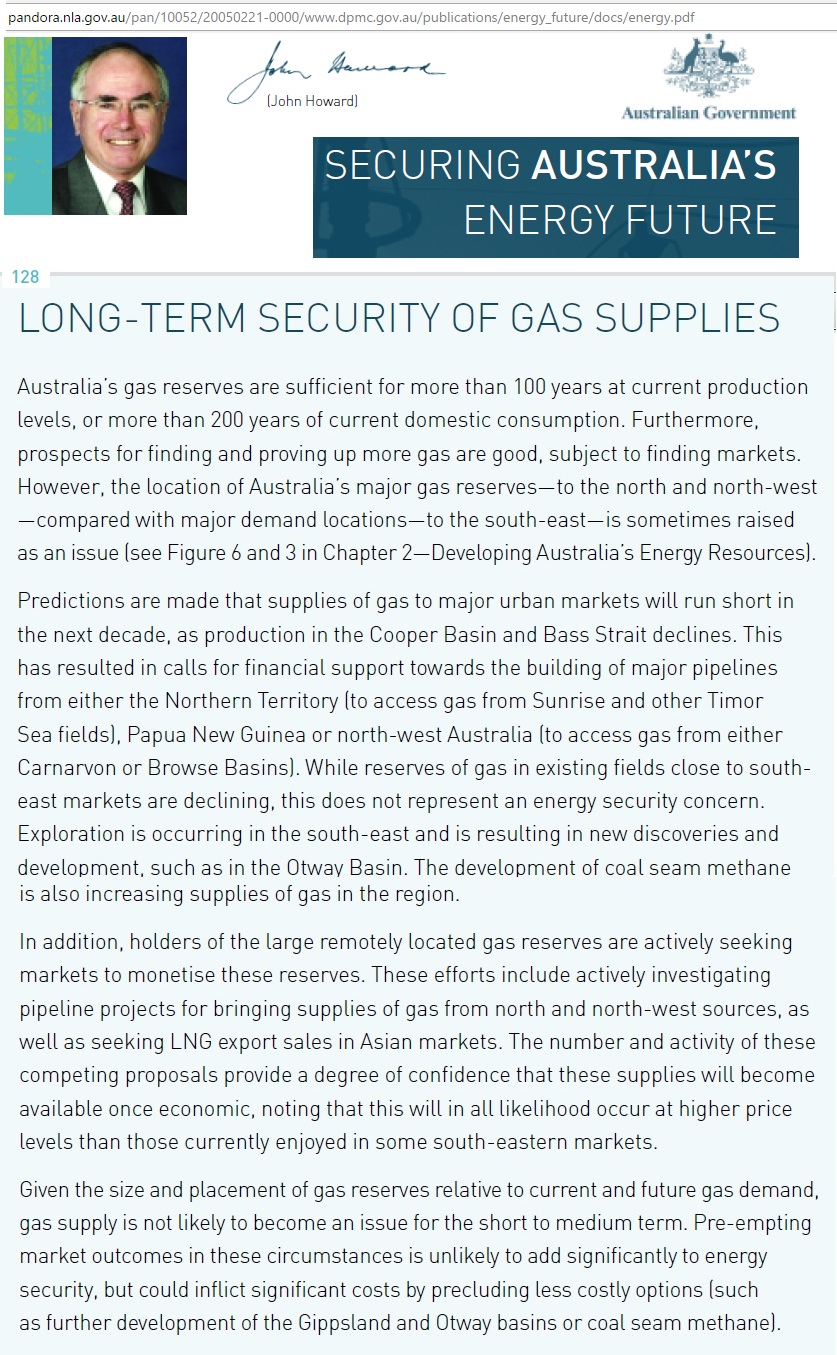
Fig 2: Howard on gas in June 2004
More details are here:
27/3/2017 Howard’s energy super power stuck in domestic gas shortages
http://crudeoilpeak.info/howards-energy-superpower-stuck-in-domestic-gas-shortages
Yes, wrong decisions go back that far. Howard’s slogan was followed up when Rudd came to power in 2007. His copycat Energy Minister Martin Ferguson promoted the same LNG export projects on the East coast, using Queensland’s coal seam gas (because there was not enough conventional gas).
The 1st episode in Turnbull’s Canossa walk this year started in March:
15/3/2017 Malcolm Turnbull strikes deal with gas suppliers
http://www.abc.net.au/7.30/malcolm-turnbull-strikes-deal-with-gas-suppliers/8357870
Just 194 days later he had to announce:
“Gas crisis ‘three times bigger’ than thought, Malcolm Turnbull says”
25/9/2017
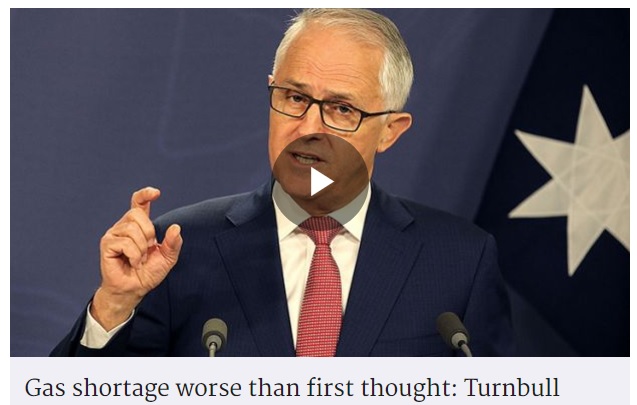
Fig 3: Turnbull indicating size of shortage in 2018
“It’s estimated there will be a shortfall … of around 110 petajoules of gas – more than three times the figure we were advised earlier in the year,” Mr Turnbull said.
http://www.smh.com.au/federal-politics/political-news/gas-crisis-three-times-bigger-than-thought-turnbull-says-20170925-gyo418.html
A week later he had the unpleasant experience of a 2nd gas walk to Canossa
REMARKS – THE AUSTRALIAN EAST COAST DOMESTIC GAS SUPPLY COMMITMENT
3/10/2017
PRIME MINISTER: We’ve met again with you the heads of the three big east coast gas exporters and I want to thank you for your cooperation and the assurances, the commitments you’ve given to ensure that the east coast gas market will be supplied so the domestic gas shortage about which we were so concerned will not arise.
The commitment today, which you’re making is to offer sufficient gas to meet the expected shortfall and any emerging shortfall through the good faith offering of gas to the domestic market on reasonable terms.
These commitments are vitally important to ensure Australian jobs and to ensure Australians have affordable and reliable energy and including electricity – gas being a more important fuel than ever in the generation of electricity.
I want to thank you very much for those commitments and by ensuring that there will not be a shortfall of gas next year, that means we will not be required to place restrictions on exports.
https://www.pm.gov.au/media/2017-10-03/remarks-australian-east-coast-domestic-gas-supply-commitment
Turnbull’s clever energy bureaucrats have now turned this into a guarantee without being able to change the geology of gas fields.
Where does this gas shortage number of 110 PJ come from? It can be found in a scenario called “uncertainty”, as shown in table 1 of the Sep 2017 update in the series of AEMO’s gas statement of opportunities:
AEMO’s GSOO Sep 2017 Update
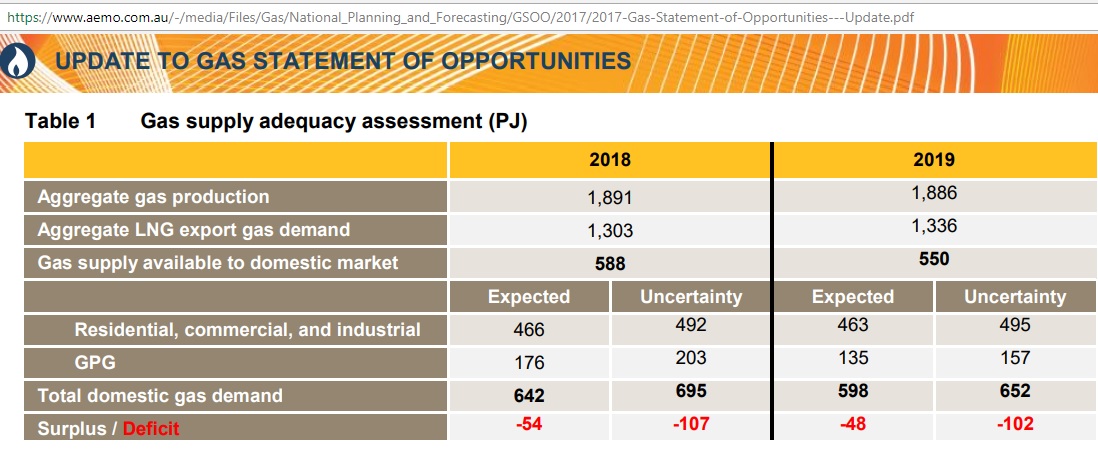
Fig 4: Gas supply deficits identified in Sep 2017 update
https://www.aemo.com.au/-/media/Files/Gas/National_Planning_and_Forecasting/GSOO/2017/2017-Gas-Statement-of-Opportunities—Update.pdf
Let’s put the upper part of the table into a graph, adding the numbers from 2017:
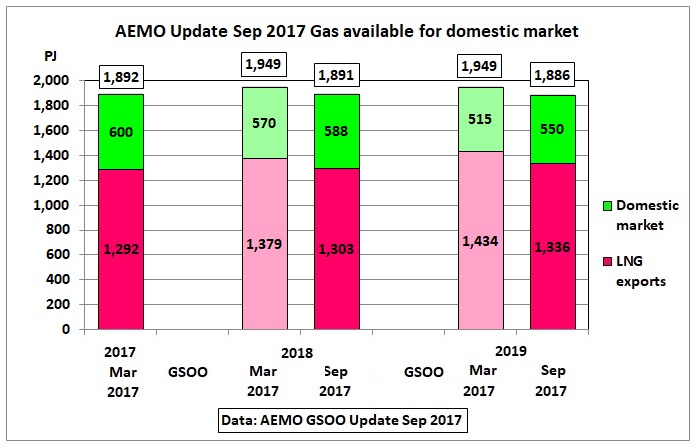 Fig 5: Gas available for domestic market vs LNG exports
The term “gas supply available to domestic market” means that LNG exports have priority. Whatever the LNG demand, it is deducted from production (total above columns, adjusted for storage withdrawal) and the balance is available for domestic consumption. It is just the opposite of what the Prime Minister said in his “National Energy Guarantee”.
Fig 5 shows that the gas available for the domestic market is declining from 600 PJ in 2017 to 550 PJ in 2019 or 8%. It should be crystal clear that there will be a continuing conflict between LNG export requirements (depending on publically unknown contractual obligations, global demand and pricing) and the domestic market. No politically motivated, declared “guarantee” can change that. It was wrong to connect the domestic gas market with the global gas market via LNG exports. That cannot be undone.
How do the numbers in the above table (Fig 4) fit into the long term gas production/demand balance estimated by AEMO in March 2017? This is the original graph:
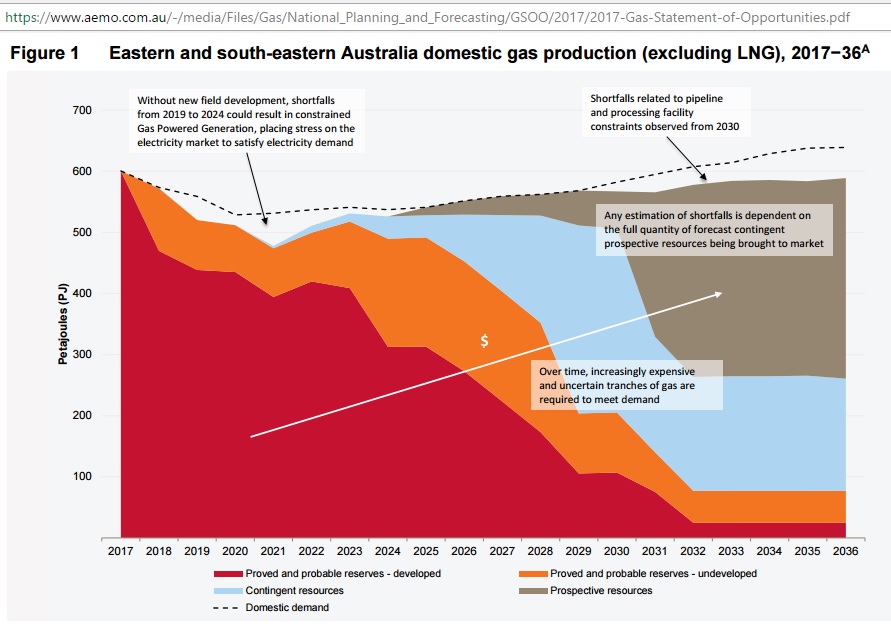
Fig 6: Domestic 2P gas production decline and demand (March 2017)
Let’s add the updated gas demand and availability numbers into the above graph:
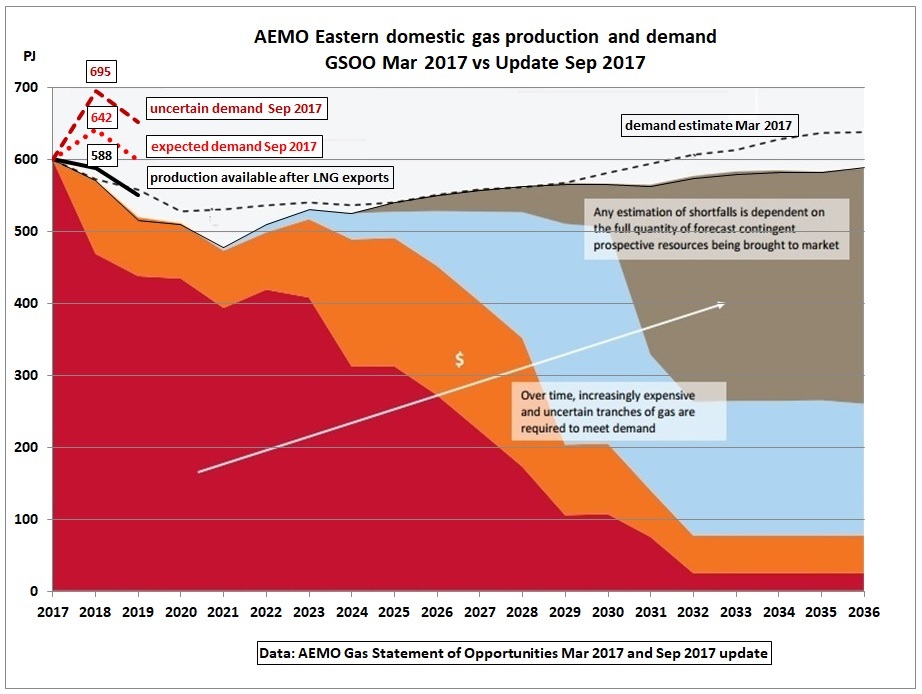 Fig 7: As Fig 6, but with updated demand and gas availability
It is easy to see how the curves diverge and leave a gap. AEMO has done a diligent job to estimate supply and demand. This exercise is difficult because the introduction of LNG has tripled gas volumes and therefore uncertainties and error margins for the much smaller domestic market.
AEMO has analysed many assumptions and parameters including use of gas powered generation (GPG) which competes with or replaces coal or complements intermittent renewables. It is doubtful whether the hastily announced NEG “policy” has quantitatively modelled the many factors at play. AEMO’s job for the National Gas Forecasting Report due in December 2017 will be challenging to say the least.
Let’s look at gas supplies for power generation because this will impact on the reliability of electricity during peak demand periods as shown in this graph (red area):
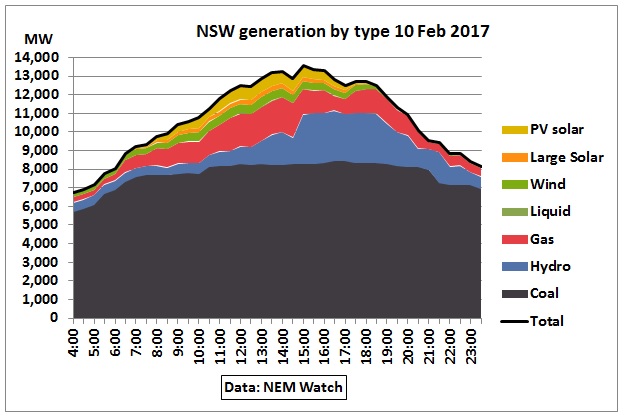 Fig 8: Generation by fuel type on a hot day in NSW
Gas demand
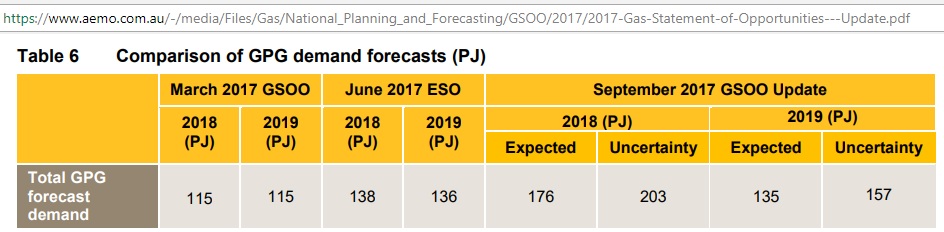 Fig 9: From AEMO’s September 2017 update:
The demand increase for GPG in 2018 is 61 PJ, or 53% above the level estimated in March 2017. That is a big difference. It’s shown in the next graph:
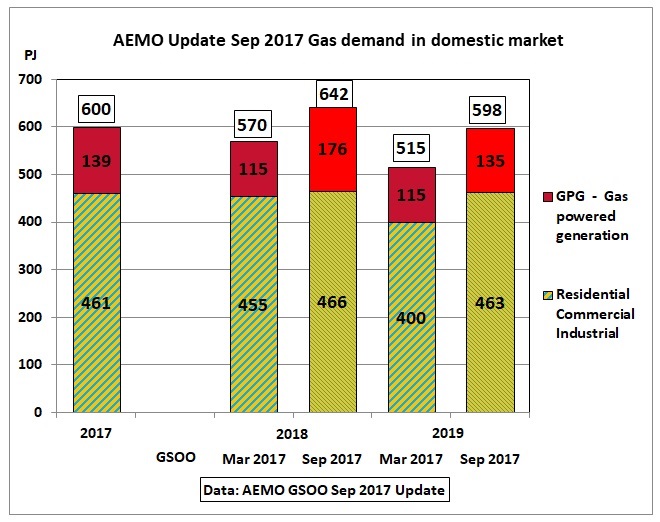 Fig 10: Gas powered generation and residential, commercial & industrial gas demand
These high levels of requirements for GPG were previously not forecast for another 10 years:
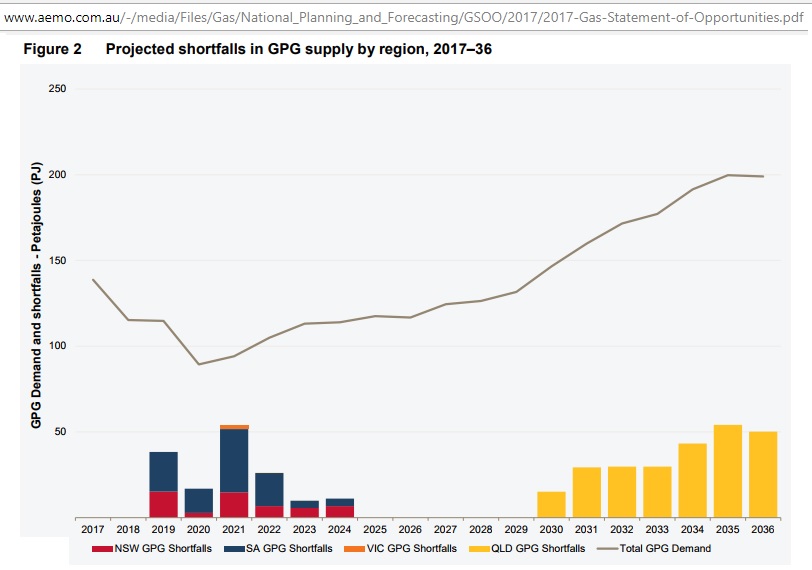
Fig 11: Gas needed for power generation as estimated in Mar 2017
This shows how sensitive the domestic gas supply system has become.
The gas demand numbers in the March 2017 GSOO (dashed lines in Figs 6 and 7) can be found in the XLS file “2017 GSOO modelling data – neutral scenario.XLS”. They are by State, not sector.
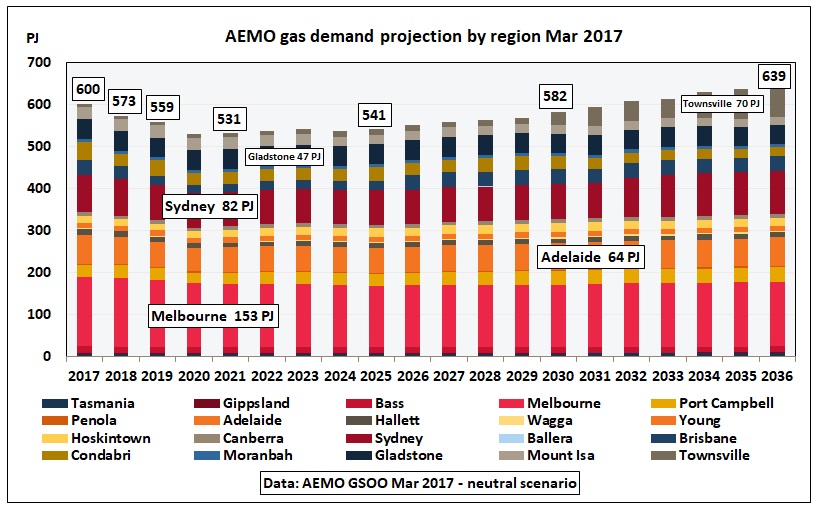 Fig 12: Gas demand by State and region
As an example, we find 573 PJ = 458 + 115 PJ and 559 PJ = 444 + 115 PJ
In order to get an idea on which factors shape gas demand for residential, commercial and industrial sectors we look at the National Gas Forecasting Report Dec 2016.
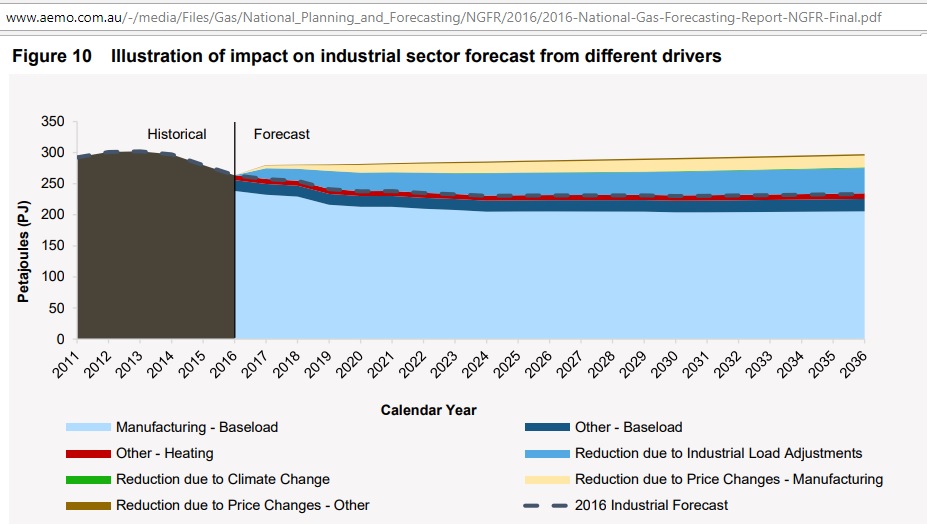 Fig 13: Drivers for industrial gas demand
Future industrial gas demand varies between 220 and 300 PJ pa.
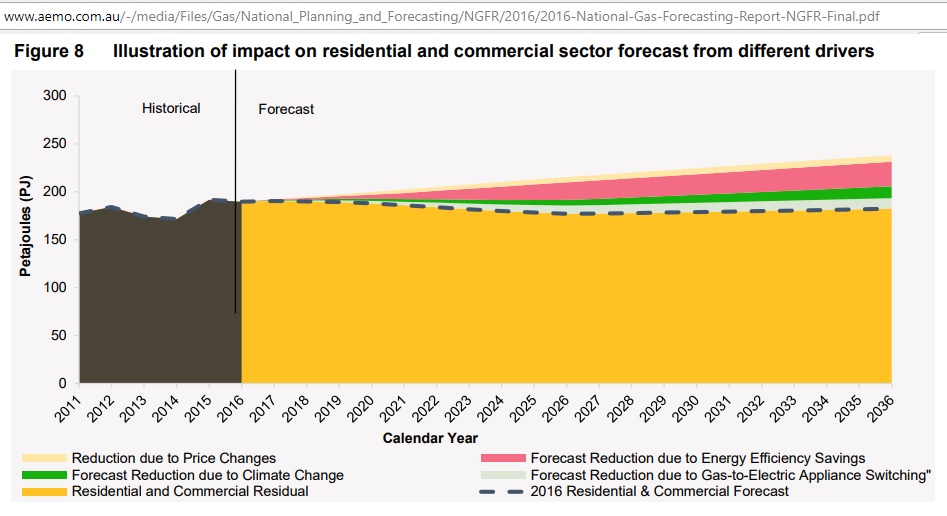 Fig 14: Factors impacting on residential and commercial gas demand
Future gas demand for residential and commercial sectors varies between 180 PJ and 230 PJ.
No attempt has been made in this post to reconcile the numbers in Fig 12 with the sum of Fig 11, 13 and 14.
Gas shortage equivalent to output of 2,000 MW power plant
How much energy is 107 PJ pa? We are using IEA’s conversion factors
https://www.iea.org/statistics/resources/unitconverter/
1 PJ of energy is 278 GWh. Using an efficiency factor of 0.48, 1 PJ of primary gas energy would generate a power output of 133 GWh. 107 GJ would therefore produce 14,231 GWh or the equivalent of a 2,000 MW coal fired power plant running at 81% capacity (0.81 x 2 GW x 24 hrs x 365 days). For comparison, Liddell’s output in 2015/16 was 7,800 GWh (average 890 MW). So this is the 2nd energy whammy in 2017, after the closure of the Hazelwood power plant in Victoria (12,000 GWh) in March 2017.
Conclusion
Energy complacency and wrong decisions in the past are now taking terrible revenge. The eastern domestic gas market will always be linked to the vagaries of LNG exports. To give a guarantee on secure electricity supplies which depend on gas powered peaking plants seems to be premature.
To be continued:
Peak conventional gas on Australia’s east coast
Related links:
7/4/2015
Australia’s alternative transport fuel: The East Coast gas-ship has sailed
http://crudeoilpeak.info/australias-alternative-transport-fuel-the-east-coast-gas-ship-has-sailed
9/7/2014
Energy Super Power Australia’s East Coast running low on affordable domestic gas
http://crudeoilpeak.info/energy-super-power-australias-east-coast-running-low-on-affordable-domestic-gas
9/5/2012
Queensland plans to export more than 10 times the gas NSW needs (part 3)
http://crudeoilpeak.info/queensland-plans-to-export-more-than-10-times-the-gas-nsw-needs-part-3
6/5/2012
Howard’s wrong decisions on offshore gas exports start to hit transport sector now
http://crudeoilpeak.info/howards-wrong-decisions-on-offshore-gas-exports-start-to-hit-transport-sector-now
7/11/2011
Why coal seam gas will not reduce CO2 emissions
http://crudeoilpeak.info/why-coal-seam-gas-will-not-reduce-co2-emissions
13/10/2011
NSW gas as transport fuel. Where are the plans?
http://crudeoilpeak.info/nsw-gas-as-transport-fuel-where-are-the-plans
11/10/2011
Australia’s natural gas squandered in LNG exports
http://crudeoilpeak.info/australias-natural-gas-squandered-in-lng-exports
28/9/2011
Submission to NSW coal seam gas Inquiry
http://crudeoilpeak.info/wp-content/uploads/2011/02/Submission_NSW_CSG_Inquiry_Sep2011.pdf
29/9/2010
Where will the natural gas come from for a transition to CNG/LNG as transport fuel?
http://www.crudeoilpeak.com/?p=1902
13/4/2010
Natural gas liquids and other liquids mitigate crude oil peak
http://www.crudeoilpeak.com/?p=1352