Categories
- Africa
- Algeria
- Angola
- Asia
- Australia
- Australia Budget
- Australia Transport
- Australian Mining
- Australian natural gas
- Australian rail
- Australian refineries
- Aviation
- BP
- BP Statistical Review
- Cars
- China
- Coal Seam Gas
- Crude oil analysis
- Debt
- Egypt
- Europe
- Feature1
- Global
- Hormuz
- India
- Iran
- Iraq
- Japan
- Korea
- Kuwait
- Latin America
- Libya
- Malaysia
- Middle East
- Motorways
- New South Wales
- North Sea
- OPEC
- Peaky Leaks
- Persian Gulf
- Power Supply
- Qatar
- Russia
- Saudi Arabia
- Shale gas
- Shell
- Shipping
- Singapore
- South East Asia
- Sudan
- Sydney
- Sydney Metros
- Syria
- Taiwan
- Tony Abbott Australian PM
- Ukraine
- United Arab Emirates
- United Kingdom
- United States
- Venezuela
- Vietnam
Sidebar menu
- Net oil importers
- Oil Exports
- Crude oil imports
- Downloads
- Latest Graphs
- Oil price analysis
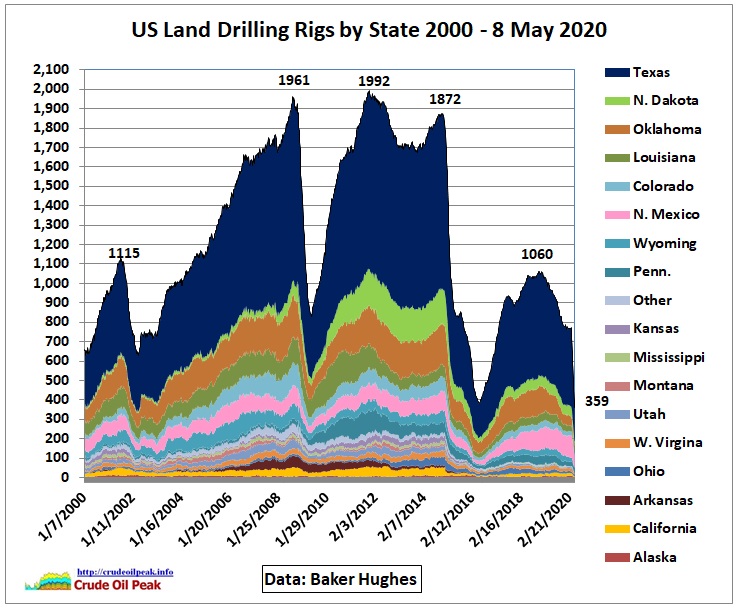 US drilling rig count
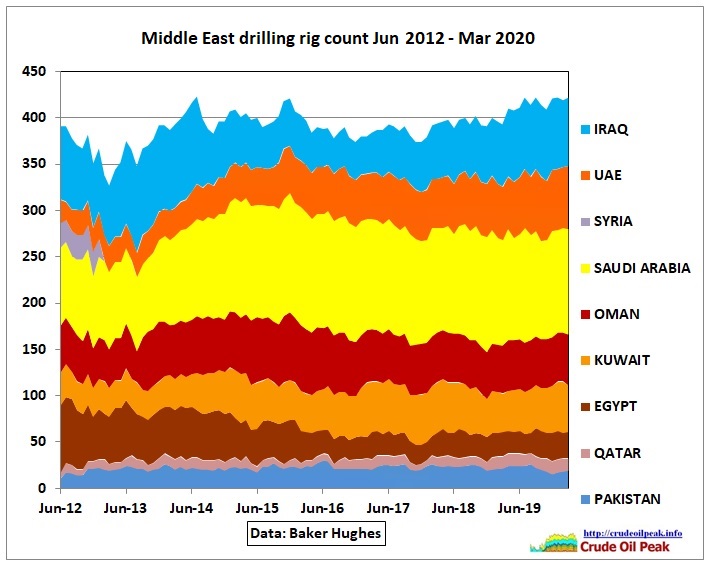 International drilling rig count
- Australian fuel prices
- Diary
- International oil companies
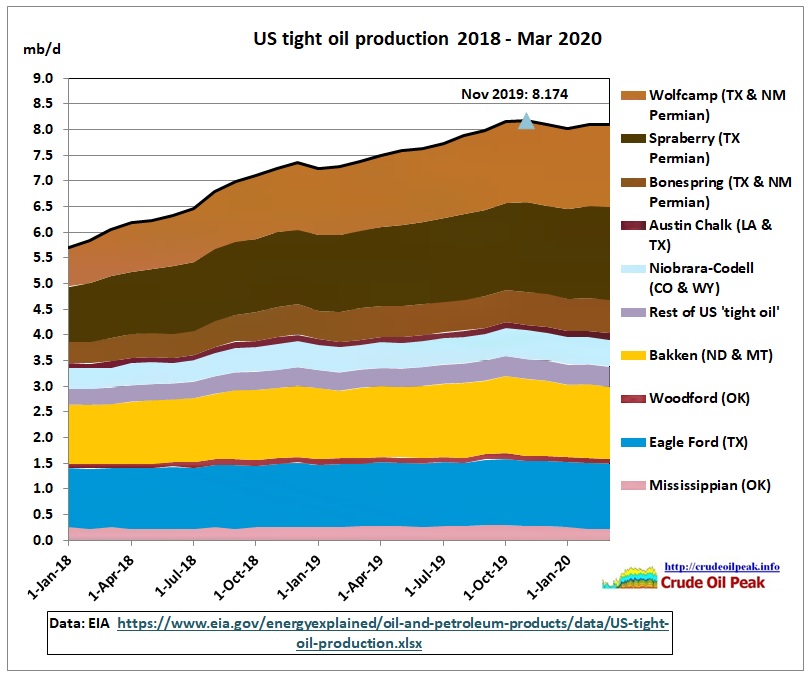 US tight oil production
 China peak oil
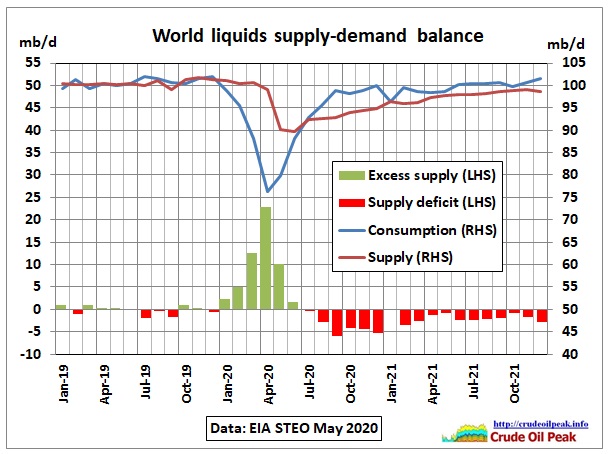 World liquids supply – demand balance
 Tankers arriving and departing in Sydney
 Australian oil and fuel imports
-
Global Archive
-
![The IEA (in Paris) proudly announced in its latest September 2018 Monthly Oil Market Report that global supplies (of liquids) have reached 100 mb/d in August, an impressive figure. What […]](https://crudeoilpeak.info/wp-content/uploads/World_crude_production_1994-May2018-1-115x115.jpg "What happened to crude oil production after the first peak in 2005?")
What happened to crude oil production after the first peak in 2005?
Posted on September 18, 2018 | No CommentsThe IEA (in Paris) proudly announced in its latest September 2018 Monthly Oil Market Report that global supplies (of liquids) have reached 100 mb/d in August, an impressive figure. What […] -
![In this post we look at crude oil production in the World Energy Outlook released in November 2017 Fig 1: WEO 2017 oil supply Note that the 5 year interval table […]](https://crudeoilpeak.info/wp-content/uploads/IEA_WEO_2017_crude_comparison_2016-115x115.jpg "Does the IEA try to hide the conventional crude oil peak in its 2017 World Energy Outlook?")
Does the IEA try to hide the conventional crude oil peak in its 2017 World Energy Outlook?
Posted on December 3, 2017 | No CommentsIn this post we look at crude oil production in the World Energy Outlook released in November 2017 Fig 1: WEO 2017 oil supply Note that the 5 year interval table […] -
![Fig 1: Iraqi crude exports by SOMO The above graph shows Iraqi crude oil exports by the SOMO oil marketing company. Until March 2014 Kirkuk crude from North Oil Company […]](https://crudeoilpeak.info/wp-content/uploads/Kirkuk_oil_production_1934-2016_Rystad-Hubbert-115x115.jpg "The Fight for Northern Iraq’s remaining oil")
The Fight for Northern Iraq’s remaining oil
Posted on November 22, 2017 | No CommentsFig 1: Iraqi crude exports by SOMO The above graph shows Iraqi crude oil exports by the SOMO oil marketing company. Until March 2014 Kirkuk crude from North Oil Company […] -
![Shell’s upstream earnings1) were in the red since the 1st quarter of 2015 according to first half 2016 reports. Earnings peaked at US$ 6 bn in the 2nd quarter of […]](https://crudeoilpeak.info/wp-content/uploads/Shell_Upstream-earnings_1Q2005-2Q2016-115x115.jpg "Royal Dutch Shell’s upstream earnings peaked 2008, now in the red")
Royal Dutch Shell’s upstream earnings peaked 2008, now in the red
Posted on October 16, 2016 | No CommentsShell’s upstream earnings1) were in the red since the 1st quarter of 2015 according to first half 2016 reports. Earnings peaked at US$ 6 bn in the 2nd quarter of […] -
![In yesterday’s 7 pm news ABC TV business presenter Alan Kohler got carried away with the news that the US drilling rig count increased by 2 rigs in the last […]](https://crudeoilpeak.info/wp-content/uploads/Stability_USD_2011-2016-115x115.jpg "Australian public broadcaster a true believer in US shale oil supremacy")
Australian public broadcaster a true believer in US shale oil supremacy
Posted on September 27, 2016 | No CommentsIn yesterday’s 7 pm news ABC TV business presenter Alan Kohler got carried away with the news that the US drilling rig count increased by 2 rigs in the last […] -
![OPEC Fig 1: OPEC’s incremental crude oil production Incremental production for each country is the production above the minimum production for the period Jan 2000 – May 2016 (the latest […]](https://crudeoilpeak.info/wp-content/uploads/World_Incremental_crude_production_2000-May2016-115x115.jpg "Incremental crude production update August 2016")
Incremental crude production update August 2016
Posted on September 11, 2016 | No CommentsOPEC Fig 1: OPEC’s incremental crude oil production Incremental production for each country is the production above the minimum production for the period Jan 2000 – May 2016 (the latest […] -
![BP Statistical Review: proved reserves not so proven We start with what most people will do, the BP Statistical Review (latest version June 2016). The review’s Excel file contains a […]](https://crudeoilpeak.info/wp-content/uploads/Oil_reserves_function-of-price-115x115.jpg "Oil reserves and resources as function of oil price")
Oil reserves and resources as function of oil price
Posted on August 19, 2016 | No CommentsBP Statistical Review: proved reserves not so proven We start with what most people will do, the BP Statistical Review (latest version June 2016). The review’s Excel file contains a […] -
![We pick up the question from part 1: Fig 11: Homework for governments Let’s have a look where all the net imports into Asia have come from in the past: […]](https://crudeoilpeak.info/wp-content/uploads/Asia_oil_production_consumption_2005-2015_fill_in-2035-115x115.jpg "Peak Oil in Asia and oil import trends (part 2)")
Peak Oil in Asia and oil import trends (part 2)
Posted on June 25, 2016 | No CommentsWe pick up the question from part 1: Fig 11: Homework for governments Let’s have a look where all the net imports into Asia have come from in the past: […] -
![After a delay of several months the US Energy Information Administration has published the latest international energy statistics for October 2015 This is an opportunity to update crude oil graphs […]](https://crudeoilpeak.info/wp-content/uploads/2016/02/Incremental_crude_world_growth_decline_OPEC_US_Canada_2001_Oct2015-115x115.jpg "World outside US and Canada doesn’t produce more crude oil than in 2005")
World outside US and Canada doesn’t produce more crude oil than in 2005
Posted on February 14, 2016 | No CommentsAfter a delay of several months the US Energy Information Administration has published the latest international energy statistics for October 2015 This is an opportunity to update crude oil graphs […] -
![World Economic Forum The Transformation of Energy Fig 1: WEF energy panellists 22/1/2016 From right to left: moderator Daniel Yergin (IHS), Fatih Birol (IEA), Hiroaki Nakanishi (Hitachi), Ignacio Sánchez (Iberdrola), […]](https://crudeoilpeak.info/wp-content/uploads/2016/02/OIL_gas_investments_2005-2015_IEA-115x115.jpg "IEA in Davos 2016 warns of higher oil prices in a few years’ time")
IEA in Davos 2016 warns of higher oil prices in a few years’ time
Posted on February 9, 2016 | No CommentsWorld Economic Forum The Transformation of Energy Fig 1: WEF energy panellists 22/1/2016 From right to left: moderator Daniel Yergin (IHS), Fatih Birol (IEA), Hiroaki Nakanishi (Hitachi), Ignacio Sánchez (Iberdrola), […]