In this post we look at crude oil production in the World Energy Outlook released in November 2017
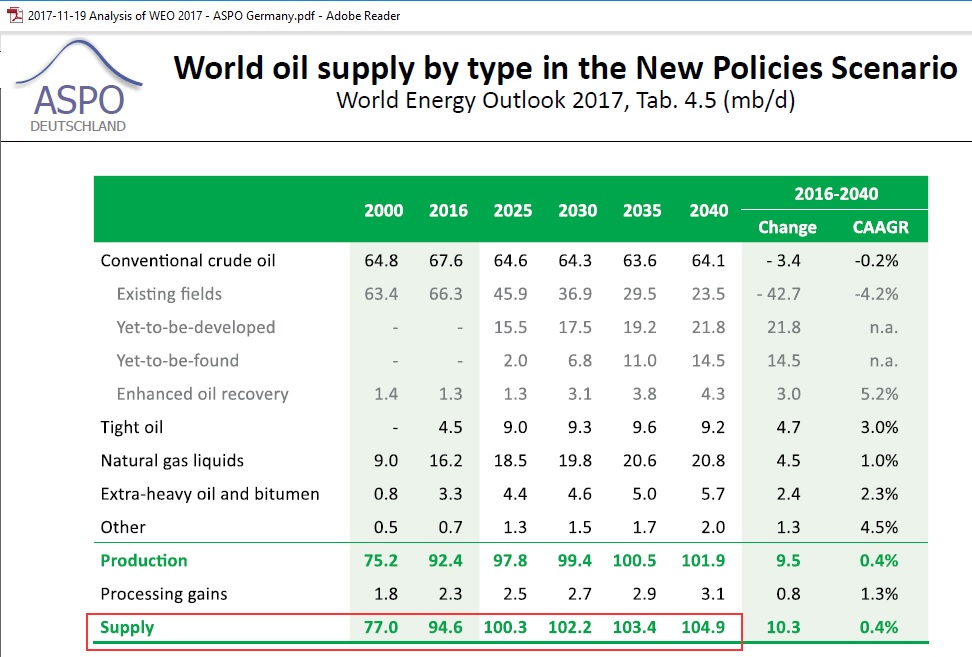
Fig 1: WEO 2017 oil supply
Note that the 5 year interval table omits 2005 and 2010. Is this to conceal the 2005 conventional peak (see Fig 6)? The immediately important year 2020 also isn’t there.
Let’s put the crude oil related data of the above table 4.5 into a graph, thereby interpolating between 2016 and 2025 for 2020.
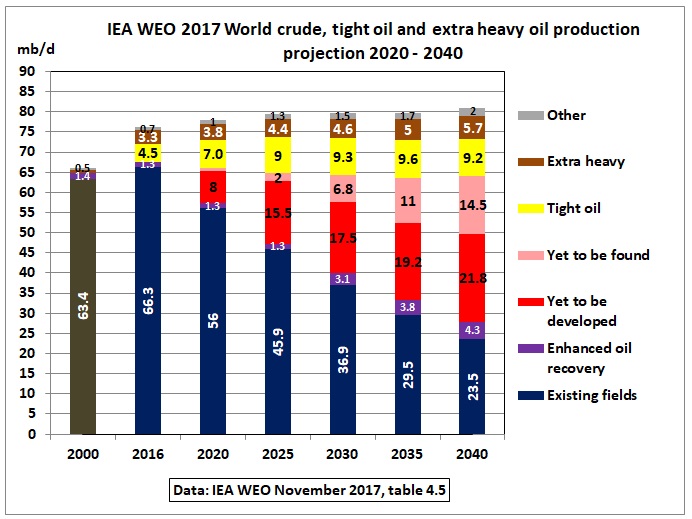
Fig 2: WEO 2017 crude oil
Production from existing conventional fields declines by around 4% pa to just 23.5 mb/d in 2040. Enhanced oil discovery, fields yet-to-be-approved and yet-to-be found are calculated in such a way that total conventional production does not decline much. The important message here is that it won’t grow. Only unconventional oil is assumed to bring growth in production.
Traditionally, the IEA calculated the “call on OPEC” as a balancing item between demand and Non-OPEC production. Maybe that call is no longer heard.
In Fig 2, the underlying methodology is more complex:
- Show perpetual production growth to match assumed demand growth
- Determine decline in existing fields
- Add enhanced oil recovery
- Add yet-to-be developed
- Add yet-to-be found so that conventional production declines only marginally or looks rather flat
- Stack on top growing tight oil and heavy oil to show overall growth
Let’s compare WEO 2017 with WEO 2016
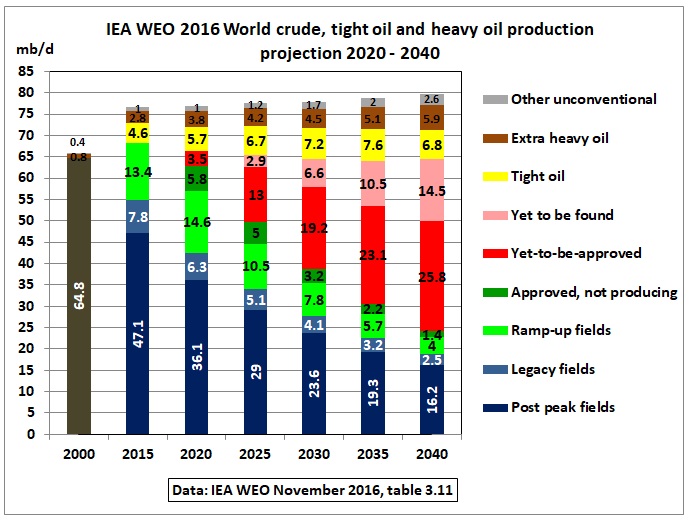
Fig 3: Crude production forecast in the WEO 2016
We can see that the WEO 2016 was more detailed on existing fields. It showed post peak oil fields (70%), legacy fields (10 %) and ramp-up fields (20 %).
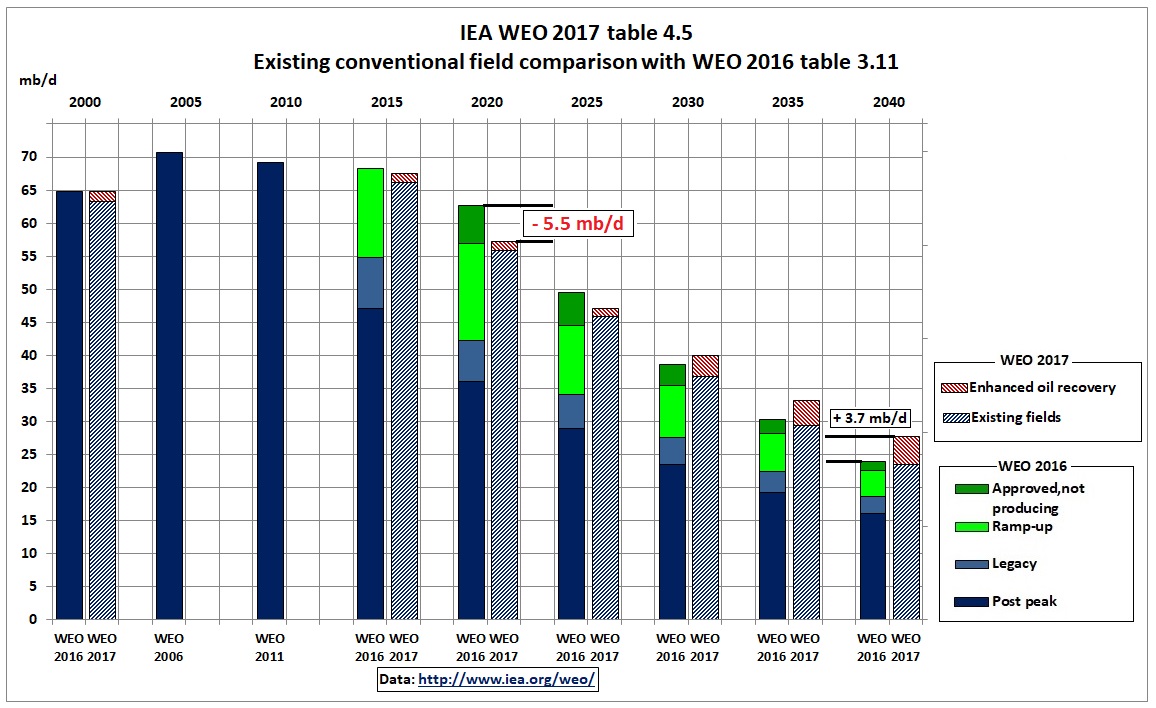
Fig 4: Comparison existing fields WEO 2017 -2016
In the above stacked clustered graph we see that “existing fields” in the WEO 2017 are lower and therefore decline is higher (up to 2025) than the 4 categories of the WEO 2016 report: post peak, legacy, ramp-up and approved-not producing plus enhanced oil recovery (EOR). One wonders why this detail was dropped in the WEO 2017. Note that for 2020 5.8 mb/d “approved-not-producing” in WEO 2016 have turned into “yet-to-be-developed” in WEO 2017.
Enhanced oil recovery
In the WEO 2013 (when oil prices were high), the contribution of EOR was 2.7 mb/d in 2035
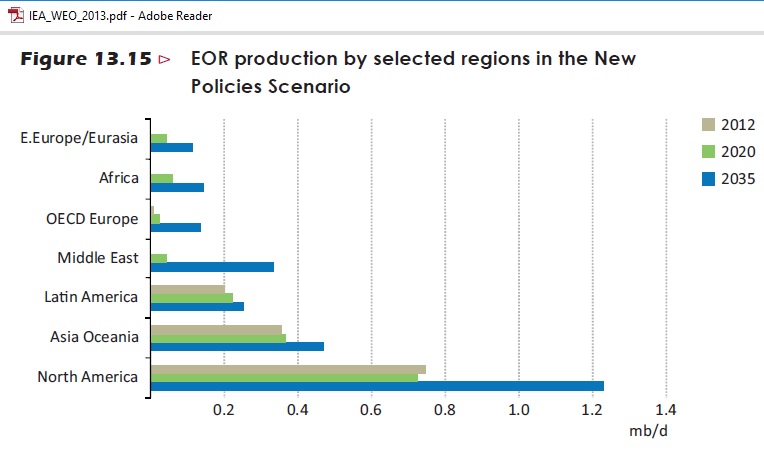 Fig 5: Enhanced oil recovery by region
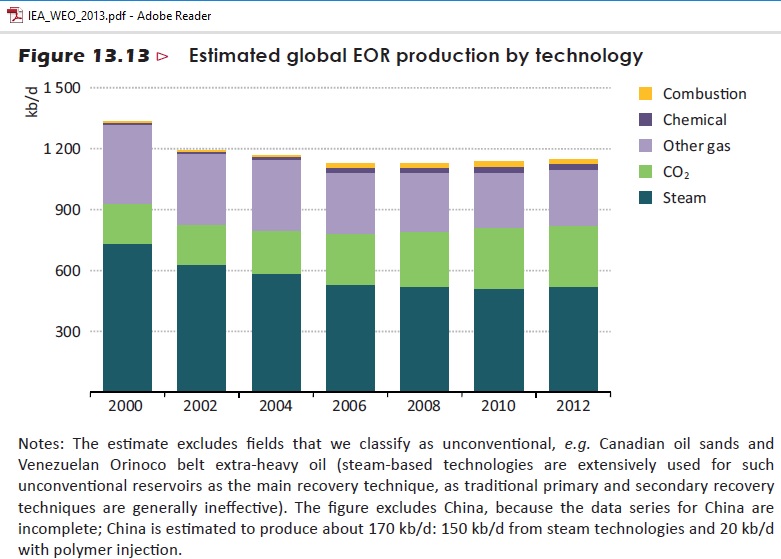
Fig 6: Enhanced oil recovery 2000-2012
In the WEO 2017, EOR is tripled after 2025 to reach 4.3 mb/d in 2040, suggesting it could be another balancing item to make conventional crude production appear higher. EOR in unconventional fields (e.g. CO2 flooding) is currently frontier territory.
Yet-to-be-approved and found
 Fig 7: Comparison fields yet to be developed/found WEO 2017 -2016
By 2020, requirements for new fields to be developed/ found increase by 5.3 mb/d compared to the WEO 2016. By 2040, 36.3 mb/d of new fields are needed, compared to 40.3 mb/d in the WEO 2016 report, a slight improvement and equal in size to the enhanced oil recovery.
Unconventional oil
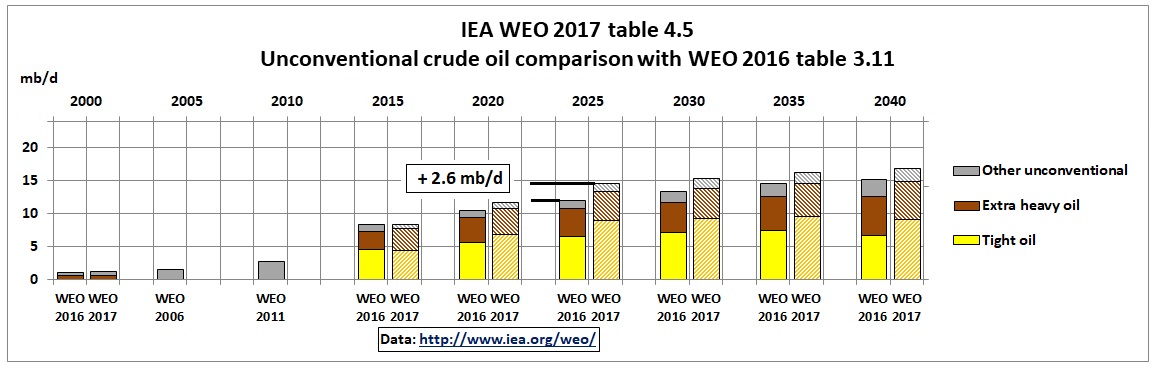
Fig 8: Comparison unconventional fields WEO 2017 -2016
Unconventional oil production in the WEO 2017 is now up to 2.6 mb/d higher than in 2016. Tight oil is 9.2 mb/d in 2040. This implies around 3 mb/d of tight oil from outside the US (Argentina, Russia, Canada). For the US, the EIA sees a maximum tight oil production of around 6 mb/d, especially after 2025 when production moves to less productive areas https://www.eia.gov/todayinenergy/detail.php?id=29932
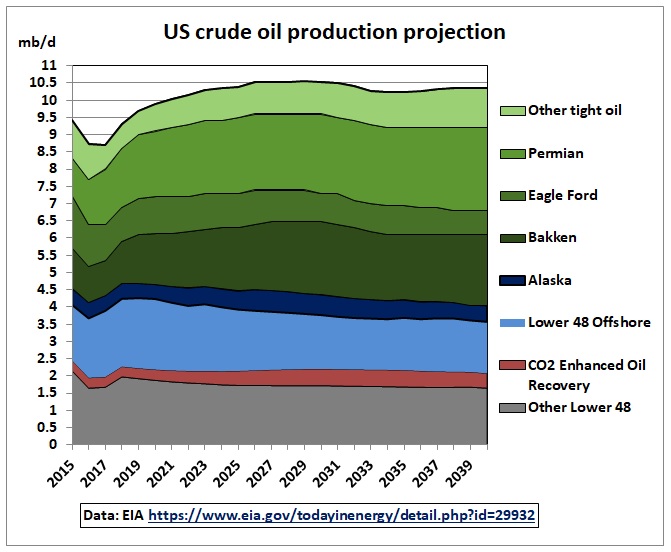
Fig 9: EIA projection (Feb 2017) tight oil 6.2 mb/d by 2040
https://www.eia.gov/todayinenergy/detail.php?id=29932
and
https://www.eia.gov/outlooks/aeo/data/browser/#/?id=14-AEO2017&cases=ref2017&sourcekey=0
Here are the latest US tight oil production data:
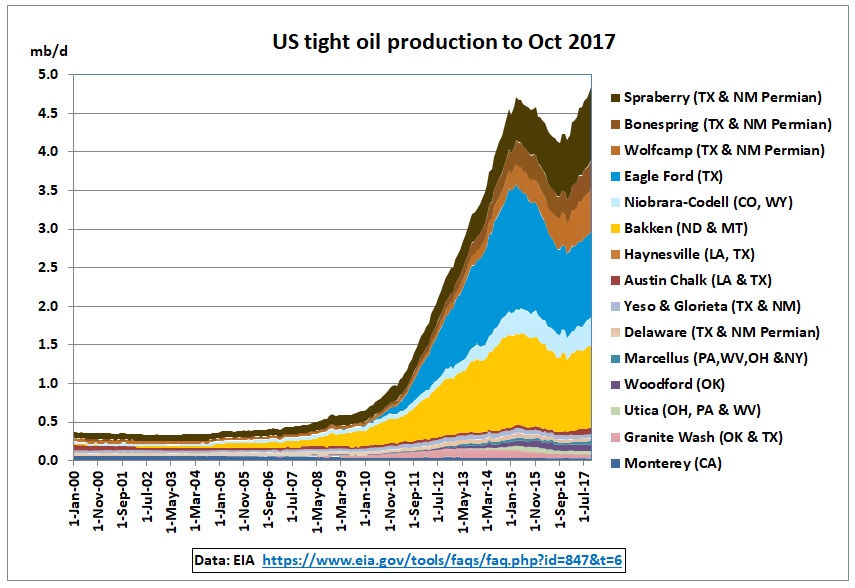
Fig 10: US tight oil production by the EIA
https://www.eia.gov/tools/faqs/faq.php?id=847&t=6
Bakken and Eagle Ford have already peaked. The only significant growth at present is from the Permian, i.e. Spraberry, Bonespring and Wolfcamp.
Extra heavy oil (from Venezuela and Canada) increases from 3.3 mb/d in 2016 to 5.7 mb/d in 2040.
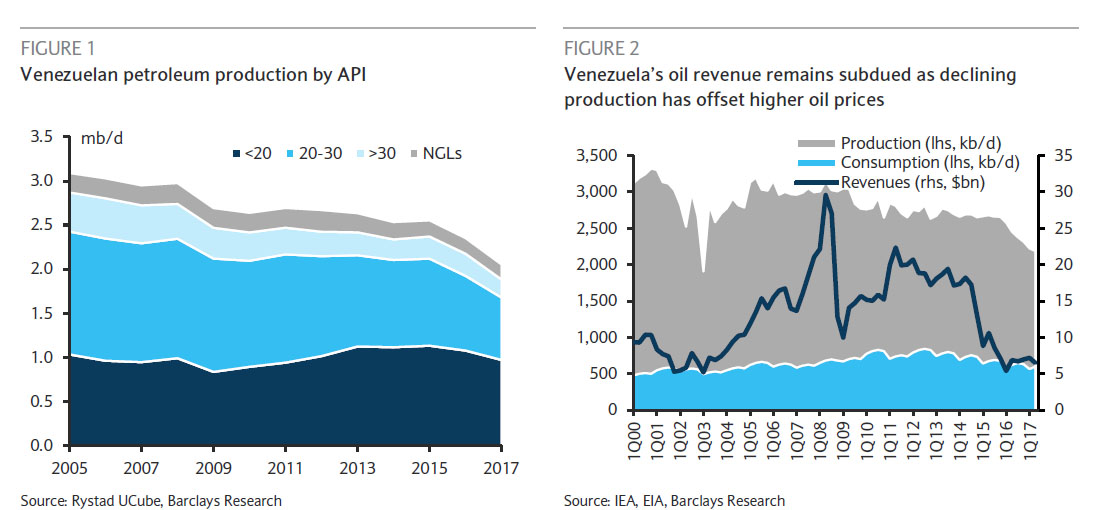
Fig 11: Venezuela oil production
https://oilprice.com/Energy/Crude-Oil/Barclays-Oil-Could-Rise-By-7-If-US-Sanctions-Venezuela.html
Venezuela’s heavy oil production (API < 20) from the Orinoco belt is around 1 mb/d and in decline as the country seems to continue at the brink of financial, economic and societal collapse.
In Canada:
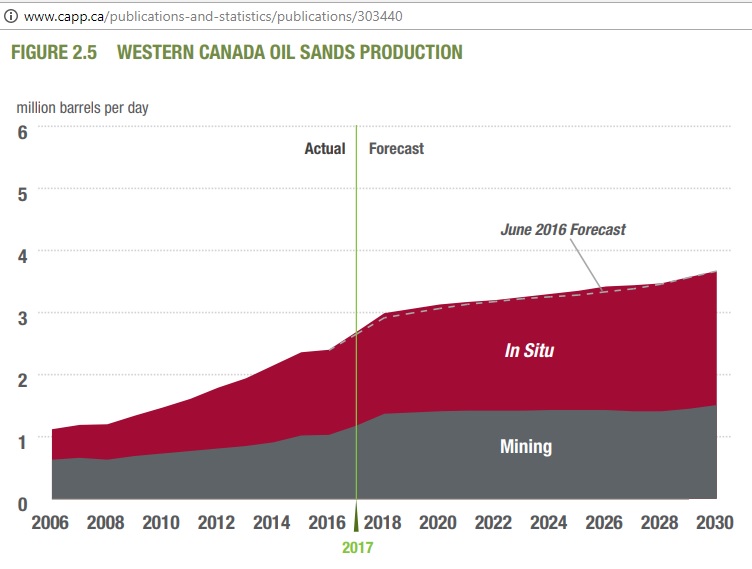 Fig 12: Canadian oil sands production
http://www.capp.ca/publications-and-statistics/publications/303440
The Canadian Association of Petroleum Producers published the above report in June 2017. Oil sands production is assumed to increase from 2.4 mb/d to 3.7 mb/d. This is most likely an optimistic outlook as it comes from producers who have their shareholders in mind.
Adding 1 mb/d from Venezuela and 3.7 mb/d from Canada gives 4.7 mb/d by 2030, practically the number given in IEA’s table 4.5. However, for both countries, these are production estimates on the high side.
All together now
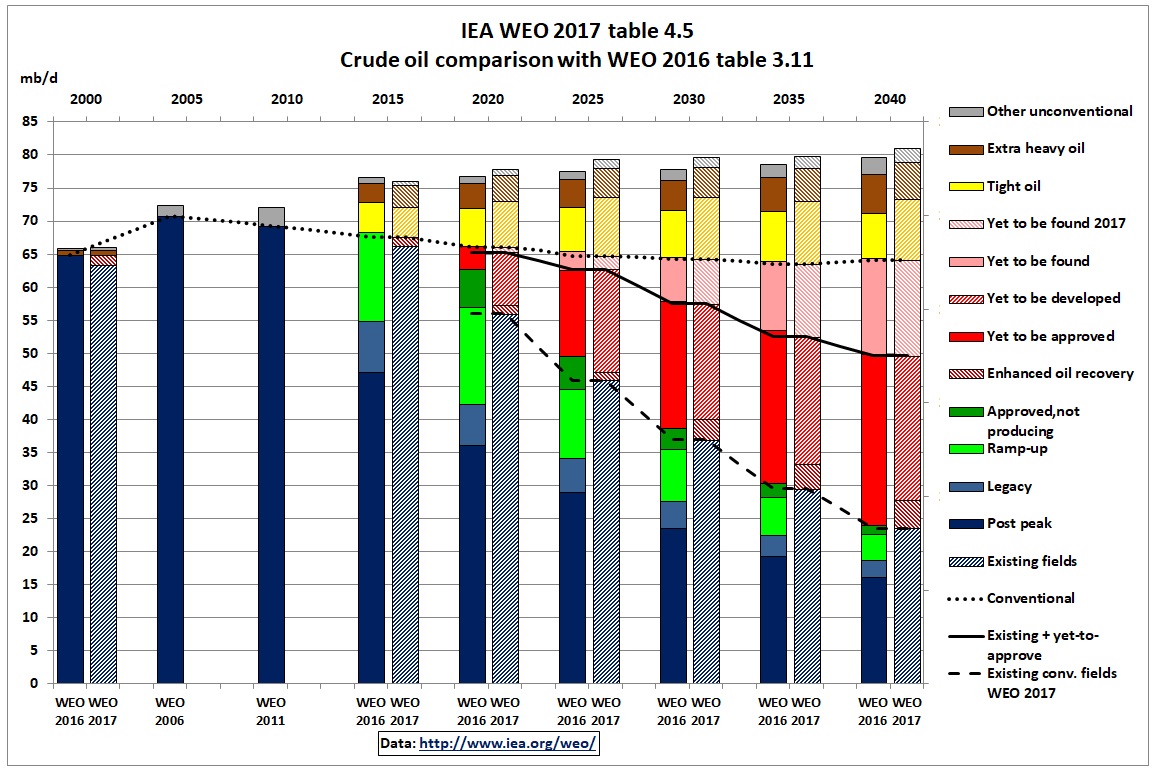 Fig 13: Production forecasts all types of oil
In the above graph, solid columns represent data from the WEO 2016, columns with patterns use data from the WEO 2017. We see that conventional crude production (dotted line) has peaked between 2005 and 2010 (WEOs go only in 5 years intervals). It’s covered up by unconventional oil with optimistic future production scenarios. “Yet-to-be-found” is a balancing item designed to show overall growth.
History of projections
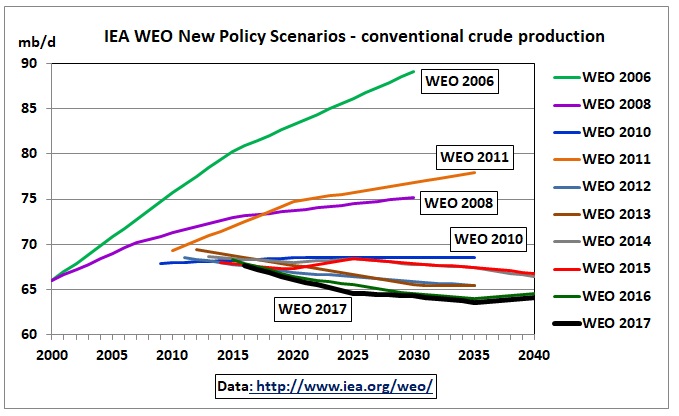 Fig 14: History of WEO projections of crude production
The WEO 2006 (one year after crude oil started to peak!) had the most optimistic projections, reaching almost 90 mb/d by 2030. In the year 2008 (oil price shock) the projection was dramatically reduced. The WEO 2010, one year after the financial crisis, had crude production practically flat. In 2011, projections were back up again as the US shale oil boom started. Since then, future production trends downward. The WEO 2017 is the lowest.
WEO 2004
The first time the IEA was showing a graph including decline in existing oilfields (-6.2%) was in 2004:
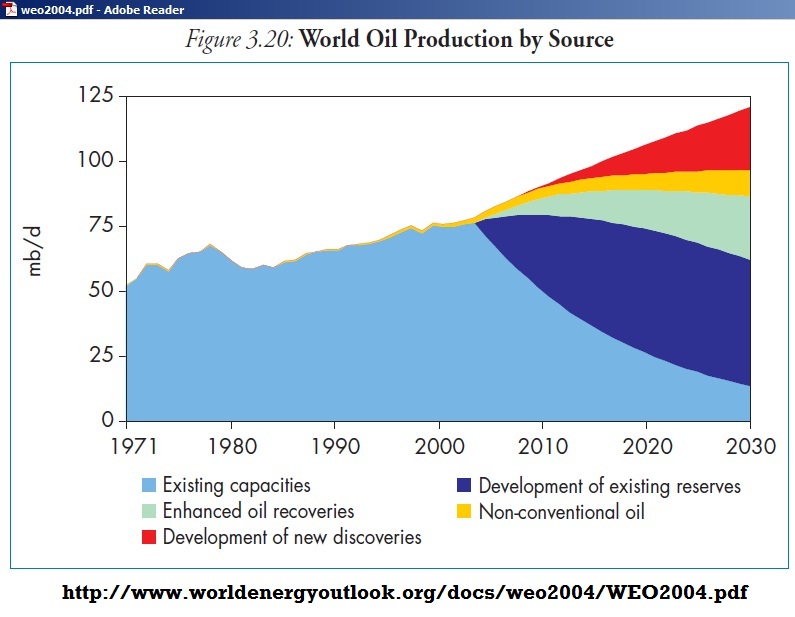
Fig 15: WEO 2004 world oil supply 994 Gb between 2004-2030
This is total oil production, not just crude oil. Note that the decline in production from existing reserves is more than compensated for by enhanced oil recovery (82 Gb or 8% of total). New discoveries, later called “yet-to-find” (115 Gb or 12%), provide for growth.
WEO 2008
This picture dramatically changed in 2008, when the IEA was rattled by an oil price shock and a public peak oil debate. The WEO 2008 did a detailed oil decline rate analysis never attempted before.
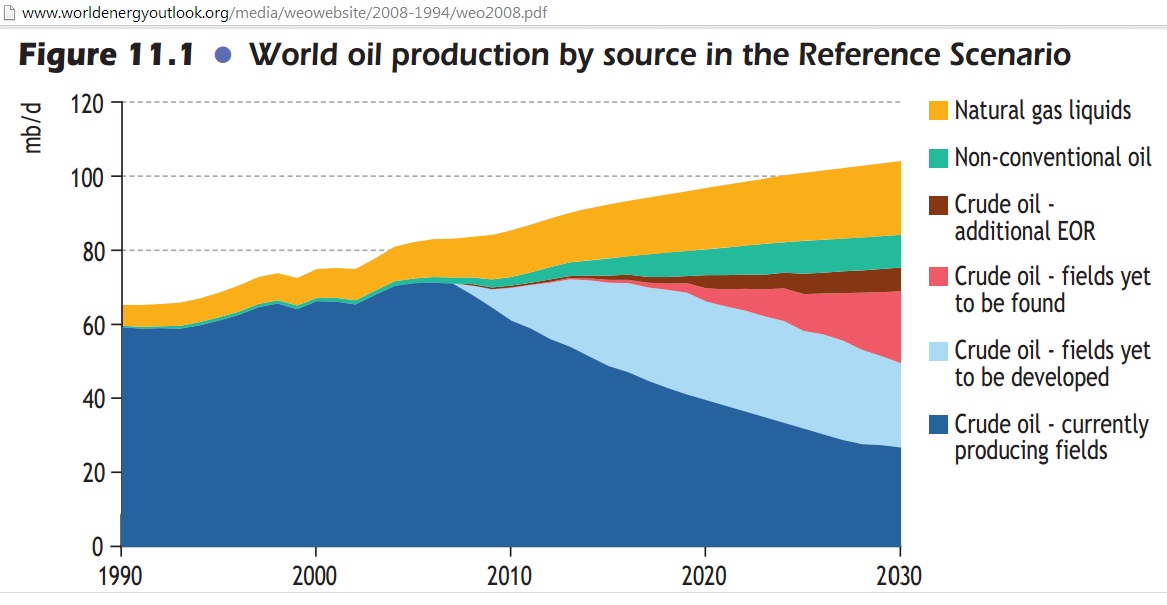 Fig 16: WEO 2008 oil production profile
Note that NGLs and unconventional oil are stacked on top of conventional crude oil which is forecast to be 75 mb/d in 2030. Enhanced oil recovery has shrunk and can no longer offset decline elsewhere. The wedge “fields yet to be found “ now has to do this job. The decline in existing fields is -4.5% pa (9% pa in post peak fields).
WEO 2010
We compare 2010, the 1st year after the doom and gloom year 2009, with 2017:
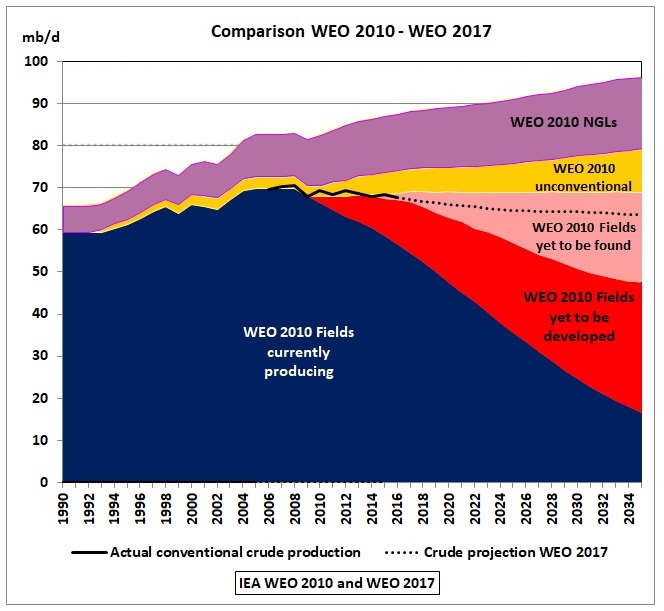 Fig 17: WEO 2010 with WEO 2017 projection
In the WEO 2010 “yet-to-be-found” was designed to keep conventional crude production flat, at 69 mb/d. No more. In the WEO 2017, conventional production is 3 mb/d lower in 2020 and 5.4 Mb/d lower in 2040.
Conclusion
Conventional crude oil production is going to decline, albeit at a slow target rate if projects are approved and new oil discovered in time to offset decline in existing fields.