
Fig 1: Oil crisis in China like in 2005? No. By order: Free roads for G20 in Hangzhou
https://www.theguardian.com/world/2016/aug/31/china-hangzhou-propaganda-facelift-g20-summit
Strategically published only days before the G20 summit the Wall Street Journal had an article on peak oil in China:
China’s Decline in Oil Production Echoes Globally
25/8/2016
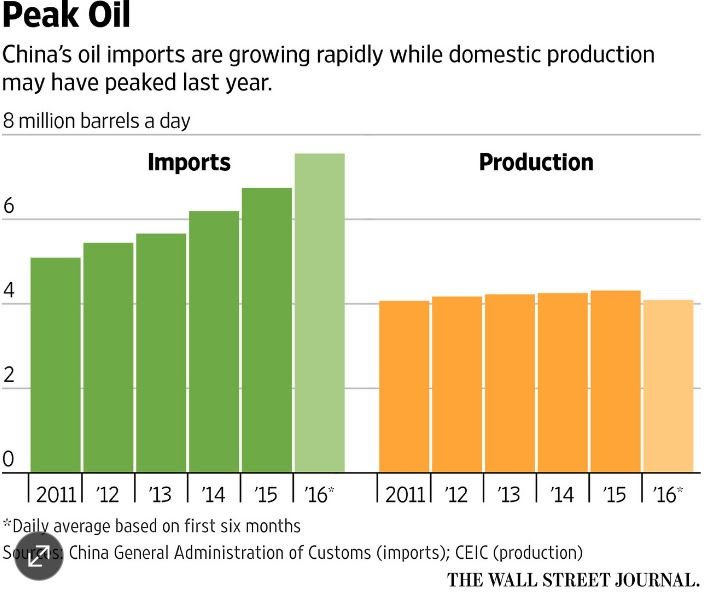
Fig 2: A flat production peak in China
http://www.wsj.com/articles/chinas-decline-in-oil-production-echoes-globally-1472122393
It hasn’t echoed during the G20 summit.
If China is at peak oil now, then China is where the US was in 1970, 45 years ago. Let’s first have a look at what happened in the US. We limit ourselves to 30 years because 2000 was the last “normal year” before 9/11 and the Iraq war.
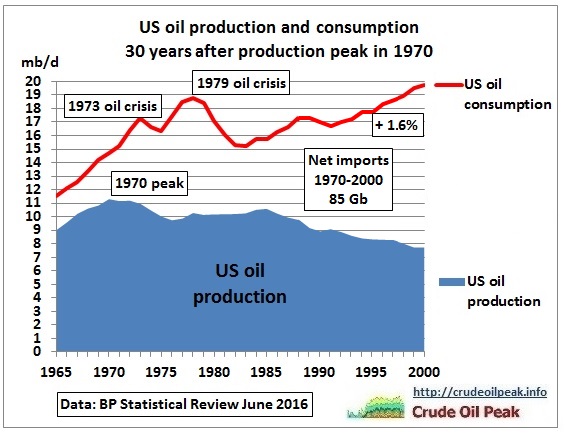
Fig 3: the first 30 years after the US oil peak
When US oil production peaked in 1970, US oil net imports were 3.4 mb/d. 30 years, 2 oil crises and 1 Desert Storm later the US imported 12 mb/d, a total of 85 Gb during that period.
Of course it is nearly impossible to compare the US and China. The IEA has a table on Chinese oil demand in its World Energy Outlook WEO 2015:
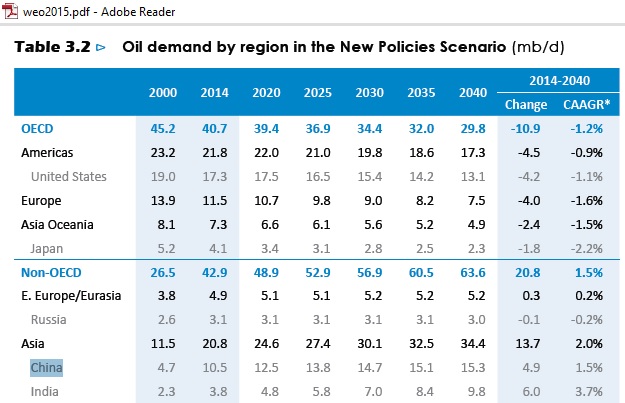
Fig 4: Oil demand table in the IEA World Energy Outlook 2015
http://www.worldenergyoutlook.org/weo2015/
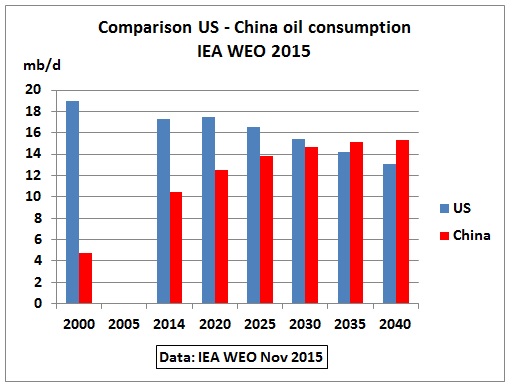
Note the opposing trends for the US and China:
Let’s put the Chinese consumption into a graph, together with an assumed production profile, (similar to Fig 3):
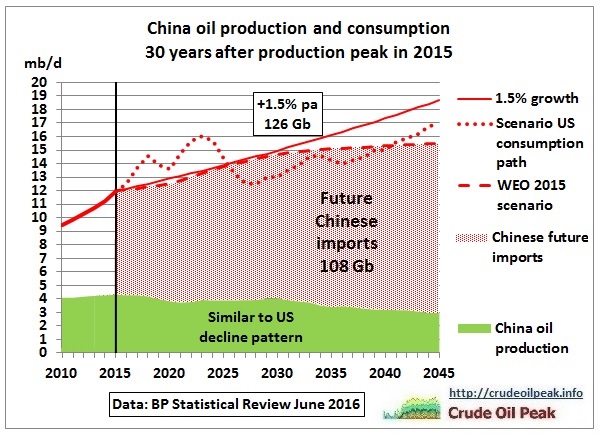
Fig 5: China’s oil imports for several scenarios
We assume that Chinese decline after peak production will follow the US pattern. On the consumption side the dashed line is the New Policies Scenario in the IEA WEO 2015, the thin straight line a 1.5% growth scenario starting with 2016. The IEA also assumes a CAAGR of 1.5% but applies it to a lower consumption level in 2014, explaining the difference in the later years.
For orientation and comparison, the dotted line shows the US consumption path shifted by 45 years to the Chinese consumption level in the production peak year 2015.
In 2015, China imported 7.7 mb/d (net), much more than the US in 1970. Therefore, China will import more oil (108-126 Gb) than the US in the equivalent period after peak oil, but less compared to its much higher population.
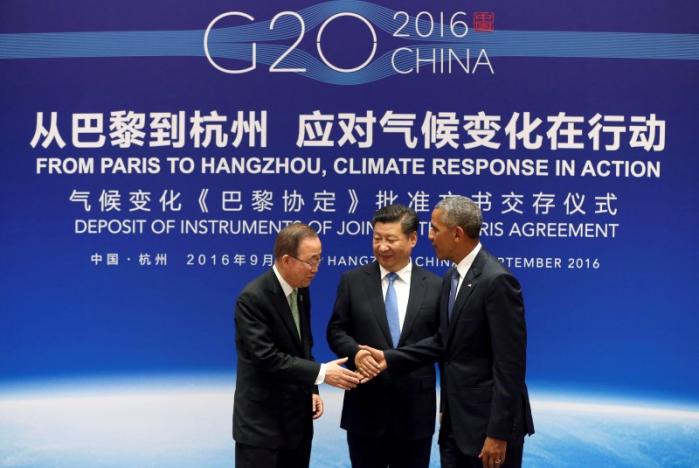
Fig 6: US, China ratify Paris climate agreement at G20
http://www.reuters.com/article/us-china-climatechange-idUSKCN11901W
Concluding question:
So can all the oil in Fig 5, even if economically recoverable, be burnt? That is doubtful and topic for another post.
Related posts:
25/6/2016 Peak oil in Asia and Oil Import Trends (part 2)
http://crudeoilpeak.info/peak-oil-in-asia-and-oil-import-trends-part-2
20/6/2016 Peak oil in Asia (part 1)
http://crudeoilpeak.info/peak-oil-in-asia-part-1
16/5/2013 Half of oil burnable in 2000-2050 to keep us within 2 degrees warming has been used up as we hit 400 ppm
http://crudeoilpeak.info/half-of-oil-burnable-in-2000-2050-to-keep-us-within-2-degrees-warming-has-been-used-up-as-we-hit-400-ppm