Where has all the diesel gone?
The moment of the truth for monthly fuel stock taking:
Stocks at beginning of month
+ Imports
– Exports
+ Refinery output
– Sales
= Stocks at end of month
Do the numbers add up for diesel? No. For January 2026 the gap was 322 ML
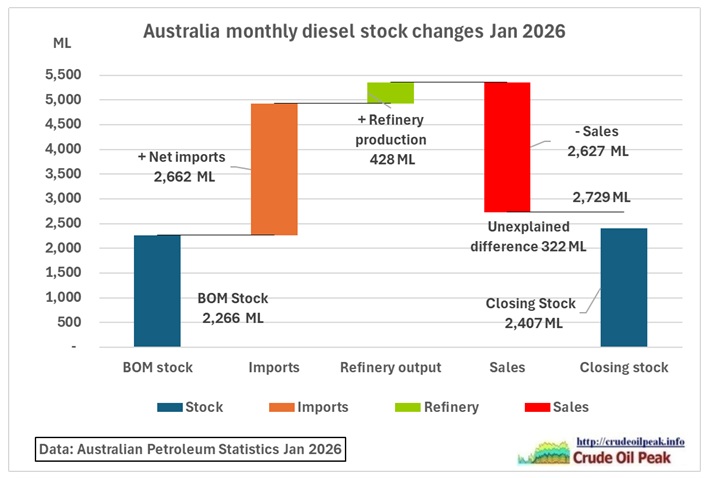 Fig 1: Discrepancies in sales and closing stock at end of month January 2026
BOM stock=stock at beginning of month = closing stock of previous month.
2,266+2,662+428-2,742=2,729 ML, but closing stock is actually 2,407 M, an unexplained difference of 322 ML, or 12 % – much larger than can be expected from inaccuracies in measurement and weight-to-volume conversions.
 Fig 2: Discrepancies in sales and closing stock at end of month January 2025
In January 2025 the gap was much lower.
However and what’s worse, the discrepancies are not caused by stocks reported in one month and sales in the next month, for example. They do not cancel out each other, they accumulate over the year (to 1,422 ML over 13 months)
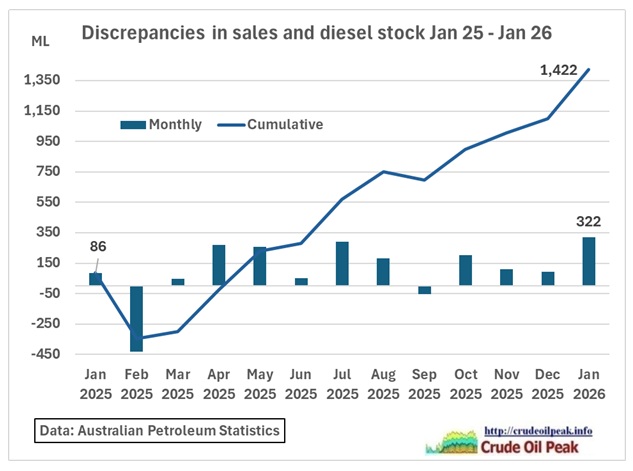 Fig 3: Monthly and cumulative discrepancies
This is a systemic reporting error. It was already identified in 2016 in a consultation paper by the Department of the Environment and Energy:
Mandatory Reporting Fact Sheet for Petroleum Consumers
This fact sheet is designed to help businesses which consume substantial volumes of petroleum products understand what mandatory reporting of petroleum statistics means for them
Businesses which only consume petroleum rather than produce, refine, sell or store petroleum, have never been requested to report data as part of the APS.
However, in recent years, some large petroleum consumers have become ‘direct importers’. These businesses directly import fuel for their own use (e.g. at a mine or non-ferrous refinery) from companies based overseas. The import volumes are captured through the Australian customs system and reported in the APS, but as the Australian-based consumer does not complete the APS survey, a data gap emerges in the statistics with consumption misaligned with imports and Australia’s petroleum stocks is underreported.
The Australian Government is currently consulting on the design and operation of mandatory reporting. The consultation closes on 28 October 2016.
https://www.energy.gov.au/sites/default/files/mandatory-reporting-petroleum-consumers-factsheet-2016.pdf
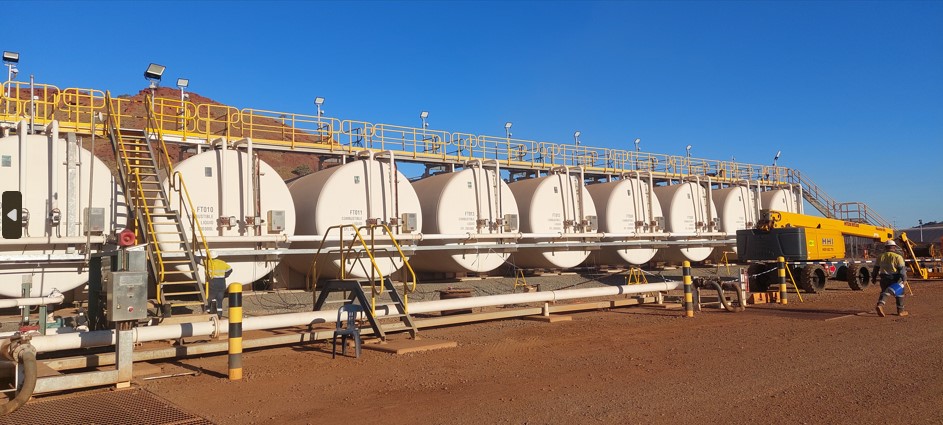 Fig 4: Tank farm in Australian mining 2.4 ML
https://australianminingreview.com.au/issue/2025/11/from-tank-to-tank-farm/
Petroleum and Other Fuels Reporting Rules 2017
made under the Petroleum and Other Fuels Reporting Act 2017
Compilation No. 1 Compilation date: 23 July 2021
5 Covered activities
For the purposes of paragraph (g) of the definition of covered activity in subsection 5(1) of the Act, the following activities are prescribed (to the extent they are not covered by other paragraphs of that definition):
(a) operating a fuel storage terminal, for covered products, that is connected to a refinery or a port by a pipeline;
(b) processing plant product.
https://policy.asiapacificenergy.org/sites/default/files/Petroleum%20and%20Other%20Fuels%20Reporting%20Rules%202017%20%282021%20Ed.%29.pdf
Australian mines have fuel storage NOT connected by a pipeline but by road tankers.
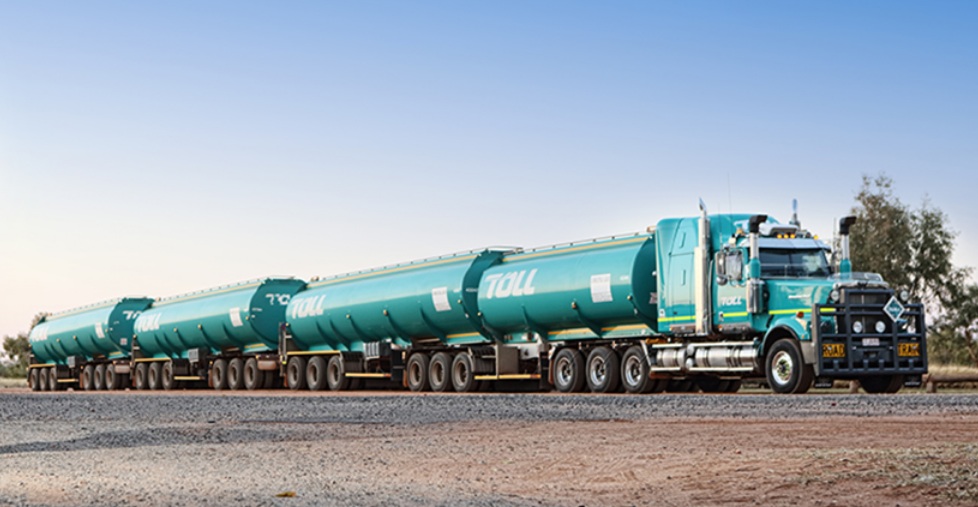 Fig 5: Quad road train 53 m, 164 tons
https://www.vivaenergy.com.au/blog/innovation/tough-trucks-for-one-of-the-toughest-roads-in-the-world
Examples:
BHP Mt Whaleback (Newman, WA), nearest port: Port Hedland, 450 km by road
Rio Tinto Tom Price Mine (WA), Pilbara, nearest port: Dampier, 280 km by road
Fortescue Solomon Hub (WA), nearest port: Port Hedland, 350 km by road
BHP Olympic Dam (SA), nearest port: Port Adelaide, 560 km by road
Carmichael Coal Mine (QLD), nearest port: Abbot Point, 300 km by road
Roy Hill Mine (WA), Pilbara, nearest port: Port Hedland, 344 km by road
Tropicana Gold Mine (WA), Kalgoorlie, nearest port: Esperance, 600 km by road
Tanami Gold Mine (NT), Tanami Desert, nearest port: Darwin, 1,000 km by road
So these mines do not report their stocks to the APS because they do not have pipelines to ports.
According to the Australian Energy Statistics Table F diesel consumption in the mining sector in 2023-24 was 300 PJ = 7,773 ML pa or 648 ML per month or 21 ML/day
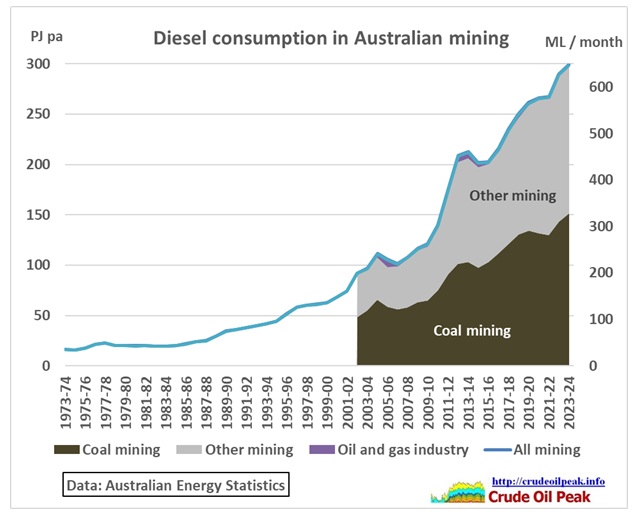 Fig 5: Australian diesel consumption in mining
Translating that into storage:
7 days: 150 ML, 14 days: 300 ML and 21 days: 450 ML
Whatever the storage, it is NOT included in the APS statistics. This is the under reporting.
Let us assume that Australian refineries supply 10% of the mining diesel requirement (this share is taken from the Port Hedland statistics)….
https://www.pilbaraports.com.au/pilbaraportsauthority/media/documents/port%20of%20port%20hedland/about%20the%20port%20of%20port%20hedland/port%20statistics%20and%20r
…..then the corresponding, estimated diesel imports would be 649*0.9 = 584 ML. These are captured by customs and entered in the APS statistics. But mining neither reports stocks nor consumption so we have these imports without matching stock changes and sales. So let us do a revised diesel flow calculation for January 2026:
BOM stock 2,266 ML
APS reported imports + 2,662 ML
Deduct imports of mining sector -584 ML (estimate)
Refinery production + 428 ML
Sales -2,627 ML
Resulting roll over EOM stocks 2,145 ML
APS reported EOM stock: 2,407 ML
Remaing gap: – 262 ML
Since the refinery production can be considered fairly accurate the remaining item of doubt are the sales (which are too high).
This problem is also known from the consultation:
“There is the potential for the inflation of consumption statistics where there is significant trading of oil within Australia before sale to consumers. For example, if Importer A sells diesel it has imported to Trader B, who sells it to Retailer C, who sells the diesel to motorists, two sales of the same diesel could be reported. If this double counting is not accounted for, Australia’s fuel consumption can be over-reported”
https://www.energy.gov.au/sites/default/files/consultation-mandatory-reporting-petroleum-statistics-2016.pdf
In summary, the gap in Fig 2 can be closed by taking out diesel imports for mining 584 ML and double counted sales of 262 ML
In conclusion the deficiencies in fuel reporting make it unnecessarily difficult for government to monitor the diesel supply and consumption situation. Reporting procedures will have to be changed and fast. They have to include regionalised stocks and consumption (by State or physical supply chains)
In relation to diesel stock in mining this is legally and geographically practically inaccessible to be diverted to other sectors of the economy, e.g. agriculture and transport of food.
There is now a parallel reporting system in place, the weekly publications of minimum stockholding obligations.
As shown in this post in Fig 4:
4 Apr 2026
Australian Diesel stock held in March 2026 declined by 10% in 4 weeks
https://crudeoilpeak.info/australian-diesel-stock-held-in-march-2026-declined-by-10-in-4-weeks
…. the MSO stock levels are higher than the APS data, very likely because more tankers are included in the EEZ. This reporting is not a solution to the APS discrepancy problem.