Categories
- Africa
- Algeria
- Angola
- Asia
- Australia
- Australia Budget
- Australia Transport
- Australian Mining
- Australian natural gas
- Australian rail
- Australian refineries
- Aviation
- BP
- BP Statistical Review
- Cars
- China
- Coal Seam Gas
- Crude oil analysis
- Debt
- Egypt
- Europe
- Feature1
- Global
- Hormuz
- India
- Iran
- Iraq
- Japan
- Korea
- Kuwait
- Latin America
- Libya
- Malaysia
- Middle East
- Motorways
- New South Wales
- North Sea
- OPEC
- Peaky Leaks
- Persian Gulf
- Power Supply
- Qatar
- Russia
- Saudi Arabia
- Shale gas
- Shell
- Shipping
- Singapore
- South East Asia
- Sudan
- Sydney
- Sydney Metros
- Syria
- Taiwan
- Tony Abbott Australian PM
- Ukraine
- United Arab Emirates
- United Kingdom
- United States
- Venezuela
- Vietnam
Sidebar menu
- Net oil importers
- Oil Exports
- Crude oil imports
- Downloads
- Latest Graphs
- Oil price analysis
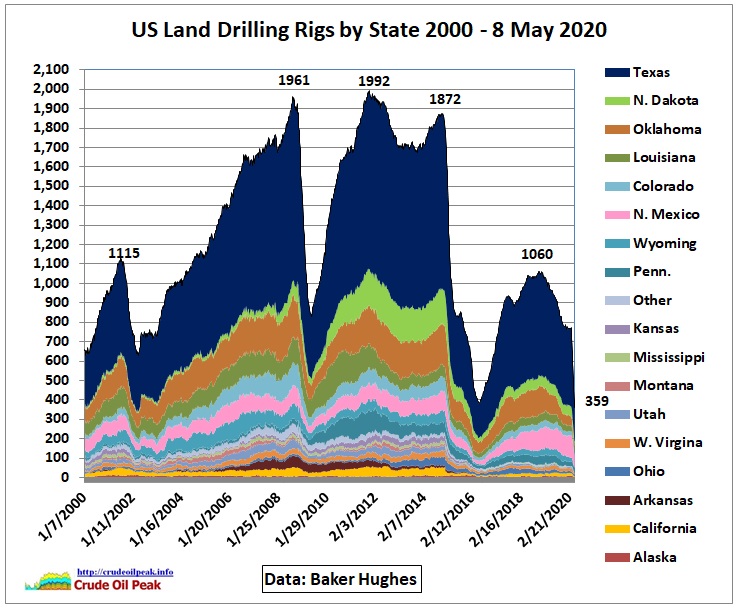 US drilling rig count
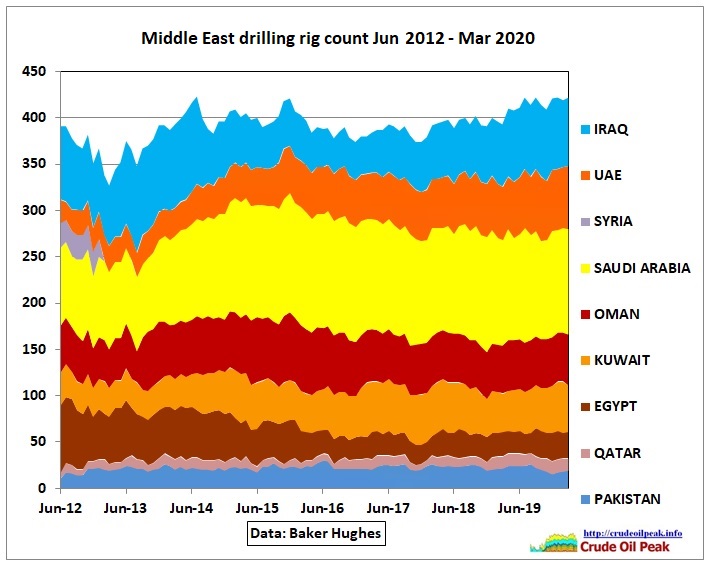 International drilling rig count
- Australian fuel prices
- Diary
- International oil companies
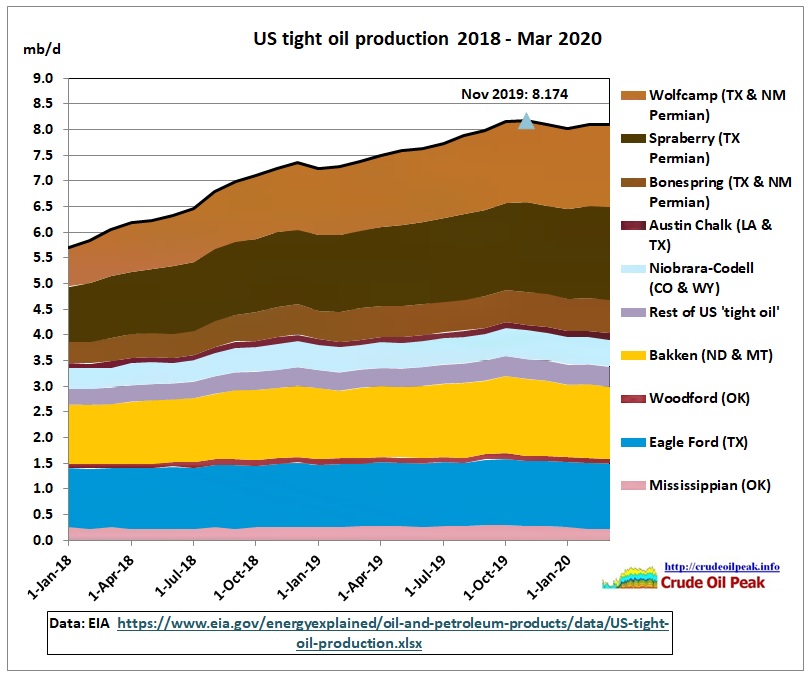 US tight oil production
 China peak oil
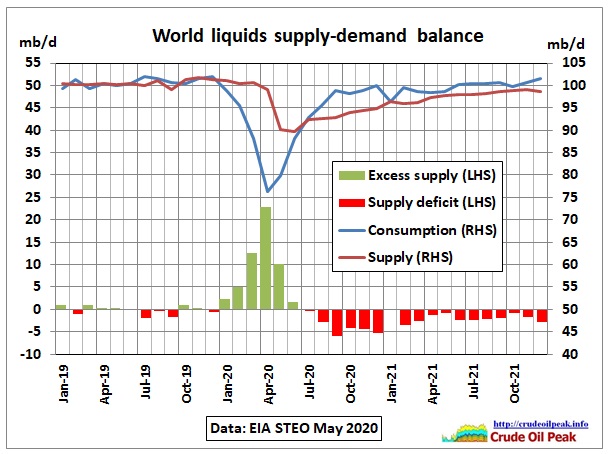 World liquids supply – demand balance
 Tankers arriving and departing in Sydney
 Australian oil and fuel imports
-
US tight oil Archive
-
![In this post we look at crude oil production in the World Energy Outlook released in November 2017 Fig 1: WEO 2017 oil supply Note that the 5 year interval table […]](https://crudeoilpeak.info/wp-content/uploads/IEA_WEO_2017_crude_comparison_2016-115x115.jpg "Does the IEA try to hide the conventional crude oil peak in its 2017 World Energy Outlook?")
Does the IEA try to hide the conventional crude oil peak in its 2017 World Energy Outlook?
Posted on December 3, 2017 | No CommentsIn this post we look at crude oil production in the World Energy Outlook released in November 2017 Fig 1: WEO 2017 oil supply Note that the 5 year interval table […] -
![OPEC Fig 1: OPEC’s incremental crude oil production Incremental production for each country is the production above the minimum production for the period Jan 2000 – May 2016 (the latest […]](https://crudeoilpeak.info/wp-content/uploads/World_Incremental_crude_production_2000-May2016-115x115.jpg "Incremental crude production update August 2016")
Incremental crude production update August 2016
Posted on September 11, 2016 | No CommentsOPEC Fig 1: OPEC’s incremental crude oil production Incremental production for each country is the production above the minimum production for the period Jan 2000 – May 2016 (the latest […] -
![The International Energy Agency’s Medium Term Oil Market Report 2015 included an interesting graph showing changes in US and Russian oil production for the next 5 years: IEA MTOMR February […]](https://crudeoilpeak.info/wp-content/uploads/2015/03/US_crude_and_NGL_production_2009_2020_IEA_MTOMR_2015-115x115.jpg "IEA report: US shale oil growth practically zero in 2017")
IEA report: US shale oil growth practically zero in 2017
Posted on March 3, 2015 | No CommentsThe International Energy Agency’s Medium Term Oil Market Report 2015 included an interesting graph showing changes in US and Russian oil production for the next 5 years: IEA MTOMR February […]